

Capable, responsible, and healthy adults are the foundation of any well-functioning and prosperous society, but in this regard the future of the United States is not as secure as it could be. This is because millions of American children live in families with incomes below the poverty line. A preponderance of evidence suggests that a lack of adequate family economic resources compromises children’s ability to grow and achieve success in adulthood, hurting them and the broader society as well.
Recognizing this challenge to America’s future, Congress asked the National Academies of Sciences, Engineering, and Medicine to conduct a comprehensive study of child poverty in the U.S., and to identify evidence-based programs and policies for reducing the number of children living in poverty by half within 10 years. The National Academies appointed a committee with expertise in economics, psychology, cognitive science, public policy, education, sociology, and pediatrics to conduct the study and issue a report.
The committee’s report concludes that poverty causes negative outcomes for children, especially if it occurs in early childhood or persists through a large part of childhood. Studies estimate that child poverty costs the nation between $800 billion and $1.1 trillion annually in terms of lost adult productivity, the increased costs of crime, and increased health expenditures. The report identifies two packages of policies and programs that could reduce child poverty in the U.S. by half within ten years, at a cost far lower than the costs the country bears from child poverty.
In 2015, the latest year for which the committee was able to generate estimates, more than 9.6 million U.S. children -- 13 percent of the nation’s children -- lived in families with annual incomes below a poverty line defined by the Supplemental Poverty Measure. Of these, 2.1 million children -- 2.9 percent of all U.S. children -- lived in “deep poverty,” in families with incomes less than half of the poverty line.
Studies indicate that poverty during childhood leads to poor outcomes later on, including lower educational attainment, difficulty obtaining steady, well-paying employment in adulthood, and a greater likelihood of risky behaviors, delinquency, and criminal behavior in adolescence and adulthood.
The burden of child poverty is not equally distributed across the country. Child poverty rates were much higher for Black children (18 percent) and Hispanic children (22 percent) than for non-Hispanic White children (8 percent). Rates were also much higher for children in immigrant families (21 percent) than for those in non-immigrant families (10 percent). Children in immigrant families (defined as those with at least one foreign-born parent) represent about a quarter of all children in the U.S, and the vast majority are U.S. citizens. Children living in households in which all members are citizens have a poverty rate of 10.2 percent, nearly three points below the 13.0 percent overall child poverty rate. By contrast, living in households with noncitizens—particularly unauthorized immigrants—is associated with higher poverty rates, even for children who are themselves U.S. citizens (Figure 1).
NOTE: Fraction of all children in each group: Child is not a citizen, some in household are unauthorized – 1.1%; Child is citizen, some in household are unauthorized– 6.9%; All household members are citizens – 81.5%; other – 10.0%.
Estimates of rates of child poverty and deep poverty were developed using the TRIM3 microsimulation model with U.S. Census Bureau Current Population Survey data for 2015, and adjusted for underreporting of benefits from several programs. The estimates are subject to error from sampling and other sources. Poverty estimates are based on the Supplemental Poverty Measure (SPM) and reflect the 2015 tax law. The 2015 SPM includes poverty lines for two-parent, two-child families were about $22,000 for those owning a home free and clear and about $26,000 for renters and homeowners with a mortgage. For more information, see the report, including technical appendixes, at nap.edu/reducingchildpoverty.
SOURCE: Estimates from TRIM3 commissioned by committee, which include adjustment for underreporting
In addition to demographic differences, the burden of child poverty is not equally distributed across the country. About one in seven children live in counties with persistently high child poverty (OPM child poverty rates always above 20 percent since 1980). The South and several large metropolitan areas in the Northeast regions have the highest proportions of children in counties with persistently high child poverty (Figure 2).
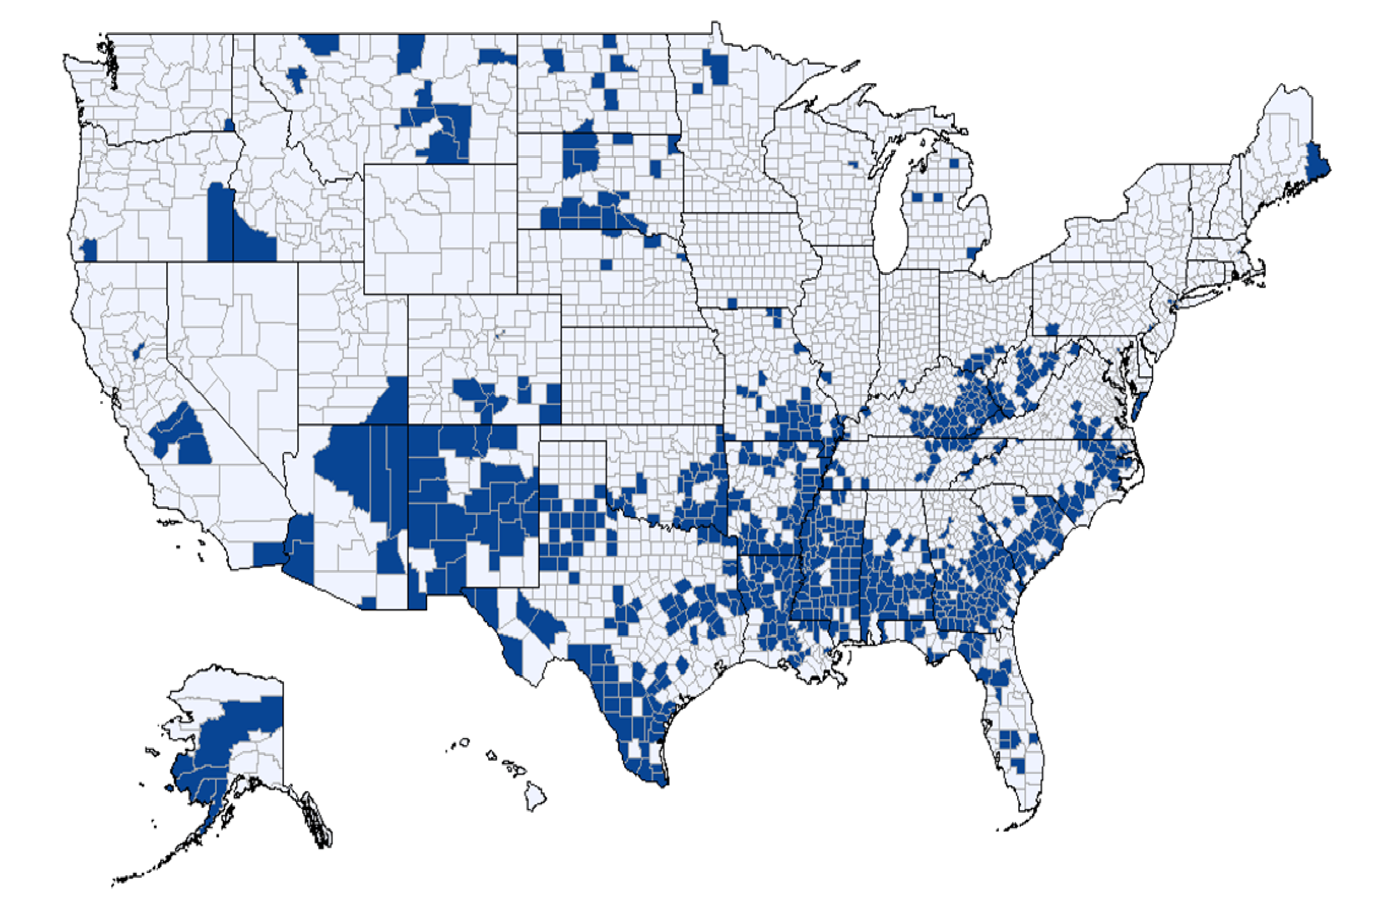
NOTE: OPM = Official Poverty Measure.
Source: Estimates by Committee from United States Population Estimates, 2016 Vintage, Census Bureau; data as of July 1, 2015. 2015 county child poverty rates from Census Small Area Income and Poverty Estimates (SAIPE) Program data.
American Indian and Alaska Native children (AIAN) are more likely to live in a persistently poor county—one that has had a child poverty rate above 20% for the past 30 years. However, there is a lack of data on the AIAN child population. Because of the relatively small size of this population, it often goes uncounted in national surveys or is combined with other small racial and ethnic groups. Moreover, evaluations of the effectiveness of programs and policies designed to combat child poverty—whether provided by a tribe or by federal or state governments—have rarely been conducted for this population. Federal program agencies and statistical agencies working with the U.S. Office of Management and Budget should explore ways to obtain sufficient sample sizes for the analysis of small population groups of concern for child poverty. Such groups include American Indian and Alaska Native families, families that have children with disabilities, and families with one or both parents involved in the criminal justice system.
Given the evidence that poverty harms children’s well-being, policies designed to reduce poverty might be expected to have the opposite effect, and the committee found that is the case. Many programs that alleviate poverty – either directly, by providing income, or by providing food, housing or medical care – have been shown to improve child well-being.
Specifically, the committee found that:
These federal programs have kept the child poverty rate lower than it would have been without them (Figure 3). For example, the committee found that without the largest three tax credit programs – the Earned Income Tax Credit, the Child Tax Credit, and the Additional Child Tax Credit – child poverty would have increased by nearly 50 percent, from 13 percent to 18.9 percent, an increase of 4.4 million children. SNAP had the next largest effect; without SNAP benefits, the child poverty rate would have increased to 18.2 percent. SNAP is also the single most important federal program for reducing deep poverty; without SNAP, the deep poverty rate is estimated to nearly double, from 2.9 percent to 5.7 percent.
The U.S. historical record shows that reducing child poverty is an achievable policy goal. Child poverty fell by nearly half between 1970 and 2016, and government programs such as the Earned Income Tax Credit and SNAP played important roles in achieving this drop (Figure 4). Rates of deep child poverty declined as well over that period. The experience of “peer” countries – such as the United Kingdom, which enacted policies that reduced its child poverty rate by half in a little less than a decade -- also demonstrate that this goal is achievable.
Notes: Poverty data are presented using the Supplemental Poverty Measure and adjusted for underreporting. The data reflect the 2015 tax law applied to the 2015 population. Results for the 2018 tax law applied to the 2015 population are similar and can be found at www.nap.edu/catalog/25246
SOURCE: Original analyses commissioned by the committee from Christopher Wimer (2017, October). The SPM poverty measure is anchored in 2012 living standards and adjusted back to 1967 using the Consumer Price Index. Income data are not adjusted for underreporting.
Source: OECD, Social Expenditure database (https://data.oecd.org/socialexp/family-benefits-public-spending.htm ); and OECD (2017).
Note: UK = United Kingdom, US = United States
The heart of the committee’s charge was is to identify policies and programs that have the potential to reduce child poverty and deep poverty in the United States by half within 10 years. With hundreds of local, state, federal, and international anti-poverty program and policy models to choose from, the committee developed a set of criteria to guide its selection process. These included: (1) the strength of the research and evaluation evidence; (2) likely reductions in the number of poor children; (3) the extent of child poverty reduction achievable within the subgroups with the highest child poverty rates; (4) cost; and (5) positive impacts on work, marriage, opportunity, and social inclusion.
The committee evaluated 10 different single-policy options – for example, expanding the Earned Income Tax Credit, raising the federal minimum wage, or introducing a universal child allowance – to see if any of them could achieve the goal of reducing child poverty by 50 percent.
The committee evaluated 10 program and policy options. Four of them are tied to work, three of them modify existing safety net programs, two come from other countries, and the final one modifies existing provisions relating to immigrants. It then formulated two variations for each of the 10 options, yielding 20 scenarios in all. The 10 options are as follows:
Program and policy options tied to work:
Modifications to existing safety net programs:
Options used in other countries:
Modifications to existing provisions relating to immigrants:
The committee’s simulations showed that no single program or policy option could meet the goal of reducing child poverty by half. A $3,000 per child per year child allowance policy would produce the largest poverty reduction, and it would meet the goal of reducing deep poverty (50 percent of SPM poverty) by half. A number of other program and policy options were also estimated to reduce child poverty substantially. Three of them involve modifications to existing programs: the EITC, SNAP, and subsidized housing.
The committee then developed four “packages” of policies and programs and evaluated them to see which, if any, could meet the 50 percent reduction goal. These four packages of policies and programs emphasize both poverty reduction and work incentives that could substantially reduce child poverty in the U.S. This includes two options that reduce child poverty by 50 percent. These packages expand upon existing policies and programs, such as SNAP, the Earned Income Tax Credit, and the Child and Dependent Care Tax Credit, and offer up new ones, such as a national job training program and a universal child allowance. The costs of these packages range from $9 billion to $108.8 billion per year, and have different impacts on child poverty, jobs, and the federal budget.
The change in the rates of child poverty and deep poverty under each package
Notes: Poverty data are presented using the Supplemental Poverty Measure and adjusted for underreporting. The data reflect the 2015 tax law applied to the 2015 population. Results for the 2018 tax law applied to the 2015 population are similar and can be found at www.nap.edu/catalog/25246
The report also explores contextual factors that affect the lives of many families in poverty – such as unstable and unpredictable incomes, poor neighborhood conditions, and racial and ethnic discrimination – and that should be considered when designing and implementing anti-poverty programs.