
Page 130
Appendix B
Glossary of Statistical and Clinical Trials Terms
Acceptance region The set of values of a test statistic for which the null hypothesis is not rejected.
Acceptance sampling A sampling method by which the sample is taken from groups or batches as they pass a specified time point, e.g., age, followed by sampling of individuals within the sampled groups.
Acquired immunodeficiency syndrome (AIDS) The late clinical stage of infection with human immunodeficiency virus (HIV), recognized as a distinct syndrome in 1981. The surveillance definition includes HIV-infected persons who have less than 200 CD4 + T lymphocytes per μL or a CD4 + T lymphocyte percentage of total lymphocytes of less than 14 percent, accompanied by any of 26 clinical conditions (e.g., opportunistic infection, Kaposi's sarcoma, wasting syndrome).
Adaptive cluster sampling A procedure in which an initial set of subjects is selected by a sampling procedure and, whenever the variable of interest of a selected subject satisfies a given criterion, additional subjects whose values are in the neighborhood of those for that subject are added to the sample.
Adaptive sampling A sampling procedure in which the selection process depends on the observed values of some variables of interest.
Additive effect A term used when the effect of administering two treatments together is the sum of their separate effects.
Page 131
Additive model A model in which the combined effect of several factors is the sum of the effects that would be produced by each of the factors in the absence of the others.
Adjustment A procedure for summarization of a statistical measure in which the effects of differences in composition of the population being compared have been minimized by statistical methods. Examples are adjustment by regression analysis and by standardization. See standardization.
Adverse event An undesirable or unwanted consequence experienced by a subject during a clinical trial irrespective of the relationship to the study treatment.
Age standardization A procedure for adjusting rates, e.g., death rates, designed to minimize the effects of differences in age composition when comparing rates for different populations.
Algorithm Any systematic process that consists of an ordered sequence of steps in which each step depends on the outcome of the previous one.
Algorithm, clinical An explicit description of steps to be taken in patient care in specified circumstances.
Alpha (α) The probability of a Type I error. The value of a is usually 0.05. See significance level.
Alternative hypothesis The hypothesis against which the null hypothesis is tested.
Analysis of covariance (ANCOVA) An extension of the analysis of variance that allows consideration of the possible effects of covariates on the response variable, in addition to the effects of the factor or treatment variables. The covariates are assumed to be unaffected by treatments, and in general, their relationship to the response is assumed to be linear.
Analysis of variance (ANOVA) A statistical technique that isolates and assesses the contributions of categorical independent variables to variations in the mean value of a continuous dependent variable. The total variance of a set of observations are partitioned according to different factors, e.g., sex, age, treatment groups, and compared by way of F tests. Differences between means can then be assessed.
Arc sin transformation
A transformation of the form 2 arc sin

~ enlarge ~
, used to stabilize the variance of a binomial random variable.
Area sampling A sampling method in which a geographical region is subdivided into smaller areas (counties, villages, city blocks, etc.), some of which are selected at random, and the chosen areas are then subsampled or completely surveyed. See cluster sampling.
Area under curve (AUC) A useful way of summarizing the information from
Page 132
a series of measurements made on an individual over time or for a doseresponse curve. Calculated by adding the areas under the curve between each pair of consecutive observations, using for example, the trapezium rule.
Arithmetic mean The sum of all the values in a set of measurements divided by the number of values in the set.
Assigned treatment The treatment designated to be given to a patient in a clinical trial as indicated at the time of enrollment.
Association Statistical dependence between two or more events, characteristics, or other variables. Most often applied in the context of binary variables forming a two-by-two contingency table. A positive association between two variables exists when the occurrence of higher values of a variable is associated with the occurrence of higher values of another variable. A negative association exists when the occurrence of higher values of one variable is associated with lower values of the other variable.
Assumptions The conditions under which statistical techniques give valid results.
Attack rate The cumulative incidence of a disease or condition in a particular group, during a limited period of time, or under special circumstances such as an epidemic.
Attributable risk
A measure of the association between exposure to a particular factor and the risk of a particular outcome, calculated as:

~ enlarge ~
incidence rate among exposed − incidence rate among unexposed/incidence rate among exposed
Attrition The loss of subjects over the period of a longitudinal study. See missing values.
Average An average value represents or summarizes the relevant features of a set of values, and in this sense the term includes the median and the mode.
Balanced design An experimental design in which the same number of observations is taken for each combination of the experimental factors.
Bar chart A graphical representation for displaying discrete data organized in such a way that each observation can fall into one and only one category of the variable. Frequencies are listed along one axis, and categories of the variable are listed along the other axis. The frequencies of each group of observations are represented by the lengths of the corresponding bars. See histogram.
Baseline data A set of data collected at the beginning of a study.
Page 133
Bathtub curve The shape taken by the hazard rate for the event of death in humans. It is relatively high during the first year of life, decreases fairly soon to a minimum, and begins to climb again sometime around ages 45 to 50.
Bayesian confidence interval An interval of a posterior distribution such that the density at any point inside the interval is greater than the density at any point outside. For any probability level, there is generally only one such interval, which is often known as the highest posterior density region.
Bayesian inference Statistical inference based on Bayes's theorem. The focus of the Bayesian approach is the probability distribution of any unknowns, given available information. The process deals with probabilities of hypotheses and probability distributions of parameters, which are not taken into account in classical statistical inference.
Bayes's theorem
A theorem in probability theory named after Thomas Bayes (1702–1761), an English clergyman and mathematician. It is a procedure for revising and updating the probability of some event in the light of new evidence. In its simplest form, the theorem is written in terms of conditional probabilities as:
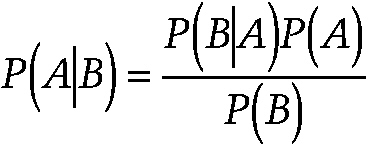
~ enlarge ~
where P(A|B) denotes the conditional probability of event A conditional on event B. The overall probability of an event among a population before knowing the presence or absence of new evidence is called prior probability. The updated probability of the event after receiving new information is called posterior probability.
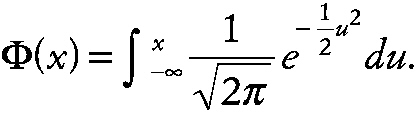
Bell-shaped distribution A probability distribution having the overall shape of a vertical cross-section of a bell. Examples are normal distribution and Student's t distribution.
Benefit-cost ratio The ratio of net present value of measurable benefits to costs. Calculation of a benefit-cost ratio is used to determine the economic feasibility or success of a program.
Beta (b) The probability of a Type II error.
Bias Deviation of results or inferences from the truth or processes leading to such a deviation. Any trend in the collection, analysis, interpretation, publication, or review of data that can lead to conclusions that are systematically different from the truth. Statistical bias occurs when the extent to which the statistical method used in a study does not estimate the
Page 134
quantity thought to be estimated or does not test the hypothesis to be tested.
Bimodal distribution A probability distribution or a frequency distribution with two modes.
Binary sequence A sequence whose elements take one of only two possible values, usually denoted 0 or 1.
Binary variable A variable having only two possible values, usually labeled 0 or 1. Data involving this type of variable often require specialized statistical techniques such as logistic regression.
Binomial distribution The probability distribution of the number of occurrences of a binary event in a sample of n independent observations. The distribution is associated with two mutually exclusive outcomes, e.g., death or survival, success or failure.
Bioassay The quantitative evaluation of the potency of a substance by assessing its effects on tissues, cells, live experimental animals, or humans.
Bioequivalence The degree to which clinically important outcomes of treatment by a new preparation resemble those of a previously established preparation.
Bioequivalence trials Trials carried out to compare two or more formulations of a drug containing the same active ingredient to determine whether the different formulations give rise to comparable levels in blood.
Biological efficacy The effect of treatment for all persons who receive the therapeutic agent to which they were assigned. It measures the biological action of a treatment among compliant persons.
Biological plausibility The criterion that an observed, presumably or putatively causal association fits previously existing biological or medical knowledge.
Biometry The application of statistical methods to the study of numerical data on the basis of observations of biological phenomena.
Biostatistics The application of statistical methods to biological and medical problems.
Biplots A graphical display of multivariate data designed to show any structure, pattern, or relationship between variables.
Bit A unit of information consisting of one binary digit.
Bivariate data Data in which the subjects each have measurements on two variables.
Bivariate distribution The joint distribution of two random variables, x and y.
Page 135
Blinding A procedure used in clinical trials to avoid the possible bias that might be introduced if the patient or doctor, or both, knew which treatment the patient would be receiving. A trial is double blind if both patient and doctor are not aware of treatment given; if either the doctor or the patient is not aware of treatment given, the trial is single blind. Also called masking.
Block A term used in experimental design to refer to a homogeneous grouping of experimental units designed to enable the experimenter to isolate and, if necessary, eliminate variability due to extraneous causes.
Block randomization A random allocation procedure used to keep the numbers of subjects in the different groups of a clinical trial closely balanced at all times.
Blot, Western, Northern, Southern Varieties of tests using electrophoresis, nucleic acid base pairing, or protein-antibody interaction to detect and identify DNA or RNA in samples. The Southern blot is used to identify a specific segment of DNA in a sample. The Northern blot detects and identifies samples of RNA. The Western blot is widely used in a test for detection of human immunodeficiency virus infection.
Bootstrap A data-based simulation method for statistical inference that can be used to study the variability of estimated characteristics of the probability distribution of a set of observations and provide confidence intervals for parameters in situations in which these are difficult or impossible to derive in the usual way.
Bonferroni correction A procedure for guarding against an increase in the Type I error when performing multiple significance tests. To maintain the Type I error at some selected value, a, each of the m tests to be performed is judged against a significance level, a/m. This method is acceptable for a small number of simultaneous tests to be performed (up to five).
Causality The relating of causes to the effects that they produce. A cause is termed “necessary” when it must always precede an effect. This effect need not be the sole result of the one cause. A cause is termed “sufficient” when it inevitably initiates or produces an effect. Any given cause may be necessary, sufficient, neither necessary nor sufficient, or both necessary and sufficient.
Censored observation Observation with an unknown value due to the occurrence of an event (e.g., death, loss to follow-up, or termination of study) before the occurrence of the event of interest in the study.
Page 136
Central limit theorem The tendency for the sampling distribution of means to be a normal (Gaussian) distribution, even if the data do not have a Gaussian distribution, for sufficiently large numbers of subjects.
Central range The range within which the central 90 percent of values of a set of observations lie.
Central tendency A property of the distribution of a variable usually measured by statistics such as the mean, median, and mode.
Chimerism In genetics, the presence in an individual of cells of different origin, such as of blood cells derived from a dizygotic cotwin.
Chi-square distribution The probability distribution of the sum of squares of a number of independent standard normal variables.
Chi-square test Any statistical test based on comparison of a test statistic to a chi-square distribution. The most common chi-square tests (e.g., the Mantel-Haenszel and Pearson chi-square tests) are used to detect whether two or more population distributions differ from one another. These tests usually involve counts of data and may involve comparison of samples from the distribution under study or comparison of a sample to a theoretically expected distribution.
Chi-square test for trend A test applied to a two-dimensional contingency table in which one variable has two categories and the other has k ordered categories to assess whether there is a difference in the trend of the proportions in the two groups.
Clinical decision analysis A procedure designed to provide insight into the structure of a clinical problem and to identify the main determinants of diagnostic and therapeutic choice. This procedure is useful to small numbers of clinical cases, even to a single patient (see n-of-1 study). The procedure has four stages:
1. Definition of the clinical problem and structuring it as a decision tree. This includes description of the patient, of the possible diagnostic and therapeutic actions, and of the possible outcomes after treatment.
2. Estimation of probabilities for diagnostic and therapeutic outcomes.
3. Performance of the requisite computations for determination of the preferred course of action.
4. Presentation of the results of the analysis in a clinically useful way.
Clinical epidemiology Epidemiological study conducted in a clinical setting, usually by clinicians, with patients as the subjects of study. It uses the
Page 137
information from classic epidemiology to aid decision making about identified cases of disease.
Clinical trial A prospective study that involves human subjects, designed to determine the effectiveness of a treatment, a surgical procedure, or a therapeutic regimen administered to patients with a specific disease. Clinical trials have four phases:
Phase I Safety and pharmacologic profiles. This involves the initial introduction of a candidate vaccine or drug into a human population to determine its safety and mode of action. In drug trials, this phase may include studies of dose and route of administration. Phase I trials usually involve less than 100 healthy volunteers.
Phase II Pilot efficacy studies. This initial trial aims to examine efficacy in about 200 to 500 volunteers. The focus of vaccine trials is immunogenicity, whereas with drugs the focus is on the demonstration of safety and efficacy in comparison with those of other existing regimens. Often, subjects are randomly allocated to study and control groups.
Phase III Extensive clinical trial. This phase aims to complete assessment of safety and efficacy. It involves large numbers, possibly thousands, of volunteers from one center or many centers (a multicenter trial), usually with random allocation to study and control groups.
Phase IV This phase is conducted after the national drug registration authority (the Food and Drug Administration in the United States) has approved the drug for distribution or marketing. The trial is designed to determine a specific pharmacological effect or the effects of long-term use or to establish the incidence of adverse reactions. Ethical review is required in phase IV trials.
Clinical versus statistical significance The distinction between results in terms of their possible clinical importance rather than simply in terms of their statistical significance. For example, very small differences that have little or no clinical importance may turn out to be statistically significant. The implications of any finding in a medical investigation must be judged on both clinical and statistical grounds.
Clinimetrics The study of indices and rating scales used to describe or measure symptoms, physical signs, and other clinical phenomena in clinical medicine.
Closed sequential design See sequential analysis.
Cluster analysis A set of statistical methods for constructing a sensible and
Page 138
informative classification of an initially unclassified set of data using the variable values observed on each individual or item.
Cluster sampling A sampling method in which each unit (cluster) selected is a group of persons (all persons in a city block, a family, a school, or a hospital) rather than an individual.
Code of conduct A formal statement of desirable conduct that research workers or practitioners are expected to honor. Examples are the Hippocratic Oath, the Nuremberg Code, and the Helsinki Declaration.
Coefficient of concordance A measure of the agreement among several rankings or categories.
Coefficient of determination The square of the correlation coefficient between two variables. It gives the proportion of the variation in one variable that is accounted for by the other.
Coefficient of variation A measure of spread for a set of data, defined as 100 x standard deviation / mean. Originally proposed as a way of comparing the variability in different distributions but found to be sensitive to errors in the mean.
Collinearity Very high correlation between variables. See multicollinearity.
Comorbidity A disease(s) that coexist(s) in a study participant in addition to the index condition that is the subject of study.
Conditional probability The probability that event A occurs given the outcome of some other event, event B; usually written P(A|B). Conditional probabilities obey all the axioms of probability theory. See Bayes's theorem.
Confidence interval The computed interval with a given probability, e.g., 95 percent, that the true value of a variable such as a mean, proportion, or rate is contained within the interval.
Confidence limits The upper and lower boundaries of the confidence interval.
Confidence profile method A method of meta-analysis that uses a set of quantitative techniques that include parameters, functions, and prior distributions (in a Bayesian application). Its goal is to use evidence to derive maximum likelihood estimates and covariances (in a non-Bayesian application) or joint probability distributions (in a Bayesian application) for parameters of interest. Distributions and estimates can be used to make decisions about interventions or calculations of other parameters or to plan research to gather additional information about any parameter.
Confounding A process observed in some factorial designs in which a measure of the effect of an exposure on risk is distorted because of the
Page 139
association of the exposure with some other factor(s) that influences the outcome under study.
Confounding variable A variable that can cause or prevent the outcome of interest, is not an intermediate variable, and is associated with the factor under investigation.
Contingency table A tabular cross-classification of data such that subcategories of one characteristic are indicated horizontally (in rows) and subcategories of another characteristic are indicated vertically (in columns). The simplest contingency table is the fourfold or two-by-two table analyzed by using the chi-square statistic. Three- and higher-dimensional tables are analyzed by using log-linear models.
Continual reassessment method An approach that applies Bayesian inference to determine the maximum tolerated dose in a phase I trial. The method begins by assuming a logistic regression model for the dosetoxicity relationship and a prior distribution for the parameters. After each patient's toxicity result becomes available, the posterior distribution of the parameters is recomputed and used to estimate the probability of toxicity at each of a series of dose levels.
Control group Subjects with whom comparison is made in a case-control study, randomized controlled trial, or some other variety of epidemiological study.
Controlled trial A phase III clinical trial in which an experimental treatment is compared with a control treatment, the latter being either the current standard treatment or a placebo.
Control statistics Statistics calculated from sample values X1, X2, . . ., Xn that elicit information about some characteristic of a process that is being monitored.
Correlation The degree to which variables change together.
Correlation coefficient An index that quantifies the linear relationship between a pair of variables. The coefficient takes values between −1 and 1, with the sign indicating the direction of the relationship and the numerical magnitude indicating its strength. A value of zero indicates the lack of any linear relationship between two variables.
Correlation matrix A square, symmetric matrix with rows and columns corresponding to variables in which the off-diagonal elements are correlations between pairs of variables and the elements on the main diagonal are unity.
Cost-benefit analysis An economic analysis in which the costs of medical care and the benefits of reduced loss of net earnings due to the preven-
Page 140
tion of premature death or disability are considered. The general rule for the allocation of funds in a cost-benefit analysis is that the ratio of marginal benefit (the benefit of preventing an additional case) to marginal cost (the cost of preventing an additional case) should be equal to or greater than 1.
Cox's proportional hazards model A method that allows the hazard function to be modeled on a set of explanatory variables without making restrictive assumptions about the dependence of the hazard function on time. Estimates of the parameters in the model, i.e., β1, β2, . . ., βp, are usually obtained by maximum likelihood estimation and depend only on the order in which events occur, not on the exact time of their occurrences.
Critical region The values of a test statistic that lead to rejection of a null hypothesis. The size of the critical region is the probability of obtaining an outcome belonging to this region when the null hypothesis is true, i.e., the probability of a Type I error. See also acceptance region.
Critical value The value with which a statistic calculated from sample data is compared to determine whether a null hypothesis should be rejected. The value is related to the particular significance level chosen.
Cross-validation The division of data into two subsets of approximately equal size, one of which is used to estimate the parameters in some model of interest and the other of which is used to assess whether the model with these parameter values fits adequately.
Cumulative frequency distribution A listing of the sample values of a variable together with the proportion of the observations less than or equal to each value.
Decision analysis An approach that involves identification of all available choices and the potential outcomes of each in a series of decisions that must be made about aspects of patient care: diagnostic procedures, therapeutic regimens, and prognostic expectations. The range of choices can be plotted on a decision tree, where at each branch or decision node the probabilities of each outcome are displayed.
Decision function A concept used in decision analysis that tells the experimenter how to conduct the statistical aspects of an experiment and what action to take for each possible outcome. See also loss function.
Decision tree A graphical representation of the alternatives available at each stage in the process of decision making, where decision options are represented as branches and subsequent possible outcomes are represented as further branches. The decisions and the eventualities are presented in
Page 141
the order in which they are likely to occur. The junction at which a decision must be taken is called a “decision node.”
Degrees of freedom (df) The number of independent units of information in a sample relevant to the estimation of a parameter or calculation of a statistic. For example, in a contingency table it is one less than the number of row categories multiplied by one less than the number of column categories. Also used to refer to a parameter of various families of distributions, such as chi-square, Student's t, and F distributions.
Dependent variable A variable whose value is dependent on the effect of another variable(s)—an independent variable(s)—in the relationship under study. In statistics, it is the variable predicted by a regression equation.
Descriptive statistics A general term for methods of summarizing and tabulating data that make their main features more transparent, for example, calculating means and variances and plotting histograms.
Deviance A measure of the extent to which a particular model differs from the saturated model for a data set.
Dichotomous variable Synonym for binary variable.
Directionality The direction of inference of a study, i.e., retrospective or prospective, or of the relationship between variables, such as a negative or a positive association indicated by a correlation coefficient.
Discrete variables Variables having only integer values, e.g., number of births or number of pregnancies.
Discriminant analysis A statistical analytical technique used on multivariate data that aims to assess whether or not a set of variables distinguish or discriminate between two (or more) groups of individuals. It separates sets of observed values and allocates new values from two (or more) discrete populations to the correct population with minimal probability of classification.
Distribution The complete summary of the frequencies of the values or categories of a measurement obtained for a group of persons. It tells either how many or what proportion of the group was found to have each value (or each range of values) out of all the possible values that the quantitative measure can have.
Distribution function A function that gives the relative frequency with which a random variable falls at or below each of a series of values. Examples include normal distribution, lognormal distribution, chi-square distribution, t distribution, F distribution, and binomial distribution.
Dose-ranging trial A clinical trial, usually undertaken at a late stage in the development of a drug, to obtain information about the appropriate
Page 142
magnitude of initial and subsequent doses. Most common is the parallel-dose design, in which one group of subjects is given a placebo and other groups are given different doses of the active treatment.
Dose-response curve A plot of the values of a response variable against the corresponding values of the dose of drug received or level of exposure endured.
Dose-response relationship A relationship in which a change in amount, intensity, or duration of exposure is associated with a change—either an increase or a decrease—in the risk of a specified outcome.
Double-blind trial A procedure of blind assignment to study and control groups and blind assessment of outcome, designed to ensure that ascertainment of outcome is not biased by knowledge of the group to which an individual was assigned. Double refers to both subjects or patients and observers or clinicians.
Dummy variables The variables resulting from recording of categorical variables with more than two categories into a series of binary variables.
Effect measure A quantity that measures the effect of a factor on the frequency or risk of health outcome. Three such measures are attributable fractions, which measure the fraction of cases due to a factor; risk and rate differences, which measure the amount a factor adds to the risk or rate of a disease; and risk and rate ratios, which measure the amount by which a factor multiplies the risk or rate of disease.
Effect modifier A factor that modifies the effect of a putative causal factor under study. For example, age is an effect modifier for many conditions, and immunization status is an effect modifier for the consequences of exposure to pathogenic organisms. Effect modification is detected by varying the selected effect measure for the factor under study across levels of another factor.
Efficacy The effect of a treatment relative to the effect a control treatment in the ideal situation in which all persons fully comply with the treatment regimen to which they were assigned by random allocation.
Endpoint A clearly defined outcome or event associated with an individual in a medical investigation. An example is the eath of a patient.
Equipoise A state of genuine uncertainty about the benefits or harms that may result from each of two or more regimens. A state of equipoise is an indication for a randomized controlled trial because there are no ethical concerns about one regimen being better for a particular patient.
Error, Type I (α error) The error of rejecting a true null hypothesis, i.e., declaring that a difference exists when it does not.
Page 143
Error, Type II (β error) The error of failing to reject a false null hypothesis, i.e., declaring that a difference does not exist when in fact it does.
Estimate Either a single number (point estimate) or a range of numbers (interval estimate) which is inferred to be plausible for some parameter of interest.
Estimation The process of providing a numerical value for a population parameter on the basis of information collected from a sample. If a single figure for the unknown parameter is calculated, the process is called “point estimation.” If an interval within which the parameter is likely to fall is calculated, the procedure is called “interval estimation.”
Exact method A statistical method based on the actual, i.e., “exact,” probability distribution of the study data rather than on an approximation such as the normal or chi-square distribution, e.g., Fisher's exact test.
Experimental study A study in which conditions are under the direct control of the investigator. A population is selected for a planned trial of a regimen whose effects are measured by comparing the outcome of the regimen in the experimental group with the outcome of another regimen in a control group. Clinical trials fall under this heading.
Explanatory trial A clinical trial designed to explain how a treatment works.
Factor A term that is used in a variety of ways in statistics but that is most commonly used to refer to a categorical variable, with a smaller number of levels, under investigation in an experiment as a possible source of variation.
Factor analysis A set of statistical methods for analysis of the correlations among several variables to estimate the number of fundamental dimensions that underlie the observed data and to describe and measure those dimensions.
Factorial design A method of setting up an experiment or study to ensure that all levels of each intervention or classificatory factor occur with all levels of the others and that their possible interactions are investigated. The simplest factorial design is one in which each of two treatments or interventions is either present or absent so that subjects are divided into four groups: those receiving neither treatment, those receiving only the first treatment, those receiving only the second treatment, and those receiving both treatments.
False-negative rate The proportion of cases in which a diagnostic test indicates that a disease is absent from patients who have the disease.
False-positive rate The proportion of cases in which a diagnostic test indicates that a disease is present in disease-free patients.
F distribution The probability distribution of the ratio of two independent
Page 144
random variables, each having a chi-square distribution, divided by their respective degrees of freedom.
Fibonacci dose escalation scheme A scheme designed to estimate the maximum tolerated dose during a phase I clinical trial, using as few patients as possible. Using the National Cancer Institute standards for adverse drug reactions, the procedure begins patient accrual with three patients at an initial dose level and continues at each subsequent dose level until at least one toxicity of grade 3 or above is encountered. Once the latter occurs, three additional patients are entered at that level and six patients are entered into each succeeding level. The search scheme stops when at least two of six patients have toxicities of grade >3.
Fisher's exact test The test for association in a two-by-two table that is based upon the exact hypergeometric distribution of the frequencies within the table. The procedure consists of evaluating the sum of the probabilities associated with the observed table and all possible two-by-two tables that have the same row and column totals as the observed data.
Fisher's information matrix The inverse of the variance-covariance matrix of a set of parameters.
Fisher's z transformation
A transformation of Pearson's product moment correlation coefficient, r, given by
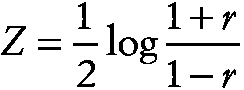
~ enlarge ~
The statistic z has mean
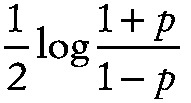 ,
,
~ enlarge ~
where p is the population correlation value, and variance
 ,
,
~ enlarge ~
where n is the sample size. The transformation may be used to test hypotheses and to construct confidence intervals for p.
Fishing expedition A term used to describe comparisons made within a data set not specifically prescribed before the start of the study.
Fitted value Refers to the value of the response variable predicted by some estimated model.
Five-number summary A method of summarizing a set of observations by using the minimum value, the lower quartile, the median, upper quartile, and maximum value. Forms the basis of the box-and-whisker plot.
Fixed effects The effects attributable to a finite set of levels of a factor that are of specific interest. For example, the investigator may wish to compare the effects of three particular drugs on a response variable.
Page 145
Fixed effects model A model that contains only factors with fixed effects.
Frequency distribution See distribution.
F test A test for the equality of the variances of two populations having normal distributions, based on the ratio of the variances of a sample of observations taken from each. Commonly used in the analysis of variance, in which testing of whether particular variances are the same also tests for the equality of a set of means.
Function A quality, trait, or fact that is so related to another as to be dependent upon and to vary with this other.
Functional relationship The relationship between the true values of variables, i.e., the values obtained under the assumption that the variables were measured without error.
Funnel plot A plotting device used in meta-analysis to detect publication bias. The estimate of risk is plotted against sample size. If there is no publication bias, the plot is funnel-shaped. Publication bias, in which studies with significant results are more likely to be published than those with small or no significant effects, removes part of the lower left hand corner of the funnel.
Gaussian distribution A bell-shaped frequency distribution of infinite range of a random variable. All possible values of the variable are displayed on the horizontal axis. The frequency (probability) of each value is displayed on the vertical axis, producing the graph of the distribution. The properties are as follows: (1) it is a continuous, symmetrical distribution; both tails extend to infinity; (2) the arithmetic mean, mode, and median are identical; and (3) its shape is completely determined by the mean and standard deviation. Another name for normal distribution.
Generalized linear models (GLMs) A class of models that arise from a natural generalization of ordinary linear regression. The function of the expected value of the response variable, y, is modeled as a linear combination of the explanatory variables, X1, X2, . . ., .Xq. The other components of such models are a specification of the form of the variance of the response variable and of its probability distribution.
Goodness-of-fit Degree of agreement between an empirically observed distribution and a mathematical or rhetorical distribution.
Goodness-of-fit statistics Measures of the agreement between a set of sample observations and the corresponding values predicted from some model of interest. Examples are chi-square statistic, deviance, and likelihood ratio.
Group sequential design See sequential analysis.
Page 146
Half-normal plot A plot for diagnosing model inadequacy or revealing the presence of outliers, in which the absolute values of, e.g., the residuals from a multiple regression are plotted against the quantiles of the standard normal distribution. Outliers will appear at the top right of the plot as points that are separated from the others, whereas systematic departures from a straight line could indicate that the model is unsatisfactory.
Hazard function The probability that an individual experiences an event (death, improvement, etc.) in a small time interval, given that the individual has survived up to the beginning of the interval. It is a measure of how likely an individual is to experience an event as a function of the age of the individual. The hazard function may remain constant, increase, or decrease. See also survival function and bathtub curve.
Hazard rate A theoretical measure of the risk of occurrence of an event, e.g., death or a new disease, at a point in time, t, defined mathematically as the limit, as Δt approaches zero, or of the probability that an individual well at time t will experience the event by t + Δt, divided by Δt.
Hazard regression A procedure for modeling the hazard rate that does not depend on the assumptions made in Cox's proportional hazards model, namely, that the loghazard function is an additive function of both time and the vector of covariates.
Heteroscedasticity Nonconstancy of the variance of a measure over the levels of the factors under study.
Histogram A graphical representation of a set of observations, in which class frequencies are represented by the areas of rectangles centered on the class interval.
Homoscedasticity Constancy of the variance of a measure over the levels of the factors under study.
Human immunodeficiency virus (HIV) The pathogenic organism responsible for acquired immunodeficiency syndrome (AIDS).
Human leukocyte antigen (HLA) Antigens on cell surfaces that are important for foreign antigen recognition and that play a role in the coordination and activation of the immune response.
Hypergeometric distribution The exact probability distribution of the frequencies in a two-by-two contingency table, conditional on the marginal frequencies being fixed at their observed levels. Usually approximated by the binomial distribution.
Independent variable One of (perhaps) several variables that appear as arguments in a regression equation.
Page 147
Indicator variable A variable that takes only one of two possible values, with one (usually 1) indicating the presence of a condition and the other (usually 0) indicating the absence of the condition. Used mainly in regression analysis.
Informative censoring Censored observations that occur for reasons related to treatment, e.g., when treatment is withdrawn as a result of a deterioration in the physical condition of a patient.
Informative prior A term used in the context of Bayesian inference to indicate a prior distribution that reflects empirical or theoretical information regarding the value of an unknown parameter.
Informed consent The voluntary consent given by a patient to participate in, usually, a clinical trial after being informed of its purpose, method of treatment, procedure for assignment to treatment, benefits and risks associated with participation, and required data collection procedures and schedule.
Initial data analysis The first phase in the examination of a data set that consists of a number of informal steps, including checking the quality of the data, calculating simple summary statistics, and constructing appropriate graphs. The general aim is to clarify the structure of the data, obtain a simple descriptive summary, and possibly get ideas for a more sophisticated analysis.
Instantaneous death rate Synonym for hazard function.
Intention-to-treat analysis A procedure in which all patients randomly allocated to a treatment in a clinical trial are analyzed together as representing that treatment, whether or not they received or completed the prescribed regimen. Failure to follow this step defeats the main purpose of random allocation and can invalidate the results.
Interaction The interdependent operation of two or more causes to produce or prevent an effect.
Interim analysis Analysis made before the planned end of a clinical trial, usually with the aim of detecting treatment differences at an early stage and thus preventing as many patients as possible from receiving an “inferior” treatment.
Intermediate variable (intervening or mediator variable) A variable that occurs in a causal pathway from an independent to a dependent variable. It causes variation in the dependent variable and is caused to vary by the independent variable. Its value is altered to block or alter the effect(s) of another factor. Such a variable is statistically associated with both the independent and the dependent variables.
Page 148
Interquartile range A measure of spread given by the difference between the first and third quartiles of a sample.
Interrupted time series design A study in which a single group of subjects is measured several times before and after some event or manipulation. Also used to describe investigation of a single subject. See n-of-1 clinical trials.
Interval censored observations Observations that often arise in the context of studies of time elapsed to a particular event when subjects are not monitored continuously. Instead, the prior occurrence of the event of interest is detectable only at specific times of observation, e.g., at the time of medical examination.
Intervention study An investigation involving intentional change in some aspect of the status of the subjects, e.g., introduction of a preventive or therapeutic regimen, to test a hypothesis. Usually it is an experiment such as a randomized clinical trial.
Iterated bootstrap A two-stage procedure in which the samples from the original bootstrap population are themselves bootstrapped. The technique can give confidence intervals of more accurate coverage than simple bootstrapping.
Iteration The successive repetition of a mathematical process, using the result of one stage as the input for the next.
Jackknife A technique for estimating the variance and the bias of an estimator. If the sample size is n, the estimator is applied to each subsample of size n − 1, obtained by dropping a measurement from analysis. The sum of squared differences between each of the resulting estimates and their mean, multiplied by (n − 1)/n, is the jackknife estimate of variance; the difference between the mean and the original estimate, multiplied by (n − 1), is the jackknife estimate of bias.
Kaplan-Meier estimate A nonparametric method of compiling life or survival tables. This combines calculated probabilities of survival and estimates to allow censored observations, which are assumed to occur randomly. The intervals are defined as ending each time that an event, (e.g., death or withdrawal) occurs and are therefore unequal.
Kappa coefficient A chance corrected index of the agreement between, e.g., judgments and diagnoses made by two raters. Calculated as the ratio of the observed excess over chance agreement to the maximum possible excess over chance, the coefficient takes the value unity when there is perfect agreement and the value zero when observed agreement is equal to chance agreement.
Page 149
Kendall's tau statistic Measures of the correlation between two sets of rankings. Kendall's tau statistic is a rank correlation coefficient based on the number of inversions in one ranking compared with the number of inversions in another, e.g., on S, given by S = P − Q, where P is the number of concordant pairs of observations, that is, pairs of observations such that their rankings on the two variables are in the same direction, and Q is the number of discordant pairs for which rankings on the two variables are in the reverse direction.
Kruskal-Wallis test A distribution-free method that is the analogue of the analysis of variance of a one-way design. It tests whether the groups to be compared have the same population median.
Kurtosis The extent to which the peak of a unimodal probability distribution or frequency distribution departs from the shape of a normal distribution by either being more pointed (leptokurtic) or flatter (platykurtic). For a normal distribution, the value of kurtosis is zero (mesokurtic).
Least significant difference test An approach to comparing a set of means that controls the familywise error rate at some particular level, say α. The hypothesis of the equality of the means is tested first by an α-level F test. If this test is not significant, then the procedure terminates without making detailed inferences on pairwise differences; otherwise, each pairwise difference is tested by an α-level Student's t test.
Least squares estimation A method used to estimate parameters, particularly in regression analysis, by minimizing the difference between the observed response and the value predicted by the model. Often referred to as “ordinary least squares” to differentiate this simple version of the technique from more involved versions, such as weighted least squares and iteratively weighted least squares.
Likelihood distance test A procedure for the detection of outliers that uses the difference between the log likelihood of the complete data set and the log likelihood when a particular observation is removed. If the difference is large, then the observation involved is considered an outlier.
Likelihood function A function constructed from a statistical model and a set of observed data that gives the probability of the observed data for various values of the unknown model parameters. The parameter values that maximize the probability are the maximum likelihood estimates of the parameters.
Likelihood ratio The ratio of the likelihoods of the data under two hypotheses, H0 and H1. May be used to assess H0 against H1.
Likert scales An ordinal scale of responses to a question or statement or-
Page 150
dered in a hierarchical sequence, such as from “strongly agree” through “no opinion” to “strongly disagree.”
Linear function A function of a set of variables, parameters, etc., that does not contain powers or cross-products quantities.
Linear model A statistical model in which the expected value of a parameter for a given value of a factor, x, which is assumed to be equal to a + bx, where a and b are constants.
Linear regression Regression analysis of data using linear models.
Linear trend A relationship between two variables in which the values of one variable change at a constant rate as the value of the other variable increases.
Linkage analysis A method used to test the hypothesis that a genetic marker of known location is on a chromosome different from that on which a gene postulated to govern susceptibility to a disease is located.
Lods A term often used in epidemiology for the logarithm of an odds ratio. Also used in genetics for the logarithm of a likelihood ratio.
Logarithmic transformation The transformation of a variable, x, obtained by taking y = log(x). Often used when the frequency distribution of the variable, x, shows a moderate to large degree of skewness to achieve normality.
Logistic regression A form of regression analysis used when the response variable is a binary variable.
Logit The logarithm of the ratio of frequencies of two different categorical outcomes, such as healthy versus sick.
Logit confidence limits The upper and lower ends of the confidence interval for the logarithm of the odds ratio.
Log-linear model A statistical model that uses an analysis of variance type of approach for the modeling of frequency counts in contingency tables.
Log-normal distribution The probability distribution of a variable, x, for which log (x − a) has a normal distribution with mean m and variance σ2.
Log-rank test A method for comparing the survival times of two or more groups of subjects that involves the calculation of observed and expected frequencies of failures in separate time intervals.
Loss function A concept used in decision analysis that assigns numerical values to making good or poor decisions.
Low-dose extrapolation The process applied to the results from bioassays for carcinogenicity conducted with animals at doses that are generally well above human exposure levels to assess risk in humans.
Page 151
Main effect An estimate of the independent effect of (usually) a factor variable on a response variable in an analysis of variance.
Mann-Whitney test A test that compares two groups of ordinal scores and that shows the probability that they form parts of the same distribution. It is a nonparametric equivalent of the t test.
Mantel-Haenszel estimate An estimate of the assumed common odds ratio in a series of two-by-two contingency tables arising from different populations, e.g., occupation or country of origin.
Mantel-Haenszel test A calculated test statistic that uses a standard normal deviate rather than a chi-square value. The test, used to control for confounding, examines the null hypothesis that the variables are independent by looking at just one of the four cells.
Mantel's trend test A regression test of the odds ratio against a numerical variable representing ordered categories of exposure. It may be used to analyze the results of a case-control study.
Markov process A stochastic process such that the conditional probability distribution for the state at any future instant, given the present state, is unaffected by any additional knowledge of the past history of the system. See also random walk.
Masking Procedure intended to keep a participant(s) in a study from knowing some fact(s) or observation(s) that might bias or influence that participant's actions or decisions regarding the study. See also blinding.
Matching The process of making a study group and a comparison group comparable with respect to extraneous factors. Often used when selecting cases and controls in retrospective studies to control variation in a response variable due to sources other than those immediately under investigation.
Maximum likelihood estimate (MLE) The value for an unknown parameter that maximizes the probability of obtaining exactly the data that were observed.
Maximum tolerated dose The highest possible dose of a drug that can be given with acceptable toxicity to the patient. This dose is usually determined in a phase I clinical trial and is the dose recommended for use in future studies.
McNemar's test A form of the chi-square test for matched-pairs data. It is a special case of the Mantel-Haenszel test.
Mean squared error The expected value of the square of the difference between an estimator and the true value of a parameter. If the estimator is unbiased, then the mean squared error is simply the variance of the
Page 152
estimator. For a biased estimator the mean squared error is equal to the sum of the variance and the square of the bias.
Mean square ratio The ratio of two mean squares in analysis of variance.
Mean squares The name used in the context of analysis of variance for estimators of particular variances of interest. For example, in the analysis of a one-way design, the within-groups mean square estimates the assumed common variance in k groups.
Measurement bias Systematic error arising from inaccurate measurements (or classification) of a study variable(s) for subjects.
Measurement error Errors in reading, calculating, or recording a numerical value. The difference between the observed values of a variable recorded under similar conditions and some fixed true value.
Measurement scale The range of possible values for a measurement, e.g. the set of possible responses to a question.
Measures of association Numerical indices quantifying the strength of the statistical dependence of two or more qualitative variables.
Median A measure of central tendency. It is the value in a set of ranked observations that divides the data into two parts of equal size. When there is an odd number of observations, the median is the middle value. When there is an even number of observations, the median is calculated as the average of the two central values.
Meta-analysis The process of using statistical methods to combine the results of two or more independent studies to yield an overall answer to a question of interest. The rationale behind this approach is to provide a test with more power than that provided by the separate studies themselves.
Minimization A method for allocation of patients to treatments in clinical trials that is usually an acceptable alternative to random allocation. The procedure ensures balance between the groups to be compared on prognostic variables, by allocating with a high degree of probability the next patient to enter the trial to whatever treatment would minimize the overall imbalance between the groups on the prognostic variables, at that stage of the trial.
Minimum chi-squared estimation A method of estimation that finds estimates of the parameters of some model of interest by minimizing the chi-squared statistic for the assessment of differences between the observed values and those predicted by the model.
Missing values Observations missing from a set of data. These occur for a variety of reasons, e.g., subjects drop out of the study, subjects do not
Page 153
appear for one or other of the scheduled visits, or there is an equipment failure. Otherwise known as “missing completely at random.”
Mixed-effects model A model usually encountered in the analysis of longitudinal data in which some of the parameters are considered to have fixed effects and some are considered to have random effects. For example, in a clinical trial with two treatment groups in which the response variable is recorded for each subject at a number of visits, the treatments would usually be regarded as having fixed effects and the subjects would usually be regarded as having random efffects.
Mode One of the measures of central tendency. It is the most frequently occurring value in a set of observations.
Monte Carlo method Method for finding solutions to mathematical and statistical problems by simulation.
Multicenter study A clinical trial conducted simultaneously in a number of participating hospitals or clinics, with all centers following a universal study protocol and with independent random allocation within each center.
Multicollinearity In multiple regression analysis, a situation in which at least some of the independent variables are highly correlated directly or indirectly with each other. Such a situation can result in inaccurate estimates of the parameters in the regression model.
Multilevel analysis Method of analysis that explains individual outcomes in terms of both individual and environmental or aggregate variables.
Multimodal distribution A probability distribution or frequency distribution with several modes. Multimodality is often taken as an indication that the observed distribution results from the mixing of the distributions of relatively distinct groups of observations.
Multinomial distribution The probability distribution associated with the classification of each of a sample of individuals into one of several mutually exclusive and exhaustive categories. When the number of categories is two, the distribution is called binomial.
Multiple comparison tests Procedures for detailed simultaneous examination of the differences between a set of means, usually after a general hypothesis that they are all equal has been rejected. Examples are Bonferroni correction, Duncan's multiple-range test, Dunnett's test, and Tukey's method. No single technique is best in all situations, and a major distinction between techniques is how they control the possible inflation of the Type I error.
Multiple correlation coefficient The correlation between the observed values of the dependent variable in a multiple regression and the values
Page 154
predicted by the estimated regression equation. Often used as an indicator of how useful the explanatory variables are in predicting the response.
Multiple end points A term used to describe the variety of outcome measures used in many clinical trials. There are a number of ways to measure treatment success, e.g, length of patient survival, percentage of patients experiencing tumor regression, or percentage of patients surviving for 2 years. The aim in using a variety of such measures is to gain better knowledge of the differences between the treatments being compared.
Multiple regression A statistical model in which a continuous response variable, y, is regressed on a number of explanatory variables, X1, X2, . . ., Xq. The model is E(y) = β0 + β1X1 + . . . + βqXq where E denotes the expected value. The parameters in the model, the regression coefficients β0, β1, βq, are generally estimated by least squares estimation. Each coefficient gives the change in the response variable corresponding to a unit change in the appropriate explanatory variable, conditional on the other variables remaining constant.
Multiplication rule for probabilities For events A and B that are independent, the probability that both occur is the product of the separate probabilities, i.e., P(A and B) = P(A) P(B), where P denotes probability.
Multiplicative model A model in which the combined effect of a number of factors, when applied together, is the product of their separate effects.
Multivariate analysis An analytical method that allows the simultaneous study of two or more dependent variables.
Multivariate analysis of variance A procedure for testing the equality of the mean vectors of more than two populations. The technique is analogous to the analysis of variance of univariate data, except that the groups are compared on q response variables simultaneously. In the univariate case, F tests are used to assess the hypotheses of interest. In the multivariate case, no single test statistic that is optimal in all situations can be constructed.
Multivariate data Data for which each observation consists of values for more than one random variable, e.g., measurements of blood pressure, temperature, and heart rate for a number of subjects.
Multivariate distribution The simultaneous probability distribution of a set of random variables.
Multivariate probit analysis A method for assessing the effect of explana-
Page 155
tory variables on a set of two or more correlated binary response variables.
Negative predictive value The probability that a person having a negative result or a diagnostic test does not have the disease.
Newman-Keuls test A multiple-comparison test used to investigate in more detail the differences existing between a set of means, as indicated by a significant F test in an analysis of variance.
n-of-1 clinical trial A variation of a randomized controlled trial in which a sequence of alternative treatment regimens is randomly allocated to a single patient. The outcomes of successive regimens are compared, with the aim being determination of the optimum regimen for the patient.
Nominal variable A variable that gives the appropriate label of an observation after allocation to one of several possible categories, for example, gender (male or female), marital status (married, single, or divorced), or blood group (A, B, AB, or O).
Nomogram A line chart showing scales for the variables involved in a particular formula in such a way that corresponding values for each variable lie on a straight line that intersects all the scales.
Nonrandomized clinical trial A trial in which a series of consecutive patients receive a new treatment and those who respond (according to some predefined criterion) continue to receive it. Patients who fail to respond receive an alternative treatment. The two groups are then compared on one or more outcome variables.
Nonresponse A term used for failure to provide the relevant information being collected in a survey for a variety of reasons. A large number of nonrespondents may introduce bias into the final results.
No-observed-effect level (NOEL) The dose level of a compound below which there is no evidence of an effect on the response of interest.
Normal approximation to the binomial distribution A normal distribution with mean np and variance np (1 − p) that acts as an approximation to a binomial distribution as n, the number of trials, increases. The term p represents the probability of a “success” of any trial.
Normal distribution A probability distribution of a random variable, x, that is assumed by many statistical methods. The properties of a normal distribution are as follows: (1) it is a continuous, symmetrical distribution; both tails extend to infinity; (2) the arithmetic mean, mode, and median are identical; and (3) its shape is determined by the mean and standard deviation. Synonym for Gaussian distribution.
Page 156
Null distribution The probability distribution of a test statistic when the null hypothesis is true.
Null hypothesis The statistical hypothesis that one variable has no association with another variable or set of variables or that two or more population distributions do not differ from one another.
Number needed to treat In clinical treatment regimens, the number of patients with a specified condition who must follow the specified regimen for a prescribed period to prevent the occurrence of a specified complication(s) or an adverse outcome(s) of the condition.
O'Brien's two-sample tests Tests that assess the differences between treatment groups and that take account of the possible heterogeneous nature of the response treatment. They may lead to the identification of subgroups of patients for whom the experimental therapy might have the most or the least benefit.
Odds The ratio of the probability of the occurrence of an event to that of the nonoccurrence of the event.
Odds ratio The ratio of the odds for a binary variable in two groups of subjects. For example, if the two possible states of the variable are labeled “success” and “failure,” then the odds ratio is a measure of the odds of a success in one group relative to that in the other.
One:m matching A form of matching often used when control subjects are more readily obtained than cases. A number, m (m > 1), of controls are attached to each case, with these being known as the matched set. The theoretical efficiency of such matching in estimating, e.g., relative risk, is m/(m+1), so one control per case is 50 percent efficient, whereas four controls per case is 80 percent efficient. Increasing the number of controls beyond 5 to 10 brings rapidly diminishing returns.
One-tailed test A statistical significance test based on the assumption that the data have only one possible direction of variability. The choice between a one-sided test and a two-sided test must be made before any test statistic is calculated.
One way design See analysis of variance.
Ordinal variable A measurement that allows a sample of individuals to be ranked with respect to some characteristic but for which differences at different points of the scale are not necessarily equivalent. For example, anxiety might be rated on a scale of “none,” “mild,” “moderate,” and “severe,” with the values 0, 1, 2, and 3 respectively, being used to label the categories.
Outcomes All the possible results that may stem from exposure to a causal
Page 157
factor or from preventive or therapeutic interventions; all identified changes in health status arising as a consequence of the handling of a health problem.
Outliers Observations that differ so widely from the rest of the data as to lead one to suspect that a gross error may have been committed in measurement or recording.
Overmatching A situation that may arise when the matching procedure partially or completely obscures evidence of a true causal association between the independent and dependent variables. The matching variable may be an intermediate cause in the causal chain, or it may be strongly affected by or a consequence of such an intermediate cause.
Paired availability design A design that can reduce selection bias in situations in which it is not possible to use random allocation of subjects to treatments. In the experimental groups, the new treatment is made available to all subjects, although some may not receive it. In the control groups, the experimental treatment is generally not available to subjects, although some subjects may receive it in special circumstances.
Paired samples In a clinical trial, two samples of observations with the characteristic feature that each observation in one sample has one and only one matching observation in the other sample. One member of each pair receives the experimental regimen, and the other member of each pair receives a suitably designated control regimen.
Parallel groups design A simple experimental setup in which two different groups of patients, e.g., treated and untreated patients, are studied concurrently.
Parallelism in analysis of covariance One of the assumptions made in the analysis of covariance, namely, that the slope of the regression line relating the response variable to the covariate is the same in all treatment groups.
Parametric hypothesis A hypothesis concerning the parameter(s) of a distribution, e.g., the hypothesis that the mean for a population equals the mean for a second population when the populations are each assumed to have a normal distribution.
Parametric methods Procedures for testing hypotheses about parameters in a population described by a specified distributional form, often a normal distribution. Student's t test is an example of such a method.
Partial correlation The correlation between a pair of variables after adjusting for the effect of a third variable.
Partial multiple correlation coefficient An index for examining the linear
Page 158
relationship between a response variable and a group of explanatory variables while controlling for another group of variables.
Path analysis A mode of analysis involving assumptions about the direction of causal relationships between linked sequences and configurations of variables. This allows the analyst to construct and test the appropriateness of alternative models (in the form of a path diagram) of the causal relations that may exist within the array of variables.
Pearson's product moment correlation See correlation coefficient.
Person-time A measurement combining persons and time, used as denominator in person-time incidence and mortality rates. It is the sum of individual units of time that the persons in the study population have been exposed to the conditions of interest. The most frequently used person-time is person-years.
Person-time incidence rate
A measure of the incidence rate of an event, e.g., disease or death, in a population at risk, given by

~ enlarge ~
Person-years See person-time.
Placebo effect A phenomenon in which patients given only inert substances often show subsequent clinical improvement compared with patients who received the actual treatment.
Placebo reactor A term for those patients in a clinical trial who report side effects normally associated with the active treatment while receiving a placebo.
Play-the-winner rule A procedure in clinical trials in which the response to treatment is either positive (a success) or negative (a failure). One of the two treatments is selected at random and used on the first patient; thereafter, the same treatment is used on the next patient whenever the response of the previously treated patient is positive and the other treatment is used whenever the response is negative.
Point estimate See estimate.
Poisson distribution A distribution function used to describe the occurrence of rare events or to describe the sampling distribution of isolated counts in a continuum of time or space. This distribution is used to model person-time incidence rates.
Polynomial regression A linear model in which powers and possibly cross-products of explanatory variables are included, e.g., y = β0 + β1x + β2x2.
Positive predictive value The probability that a person having a positive result on a diagnostic test actually has a particular disease.
Page 159
Power The probability of rejecting the null hypothesis when it is false. Power gives a method of discriminating between competing tests of the same hypothesis, with the test with the higher power being preferred. It is also the basis of procedures for estimating the sample size needed to detect an effect of a particular magnitude.
Precision A term applied to the likely spread of estimates of a parameter in a statistical model. Measured by the standard error of the estimator, which can be decreased, and hence precision is increased, by using a larger sample size.
Predictor variables The variables that appear on the right side of the equation defining, e.g., multiple regression or logistic regression, and that aim to predict or explain the response variable.
Prior distribution Probability distribution that summarizes information about a random variable or parameter known or assumed at a given time point before further information about empirical data is obtained. It is used in the context of Bayesian inference.
Probability
The quantitative expression of the chance that an event will occur. It can be defined in a variety of ways, of which the most common is
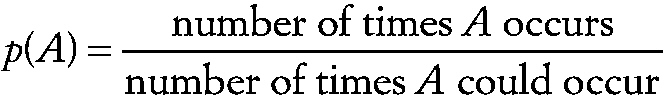
~ enlarge ~
Probability distribution For a discrete random variable, a mathematical formula that gives the probability of each value of the variable. Examples are binomial distribution and Poisson distribution. For a continuous random variable, a curve described by a mathematical formula that specifies, by way of areas under the curve, the probability that the variable falls within a particular interval. Examples are normal distribution and exponential distribution.
Probability sample A sample obtained by a method in which every individual in a finite population has a known, but not necessarily equal, chance of being included in the sample.
Probability (p) value The probability of the observed data (or data showing a more extreme departure from the null hypothesis) when the null hypothesis is true.
Probit analysis A technique most commonly used in bioassays, particularly toxilogical experiments in which sets of animals are subject to known levels of a toxin, and a model is required to relate the proportions surviving at a particular dose to the dose. In this type of analysis the probit transformation of a proportion is modeled as a linear function of the
Page 160
dose or, more commonly, the logarithm of the dose. Estimates of the parameters in the models are found by maximum likelihood estimation.
Probit transformation A transformation used in the analysis of dose-response curve.
Proportional hazards model See Cox's proportional hazards model.
Proportional odds model A model for investigating the dependence of an ordinal variable on a set of explanatory variables. In the most commonly used version of the model, the cumulative probabilities, P (y ≤ k), where y is the response variable with categories 1 ≤ 2 ≤ 3 ... ≤ c, are modeled as linear functions of the explanatory variables via the logistic transformation. The name proportional odds arises since the odds ratio of having a score of k or less for two different sets of values of the explanatory variables does not depend on k.
Protective efficacy (PE) of a vaccine The proportion of cases of disease prevented by the vaccine, usually estimated as PE = (ARU − ARV)/ ARU, where ARV and ARU are the attack rates of the disease under study among the vaccinated and unvaccinated cohorts, respectively. For example, if the rate of disease is 100 per 10,000 in an unvaccinated group but only 30 per 10,000 in a comparable vaccinated group, the PE is 70 percent.
Protocol A formal document outlining the proposed procedures for carrying out a clinical trial. The main features of the document are study objectives, patient selection criteria, treatment schedules, methods of patient evaluation, trial design, procedures for dealing with protocol violations, and plans for statistical analysis.
Protocol violations Deliberate or accidental failure of patients to follow one or other aspects of a protocol for a clinical trial. For example, the patients may not have taken their prescribed medication. Such patients are said to show noncompliance.
Quadrant sampling A sampling procedure used with spatial data in which sample areas (the quadrants) are taken and the number of objects or events of interest occurring in each is recorded.
Quantile-quantile (Q-Q) plot An informal method for assessing assumptions when fitting statistical models or using significance tests. For example, in investigating the assumption that a set of data is from a normal distribution, the ordered sample values, X(1), X(2),. . . X(n) are plotted against the values
Page 161
Φ−1(pi) where pi = (i − 1/2) / n, and
~ enlarge ~
Quantiles Divisions of a probability distribution or frequency distribution into equal, ordered subgroups, e.g., quartiles or percentiles.
Quantit model A three-parameter nonlinear logistic regression model.
Quartiles The values that divide a frequency distribution or probability distribution into four equal parts.
Quasilikelihood A function that is used as the basis for the estimation of parameters when it is not possible (or desirable) to make a particular distributional assumption about the observations, with the consequence that it is not possible to write down their likelihood. The function depends on the assumed relationship between the mean and the variance of the observations.
Quintiles The set of four variate values that divide a frequency distribution or a probability distribution into five equal parts.
Quota sample A sample in which the units are not selected completely at random, but are selected in terms of a certain number of units in each of a number of categories, e.g., 10 men over age 40 or 25 women between ages 30 and 35.
Radial plot of odds ratios A diagram used to display the odds ratios calculated from a number of different clinical trials of the same treatment(s). The diagram consists of a plot of y = Δ̂/SE (Δ̂) against x = 1/ SE (Δ̂), where Δ̂ is the logarithm of the odds ratio from a particular study and SE is standard error. Often useful in meta-analysis.
Random allocation, randomization Allocation of individuals to groups, e.g., for experimental and control regimens, by chance. It follows a predetermined plan that is usually devised with the aid of a table of random numbers. The control and experimental groups should be similar at the start of the investigation, and the investigator's personal judgment and prejudices should not influence allocation.
Random effects The effects attributable to an infinite set of levels of a factor, only a randomsample of which occurs in the data.
Randomization tests Procedures for determining statistical significance directly from data, without recourse to some particular sampling distribution. The data are divided repeatedly between treatments, and for each
Page 162
division the relevant test statistic e.g., t or F is calculated to determine the proportion of the data permutations that provide as large a test statistic as that associated with the observed data. If that proportion is smaller than some significance level ?, the results are significant at the ? level.
Randomized clinical trial (RCT) A clinical trial that involves the formation of treatment groups by the process of random allocation.
Randomized consent design A design originally introduced to overcome some of the perceived ethical problems facing clinicians entering patients in randomized clinical trials. After the patient's eligibility is established, the patient is randomized to one of two treatments, treatments A and B. The risks, benefits, and treatment options are discussed with patients randomized to receive treatment A, and the patients are asked if they are willing to receive the therapy. Those who do not agree receive treatment B or some alternative treatment. The same procedure is followed for patients who were randomized to receive treatment B.
Random sample Either a set of n independent and identically distributed random variables or a sample of n individuals selected from a population in such a way that each sample of the same size is equally likely.
Random variable A variable, the values of which occur according to some specified probability distribution.
Random variation The variation in a data set unexplained by identifiable sources.
Random walk The path traversed by a particle that moves in steps, with each step being determined by chance in regard to direction or magnitude, or both. Random walk may be applied to sequential sampling.
Range The difference between the largest and the smallest observations in a data set.
Range of equivalence The range of differences between two treatments being compared in a clinical trial within which it is not possible to make a definite choice of treatment.
Rank correlation coefficients Correlation coefficients that depend only on the ranks of the variables, not on their observed values. Examples are Kendall's tau statistics and Spearman's rho correlation coefficient.
Rank order statistics Statistics based only on the rank of the sample observations, e.g., Kendall's tau statistics.
Rate A measure of the frequency of occurrence of a phenomenon, given by
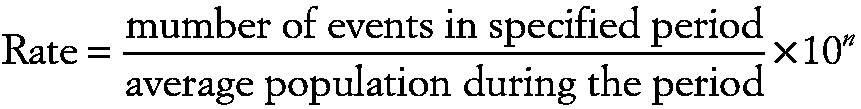
~ enlarge ~
Page 163
Ratio The value obtained by dividing one quantity by another: a general term of which rate, proportion, percentage, etc., are subsets. It is an expression of the relationship between a numerator and a denominator in which the two are usually separate and distinct quantities, with neither being included in the other.
Receiver operating characteristic (ROC) curve A plot of the sensitivity (y axis) of a diagnostic test against the complement of its specificity (x axis) that ascertains the balance between specificity and sensitivity corresponding to various cutoffs.
Regression analysis A general term for methods of analysis that are concerned with estimating the parameters in some postulated relationship between a response variable and one or more explanatory variables. Examples are linear regression, logistic regression, and multiple regression.
Regression coefficient, regression weight See multiple regression.
Regression diagnostics Procedures designed to investigate the assumptions underlying a regression analysis (e.g., normality or homogeneity of variance) or to examine the influence of particular datum points or small groups of datum points on the estimated regression coefficients.
Regression line Diagrammatic presentation of a regression equation, usually drawn with the independent variable, x, as the abscissa and the dependent variable, y, as ordinate.
Relative risk A measure of the association between exposure to a particular factor and risk of a certain outcome, calculated as
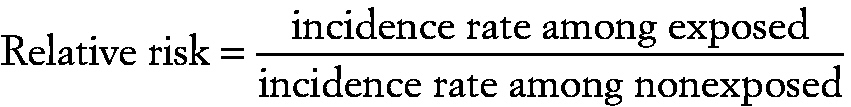
~ enlarge ~
Relative survival The ratio of the observed survival for a given group of patients to the survival that group would have experienced on the basis of the life table for the population for which the diagnosis was made.
Reliability The degree to which the results obtained by a measurement procedure can be replicated.
Reproducibility The closeness of results obtained on the same test material under changes of reagents, conditions, techniques, apparatus, laboratories, and so on.
Residual The difference between the observed value of a response variable (yi) and the value predicted by some model of interest (yi). Examination of a set of residuals, usually by informal graphical techniques, allows the assumptions made in the model-fitting exercise (e.g., normality and homogeneity of variance) to be checked.
Page 164
Residual confounding Potential confounding by factors or variables not yet considered in the analysis, which may be directly observable or not.
Residual sum of squares See analysis of variance.
Response bias The systematic component of the difference between information provided by survey respondent and the “truth.”
Response rate The number of completed or returned survey instruments (questionnaires, interviews, etc.) divided by the total number of persons who would have been surveyed.
Response variable The variable of primary importance in medical investigations, since the major objective is usually to study the effects of a treatment or other explanatory variables on this variable.
Restricted maximum likelihood estimation (REML) A method of estimation in which estimators of parameters are derived by maximizing the restricted likelihood rather than the likelihood itself.
Resubstitution error rate The estimate of the proportion of subjects misclassified by a rule derived from a discriminant analysis, obtained by reclassifying the training set by using the rule.
Ridge regression A method of regression analysis designed to overcome the possible problem of multicollinearity among the explanatory variables. Such multicollinearity makes it difficult to estimate the separate effects of variables on the response. This form of regression may result in increased precision.
Ridit analysis A method of analysis for ordinal variables that proceeds from the assumption that the ordered categorical scale is an approximation to an underlying, but not directly measurable, continuous variable. Numerical values called ridits are calculated for each category. These values are estimates of the probability that a subject's value on the underlying variable is less than or equal to the midpoint of the corresponding interval.
Risk assessment The qualitative or quantitative estimation of the likelihood of adverse effects that may result from exposure to specified health hazards or from the absence of beneficial influences.
Robust estimation Methods of estimation that work well not only under ideal conditions but also under conditions representing a departure from an assumed distribution or model.
Robust regression A general class of statistical procedures designed to reduce the sensitivity of the parameter estimates to failures in the assumption of the model. For example, least squares estimation is known to be sensitive to outliers, but the impact of such observations can be reduced
Page 165
by basing the estimation process not on a sum-of-squares criterion but on a sum-of-absolute values criterion.
Robust statistics Statistical procedures and tests that work well even when the assumptions on which they are based are moderately violated. An example is Student's t test.
Rule of three A method based on the Poisson distribution which states that if in n trials zero events of interest are observed, a 95 percent confidence (with limits of 0 and 3) bound on the underlying rate is 3/n.
Run-in A period of observation before the formation of treatment groups by random allocation, during which subjects acquire experience with the major components of a study protocol. Those subjects who experience difficulty complying with the protocol are excluded, whereas the group of proven compliers is randomized into the trial.
Runs In a series of observations, the occurrence of an uninterrupted sequence of the same value. For example, in the series 1111222433333 there are four “runs”, with the single value, 4, being regarded as a run of length unity.
Runs test A test frequently used to detect serial correlations. The test consists of counting the number of runs or sequences of positive and negative residuals and comparing the result with the expected value under the null hypothesis of independence.
Sample size determination The process of deciding, before a study begins, how many subjects should be studied. It takes into account the incidence or prevalence of the condition being studied, the estimated or putative relationship among the variables in the study, the power that is desired, and the allowable Type I error.
Sampling distribution
The probability distribution of a statistic. For example, the sampling distribution of the arithmetic mean of samples of size n, taken from a normal distribution with mean ? and standard deviation σ, is a normal distribution also with mean ? but with standard deviation
 .
.
~ enlarge ~
Sampling error The difference between the sample result and the population characteristic being estimated. In practice, the sampling error can rarely be determined because the population characteristic is not usually known. With appropriate sampling procedures, it can be kept small and the investigator can determine its probable limits of magnitude.
Sampling variation The variation shown by different samples of the same size from the same population.
Page 166
Sampling zeros Zero frequencies that occur in the cells of contingency tables because of inadequate sample size.
Saturated model A model that contains all main effects and all possible interactions between factors. Such a model contains the same number of parameters as observations and results in a perfect fit for a data set.
Scatter diagram, scattergram, scatterplot A graphic method of displaying the distribution of two variables in relation to each other.
Selection bias The bias that may be introduced into clinical trials and other types of medical investigations whenever a treatment is chosen by the individual involved or is subject to constraints that go unobserved by the researcher.
Semi-interquartile range Half the difference between the upper and lower quartiles.
Sensitivity An index of the performance of a diagnostic test, calculated as the percentage of individuals with a disease who are correctly classified as having the disease, i.e., the conditional probability of having a positive test result given that the disease is present.
Sensitization Administration of antigen to induce a primary immune response.
Sequential analysis A method of analysis in which a statistical test of significance is conducted repeatedly over time as the data are collected. After each observation, the cumulative data are analyzed and one of the following three decisions is taken:
-
stop the data collection, reject the null hypothesis, and claim statistical significance;
-
stop the data collection, do not reject the null hypothesis, and state that the results are not statistically significant;
-
continue the data collection since the accumulated data are inadequate to draw a conclusion.
Three types of sequential analysis are:
-
open-ended sequential analysis, used in studies that continue indefinitely until sufficient evidence to reject or fail to reject the null hypothesis has accumulated;
-
closed-ended sequential analysis, in which the maximum size of the sample has been set and as data are accumulated and analyzed there is an option to terminate the study before data from the planned sample size have accumulated; and
-
group sequential analysis, in which interim analysis is undertaken at planned numbers of intervals, with each interval having accumulated data for a specified number of samples.
Page 167
Sequential sums of squares A term in regression analysis that refers to the contribution of variables as they are added to the model in a particular sequence. It is the difference in the residual sum of squares before and after adding a variable.
Sickle cell anemia A hereditary, genetically determined hemolytic anemia, one of the hemoglobinopathies, occurring almost exclusively in African Americans, characterized by arthralgia, acute attacks of abdominal pain, ulcerations of the lower extremities, and sickle-shaped erythrocytes in the blood.
Significance level The level of probability at which it is agreed that the null hypothesis will be rejected, conventionally set at 0.05.
Significance test A statistical procedure that, when applied to a set of observations, results in a p value relative to some hypothesis. Examples include Student's t test, z test, and Wilcoxon's signed rank test.
Sign test A test that can be used when combining results of several studies, e.g., in meta-analysis. The test considers the direction of results of individual studies, whether the associations demonstrated are positive or negative.
Similarity coefficient Coefficients that range from zero to unity and that are used to measure the similarity of the variable values of two observations from a set of multivariate data. Most commonly used on binary variables.
Simpson's paradox A form of confounding in which the presence of a confounding variable changes the direction of an association. It may occur in meta-analysis because the sum of the data or results from a number of different studies may be affected by confounding variables that have been excluded by design features from some studies but not others.
Singly censored data Censored observations that occur in clinical trials in which all the patients enter the study at the same time point and in which the study is terminated after a fixed time period.
Skewness The lack of symmetry in a probability distribution.
Spatial data A collection of measurements or observations on one or more variables taken at specified locations and for which the spatial organization of the data is of primary interest.
Specificity An index of the performance of a diagnostic test, calculated as the percentage of individuals without the disease who are classified as not having the disease, i.e., the conditional probability of a negative test result given that the disease is absent.
Square root transformation
A transformation of the form
 ,
,
~ enlarge ~
often used to make random variables suspected to have a Poisson distribution
Page 168
more suitable for techniques such as analysis of variance by making their variances independent of their means.
Standard deviation (SD) The most commonly used measure of the spread of a set of observations. Equal to the square root of the variance.
Standard error (SE)
The standard deviation of the sampling distribution of a statistic. For example, the standard error of the sample mean of n observations is σ /
 ,
,
~ enlarge ~
where σ2 is the variance of the original observations.
Standardization A set of techniques used to remove as much as possible the effects of differences in age or other confounding variables when comparing two or more populations. The common method uses weighted averaging of rates specific for age, sex, or some potential confounding variable(s) according to some specified distribution of these variables.
Standard normal distribution A normal distribution with zero mean and unit variance.
Standard normal variable A random variable having a standard normal distribution.
Standard scores Variable values transformed to zero mean and unit variance.
Statistic A numerical characteristic of a sample, e.g., sample mean and sample variance.
Statistical significance An estimate of the probability of the observed or greater degree of association between independent and dependent variables under the null hypothesis. The level of statistical significance is usually stated by the p value.
Statistical test A procedure that is intended to decide whether a hypothesis about the distribution of one or more populations or variables should be rejected or accepted.
Stem-and-leaf plot A method of displaying data resembling a histogram in which each observation is split into two parts, with multiples of 10 along the “stem” and the integers forming the “leaves.” The stems are arranged in a column, and the leaves are attached to the relevant stem.
Stochastic process A process that incorporates some element of randomness, in a series of random variables, xt, where t assumes values in a certain range T. In most cases xt is an observation at time t and T is a time range.
Stopping rules Procedures that allow interim or sequential analyses in clinical trials at predefined times and that specify the conditions or criteria under which the trial shall be terminated while preserving the Type I error at some prespecified level.
Page 169
Stratified logrank test A method for comparing the survival experiences of two groups of subjects given different treatments when the groups are stratified by age or some other prognostic variable.
Stratified randomization A randomization procedure in clinical trials in which strata are identified and subjects are randomly allocated to treatments within each stratum without sacrificing the advantages of random allocation.
Structural zeros Zero frequencies occurring in the cells of contingency tables that arise because it is theoretically impossible for an observation to fall in the cell.
Student's t distribution The probability distribution of the ratio of a standard normal variable to the square root of a variable with a chi-square distribution. The shape of the distribution varies with n, and as n gets larger the shape of the t distribution approaches that of the standard normal distribution.
Student's t tests Significance tests for assessing hypotheses about population means. One version, known as single-sample t test, is used in situations in which it is required to test whether the mean for a population takes a particular value. Another version, known as independent-samples t test, is applied when independent samples are available from each population and is designed to test the equality of the means for the two populations.
Subgroup analysis The analysis of particular subgroups of patients in a clinical trial to assess possible treatment-subgroup interactions. Analysis of many subgroups for treatment effects can increase overall Type I error rates.
Subjective end points End points in clinical trials that can be measured only by subjective clinical rating scales.
Surrogate end point In clinical trials it refers to an outcome measure that an investigator considers to be highly correlated with an endpoint of interest but that can be measured at lower expense or at an earlier time. In some cases, ethical issues may suggest the use of a surrogate endpoint.
Survival function The probability that the survival time of an individual is longer than some particular value. A plot of this probability against time is called a survival curve and is a useful component in the analysis of such data.
Symmetrical distribution A probability distribution or frequency distribution that is symmetrical about some central value.
Systematic allocation Procedures for allocating treatments to patients in a
Page 170
clinical trial that attempts to emulate random allocation by using some systematic scheme, such as giving treatment A to those people with birth dates on even dates and treatment B to those with birth dates on odd days.
Systematic error A term often used in a clinical laboratory to describe the difference in results caused by a bias of an assay.
Target population The collection of individuals, items, measurements, etc., about which it is required to make inferences. At times it is used to indicate the population from which a sample is drawn, and at times it is used to denote any reference population about which inferences are required.
t distribution The distribution of a quotient of independent random variables, the numerator of which is a standardized normal variate and the denominator of which is the positive square root of the quotient of a chi-square-distributed variate and its number of degrees of freedom.
Test statistic A statistic used to assess a particular hypothesis in relation to some population. The essential requirement of such a statistic is a known distribution when the null hypothesis is true.
Tied observations A term usually applied to ordinal variables to indicate observations that take the same value on a variable.
Time-dependent covariates Covariates whose values change over time. Examples are age and weight.
Time-independent covariates Covariates whose values remain constant over time. An example is a pretreatment measurement of some characteristic.
Tmax A measure traditionally used to compare treatments in bioequivalence trials. It is the time at which a patient's highest recorded values occur.
Total sum of squares The sum of the squared deviations of all the observations from their mean.
Trapezium rule A simple rule for approximating the integral of a function, f(x), between two limits.
Treatment allocation ratio The ratio of the number of subjects allocated to the two treatments in a clinical trail. Equal allocation is most common in practice, but it may be advisable to allocate patients randomly in other ratios when a new treatment is compared with an old one, or when one treatment is much more difficult or expensive to administer.
Treatment cross contamination An instance in which a patient assigned to receive a particular treatment in a clinical trial is exposed to one of the other treatments during the course of the trial.
Page 171
Treatment received analysis Analyzing the results of a clinical trial by the treatment received by a patient rather than by the treatment allocated at randomization as in intent-to-treat analysis.
Treatment trial Synonym for clinical trial.
Trend Movement in one direction of the values of a variable over a period of time.
Triple blind A study in which the subjects, observers, and analysts are blinded as to which subjects received what interventions.
Truncated data Data for which sample values larger (truncated on the right) or smaller (truncated on the left) than a fixed value are either not recorded or not observed.
t test Test that uses a statistic that, under the null hypothesis, has the t distribution to test whether two means differ significantly or to test linear regression or correlation coefficients.
Tumorigenic dose 50 (TD50) The daily dose of a compound required to halve the probability of remaining tumorless at the end of a standardized lifetime.
Two-armed bandit allocation An allocation procedure for forming treatment groups in a clinical trial in which the probability of assigning a patient to a particular treatment is a function of the observed differences in outcomes for patients already enrolled in the trial.
Two-by-two contingency table A contingency table with two rows and two columns formed from cross classification of two binary variables.
Two-phase sampling A sampling scheme involving two distinct phases: first, information about particular variables of interest is collected for all members of the sample, and second, information about other variables is collected for a subsample of the individuals in the original sample.
Two-stage sampling A procedure most often used in the assessment of quality assurance before, during, and after the manufacture of, e.g., a drug product. This would involve randomly sampling a number of packages of some drug and then sampling a number of tablets from each of these packages.
Two-stage stopping rule A procedure sometimes used in clinical trials in which results are first examined after only a fraction of the planned number of subjects in each group have completed the trial. The relevant test statistic is calculated and the trial is stopped if the difference between the treatments is significant at stage 1 level. Otherwise, additional subjects in each treatment group are recruited, the test statistic is
Page 172
calculated again, and the groups are compared at stage 2 level α2, where α and α2 are chosen to give an overall significance level of α.
Two-tailed test A statistical significance test based on the assumption that the data are distributed in both directions from some central value(s).
Type I error The error that results when the null hypothesis is falsely rejected.
Type II error The error that results when the null hypothesis is falsely accepted.
Unanimity rule A requirement that all of a number of diagnostic tests yield positive results before declaring that a patient has a particular complaint.
Unbiased estimator An estimator that for all sample sizes has an expected value equal to the parameter being estimated. If an estimator tends to be unbiased as the sample size increases, it is referred to as “asymptotically unbiased.”
Uniform distribution The probability distribution of a random variable having constant probability over an interval. The most commonly encountered uniform distribution is one in which the parameters α and β take the values 0 and 1, respectively.
Unimodal distribution A probability distribution or frequency distribution having only a single mode.
Unit normal variable Synonym for standard normal variable.
Univariate data Data involving a single measurement for each subject or patient.
Unweighted means analysis An approach to the analysis of two-way and higher-order factorial designs when there are an unequal number of observations in each cell. The analysis is based on cell means, using the harmonic mean of all cell frequencies as the sample size for all cells.
U-shaped distribution A probability distribution or frequency distribution shaped more or less like a letter U, although not necessarily symmetrical. The distribution has its greatest frequencies at the two extremes of the range of the variable.
Utility In economics, utility means preference for or desirability of a particular outcome.
Utility analysis A method in clinical decision analysis in which the outcome refers to being or becoming healthy rather than sick or disabled.
Vague prior A term used for the prior distribution in Bayesian inference in the situation in which there is complete ignorance about the value of a parameter.
Page 173
Validity The extent to which a measuring instrument is measuring what was intended.
Validity checks A part of data editing in which one checks that only allowable values or codes are given for the answers to questions asked of subjects.
Validity, measurement An expression of the degree to which a measurement measures what it intends to measure.
Validity, study The degree to which the inference drawn from a study, especially generalizations extending beyond the study sample, are warranted after taking into account the study methods, the representativeness of the study sample, and the nature of the population from which it is drawn.
Variable Any attribute, phenomenon, or event that can have different values from time to time.
Variable, antecedent A variable that causally precedes the association of the outcome under study.
Variable, confounding See confounding.
Variable, control Independent variable other than the “hypothetical causal variable” that has a potential effect on the dependent variable and that is subject to control by analysis.
Variable, uncontrolled A (potentially) confounding variable that has not been brought under control by design or analysis.
Variance A measure of the variation shown by a set of observations, defined by the sum of squares of the deviation from the mean divided by the number of degrees of freedom in the set of observations. In a population, the second moment about the mean.
Variance components Variances of random-effect terms in linear models. For example, in a simple mixed model for longitudinal data, both subject effects and error terms are random, and estimation of their variances is of some importance. In the case of a balanced design, estimation of these variances is usually achieved directly from the appropriate analysis of variance table by equating mean squares to their expected values. When the data are unbalanced, a variety of estimation methods might be used, although maximum likelihood estimation and restricted maximum likelihood estimation are most often used.
Variance-covariance matrix A symmetric matrix in which the off-diagonal elements are the covariances (sample or population) of pairs of variables and the elements on the main diagonal are the variances (sample or population) of the variables.
Variance inflation factor An indicator of the effect that the other explana-
Page 174
tory variables have on the variance of a regression coefficient of a particular variable, given by the reciprocal of the square of the multiple correlation coefficient of the variable with the remaining variables.
Variance ratio distribution Synonym for F distribution.
Variance ratio test Synonym for F test.
Variance-stabilizing transformations Transformation designed so that the variance of the transformed variable is independent of parameters.
Vector A matrix having only one row or column.
Venn diagram A graphical representation of the extent to which two or more quantities or concepts are mutually inclusive and mutually exclusive.
Virtually safe dose The exposure level to some toxic agent corresponding to an acceptably small risk of suffering an ill effect. From a regulatory perspective, this typically means an increased risk of no more than 10 6 or 10 4 above the background.
Volunteer bias A possible source of bias in clinical trials involving volunteers, but not involving random allocation, because of the known propensity of volunteers to respond better to treatment than other patients.
Wald's test A test for the hypothesis that a vector of parameters, θ' = [θ1, θ2, . . . , θm], is the null vector. The test statistic is, W = θ̂'V−1θ̂ where θ̂' contains the estimated parameter values and V is the asymptotic variance-covariance matrix of θ̂. Under the hypothesis, W has an asymptotic chi-square distribution with degrees of freedom equal to the number of parameters.
Weibull model Dose-response model of the form P(d) = 1 − exp(− bdm), where P(d) is the probability of response due to a continuous dose rate d; and b and m are constants. The model is useful for extrapolating from high- to low-dose exposures, e.g., from animals to human.
Weighted average A value determined by assigning weights to individual measurements. Each value is assigned a nonnegative coefficient (weight); the sum of the products of each value by its weight divided by the sum of the weights is the weighted average.
Weighted kappa A version of the kappa coefficient that allows disagreements between raters to be differentially weighted to allow differences in how serious such disagreements are judged to be.
Weighted least squares A method of estimation in which estimates arise from minimizing a weighted sum of squares of the differences between
Page 175
the response variable and its predicted value in terms of the model of interest. Often used when the variance of the response variable is thought to change over the range of values of the explanatory variable(s), in which case the weights are generally taken as the reciprocals of the variance.
Weight variation tests Tests designed to ensure that manufacturers control the variation in the weights of the tablet forms of the drugs that they produce.
Wilcoxon's rank sum test Another name for the Mann-Whitney test.
Wilcoxon's signed rank test A distribution-free method for testing the difference between two populations by using matched samples. The test is based on the absolute differences of the pairs of observations in the two samples ranked according to size, with each rank being given the sign of the original difference.
Wilk's multivariate outlier test A test for detecting outliers in multivariate data that assumes that the data arise from a multivariate normal distribution.
William's test A test used to answer questions about the toxicities of substances and at what dose level any toxicity occurs. The test assumes that the mean response of the variate is a monotonic function of dose.
Yates' correction An adjustment proposed by Yates in the chi-square calculation for a two-by-two contingency table that subtracts 0.5 from the positive discrepancies (observed – expected) and adding 0.5 to the negative discrepancies before these values are squared in the calculation of the usual chi-square statistic. This brings the distribution based on the discontinuous frequencies closer to the continuous chi-square distribution from which the published tables for testing chi-square values are derived.
Zelen's single-consent design A modified double-blind randomized controlled trial design for the formation of treatment groups in a clinical trial. The essential feature is randomization before informed consent procedures, which is claimed to be needed only for the group allocated to receive the experimental regimen.
z test A test for assessing hypotheses about population means when their variances are known. If the null hypothesis is true, z has a standard normal distribution.
Page 176
SOURCES
Dorland's Illustrated Medical Dictionary, 28th edition. 1994. Philadelphia: W. B. Saunders.
Eddy, D. M., V. Hasselblad, and R. Shacther. 1992. Meta-Analysis by the Confidence Profile Method. San Diego: Academic Press.
Everitt, B. S. 1995. The Cambridge Dictionary of Statistics in the Medical Sciences. Cambridge, United Kingdom: Cambridge University Press.
Hirsch, R. P., and R. Riegelman. 1996. Statistical Operations. Analysis of Health Research Data. Cambridge, MA: Blackwell Science.
Last, J. M., ed. 1995. A Dictionary of Epidemiology. Oxford: Oxford University Press.


