
Page 12
2
Case Studies
Four federal formula grant programs were selected to provide concrete illustrations of statistical issues that arise in the development and application of funding formulas. The Medicaid program, although its basic formula differs substantially from those of most other programs, was chosen for the first case study because it currently accounts for more than half of all federal funds disbursed annually via formula grants. The second case study relates to grants under Title I of the Elementary and Secondary Education Act. The third case study relates to block grants administered by the Substance Abuse and Mental Health Services Administration (SAMHSA), and the fourth covers allocation of funds in the Special Supplemental Nutrition Program for Woman, Infants, and Children (WIC). The allocation formulas used in all of these programs have been modified over time, partly on the basis of evaluation studies and research, in attempts to improve the equity of the allocations and their effectiveness in meeting program goals.
MEDICAID
In the opening session of the workshop, Jerry Fastrup, of the U.S. General Accounting Office, described the Medicaid program and the formula used to provide federal funds to match expenditures by the states under the program. Medicaid is a jointly funded federal-state program providing health care to low-income persons under eligibility standards set by the states, subject to federal regulations. State expenditures are partially
Page 13
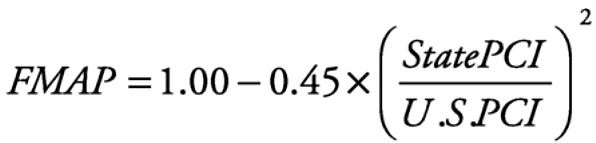
reimbursed by the federal government. The proportion reimbursed to each state is determined according to a formula for the federal medical assistance percentage (FMAP):
~ enlarge ~
where PCI = per capita income. FMAP is subject to a minimum of 50 percent and a maximum of 83 percent. The values of per capita income are based on a 3-year average of personal income estimates compiled by the Bureau of Economic Analysis. The lower a state's per capita personal income in relation to the national value, the higher is the proportion of its Medicaid costs that will be reimbursed by the federal government. Squaring the ratio magnifies this effect. The highest value of the FMAP in fiscal year 2000 was Mississippi's 76.8 percent. Ten states received the minimum 50 percent reimbursement.
Fastrup explained that the per capita income ratio in the formula serves a dual purpose. It is indirectly related to the relative number of low-income persons in the state, which is an indicator of the target population that the program is intended to serve (need), and also to the state tax base, that is, its ability to raise revenues to meet program needs (capacity). He said that there may be better indicators that could be used in the formula. An estimate of the number of persons in poverty might be a more direct indicator of program need. For capacity, estimates by state of total taxable resources that are prepared by the U.S. Department of the Treasury and used in the SAMHSA block grant formula would be a more direct measure. Further improvements could be achieved by introducing measures related to cost differentials by state. Such measures would take account of differentials in the costs of providing medical care and also in the proportion of the target population who are elderly and therefore require more resources per person.
Fastrup presented results of a simulation using a revised formula that included such elements. Based on this formula, the states of California and New York, which both have per capita incomes above the national average, were among those with the lowest capacity in relation to need. He then presented an analysis of the equalizing effects on relative capacity, by state, of federal aid based on the current FMAP formula. This analysis showed that more than half of the states that were above the national average in terms of their capacity to fund Medicaid without federal aid were farther above it with federal aid (disequalization) and that several that had been
Page 14
below average were taken well above the average (overequalization). A handful of states, including New York, California, and the District of Columbia, were farther below the national average when federal aid under the Medicaid program was taken into account. He concluded his presentation by pointing out that a large majority of states would lose funding if a more appropriate formula were used; hence, the likelihood of such a formula being adopted is small.
TITLE I OF THE ELEMENTARY AND SECONDARY EDUCATION ACT
Sandy Brown, of the U.S. Department of Education, described the history and scope of the program, the processes used in allocating funds, and the changes that have been made during the past decade as a result of legislation designed to bring about use of more timely data in the allocation process.
The Title I grants to school districts were first authorized in 1965 as a part of the Johnson administration's Great Society program. Their objective is to provide financial assistance to school districts and schools with high numbers or percentages of poor children to help meet the educational needs of children who are failing, or most at risk of failing, to meet challenging academic standards. The Title I program is the largest elementary and secondary education program of the federal government, with a current budget of almost $7.9 billion. Based on 1996-1997 data, Title I accounted for about 2.5 percent of total U.S. revenues from all sources that were devoted to elementary and secondary education. About 92 percent of all school districts receive Title I funds, and about 27 percent of all children ages 5 to 17 are affected by Title I services. Currently, there are two kinds of grants being made: basic grants, which account for about 84 percent of the total, and concentration grants, which are designed to supplement funding for school districts with heavy concentrations of poor children.
For each fiscal year, the grants to individual school districts 1 are deter-
1Prior to the 1999-2000 school year, allocations to counties were determined by the Department of Education and the allocations to school districts were determined by state education agencies. Starting with the 1999-2000 school year, the allocations to school districts are determined directly by the Department of Education, except that states have the option to group school districts with a population of less than 20,000 and determine allocations to these districts, using a procedure approved by the Department of Education.
Page 15
mined by allocation formulas that are applied to the total amounts appropriated by Congress for basic and concentration grants. The allocation formulas for both kinds of grants are based primarily on estimates of the number of children ages 5 to 17 living in families below the official poverty line. They also use state per pupil expenditures as a proxy measure of the cost of educational services. Both kinds of grants are subject to eligibility thresholds. To qualify for a basic grant, a school district must have at least 10 “formula” children 2 and the number of formula children must exceed 2 percent of the school age population. To qualify for a concentration grant, either a district must have more than 6,500 formula children, or the number must exceed 15 percent of the total school-age population. There are also state minimums whose effect is to give a few small states somewhat larger amounts than they would otherwise receive. Title I also includes a hold-harmless provision for basic grants, under which each district is guaranteed to receive a specified minimum percentage of what it received the year before. These guaranteed percentages vary according to a step function based on the percentage of eligible children in the school age population.
The application of the formulas for the two kinds of grants is an iterative process. First, estimates of the number of eligible children are multiplied by 40 percent of state per pupil expenditure to produce an “entitlement” figure for each school district. These figures are then prorated to add to the total appropriation for that type of grant. Then the state minimums and, for basic grants, the hold-harmless provisions are applied, with further prorating of amounts remaining after these provisions are satisfied. Special features that affect the final allocations include:
-
A provision of the statute that allows a state to reallocate the total amount that the Department of Education has allocated to its school districts with fewer than 20,000 people. A state that exercises this option can use alternate data sources, such as school lunch program data, for this purpose.
-
Changes in school district boundaries. The universe of school districts on which the Department of Education bases its allocations lags the currently existing universe by about five years, so the states in which there
2“Formula” (eligible) children include children ages 5 to 17 in families with income below the poverty level, children in foster homes, children in families above the poverty level that receive benefits under the Temporary Assistance to Needy Families program, and children in local institutions for neglected and delinquent children.
Page 16
have been changes must adjust the department's allocation by districts to account for boundary changes and the creation of new school districts.
The creation of charter schools. In some states, individual charter schools are treated like school districts but draw students from one or more existing school districts.
Sandy Brown's presentation covered the procedures for the allocation of funds to school districts; he did not cover the procedures used by school districts to allocate the funds they receive to individual schools.
He explained the steps that were taken during the 1990s to bring about the use of more up-to-date estimates of the number of school children in poverty. The reauthorization of the Elementary and Secondary Education Act in 1994 required that the Department of Education use, for its 1997-1998 school year allocations, the U.S. Census Bureau's updated estimates of poor school-age children by county, unless the secretaries of education and commerce were to determine that these estimates were “inappropriate or unreliable” based on a National Research Council review that was authorized by the legislation. The Panel on Estimates of Poverty for Small Geographic Areas reviewed the U.S. Census Bureau's county estimates for 1993 and recommended that they be used in the allocation process. The estimates were used in the allocation to counties, 3 but at that stage it was left to the states to determine the suballocation of funds to school districts. Subsequent reports by the panel supported the use of revised 1993 county estimates for the 1998-1999 school year allocations (National Research Council, 1998) and the use of the U.S. Census Bureau's 1995 estimates by school district for the allocation of 1999-2000 Title I funds directly to school districts (National Research Council, 1999a).
Brown then discussed how changes during this period affected the amounts received by states and school districts. Factors that affect the allocations are:
-
Changes in the estimated number of eligible children in each state, county, and school district. The estimated national poverty rate declined from 21.2 percent in 1993 to 19.5 percent in 1995, but there were in-
3For the fiscal year 1997 allocations, the panel recommended use of estimates obtained by averaging the updated county estimates with estimates based on the 1990 census (National Research Council, 1997). For subsequent fiscal years, the allocations were based solely on the updated estimates.
Page 17
creases in a few states, mostly in the south and the northern mountain states.
Changes in a state's per pupil expenditure.
Changes in the amount appropriated for Title I grants. For fiscal year 1999, which controls the allocations for school year 1999-2000, Congress increased the amounts for both basic and concentration grants by about 5 percent.
State minimums for basic and concentration grants.
Hold-harmless provisions. As noted above, the statute includes a graduated hold-harmless provision for basic grants, but none for concentration grants. However, for school years 1999-2000 and 2000-2001, Congress established a 100 percent hold-harmless provision for both kinds of grants.
Brown presented the results of an analysis that compared the actual Title I allocations for school year 2000-2001, based on the 100 percent hold-harmless provisions, with what they would have been if only the statutory hold-harmless provisions for basic grants had been applied. Looking at the totals for both kinds of grants, Utah's allocation would have been 21.4 percent less without the 100 percent hold-harmless provisions and the District of Columbia's would have been 8.8 percent more. The 17 states that gained under the 100 percent hold-harmless provisions received in total about $200 million more than they would have under the statutory provisions. Total grants to the remaining 34 states were reduced by the same amount. For the 2000-2001 concentration grants, there was a slight decrease in the total appropriation, with the result that there was not enough money to fully fund the 100 percent hold-harmless provision. Therefore, the Department of Education reduced the previous year's allocation for each district by the same proportion, and new data inputs for that school year had no impact on the allocation.
The second presenter in the session was Graham Kalton, of Westat, who served as chair of the Panel on Estimates of Poverty for Small Geographic Areas. He explained the Panel's mission and described the steps it had taken to evaluate the suitability of the U.S. Census Bureau's estimates for use in the Department of Education's Title I allocations at the county and school district levels. He noted that small area estimates were required for three variables. The key variable is the number of poor school-age children ages 5 to 17. Also needed are the total number of children in that age group and the total population of each area. The total number of
Page 18
children is needed to serve as denominator for an estimate of the proportion of poor children, which enters into the statutory threshold and hold-harmless provisions of the law. Total population is needed in connection with the provision that allows states to use alternate allocations for school districts with less than 20,000 population. Estimates for the first variable are provided by the U.S. Census Bureau's Small Area Income and Poverty Estimates (SAIPE) Program, which was launched in 1992. Estimates of total population and population by age for states and counties come from the U.S. Census Bureau's long-established population estimates program.
The principal sources of data for the SAIPE program estimates are the CPS, the decennial census of population, and administrative record data based on individual income tax returns and participation in the Food Stamp Program. As noted earlier, there are trade-offs among these data sources with respect to timeliness, sampling variability, nonsampling error, and conceptual fit. Therefore, a model-based estimation procedure was adopted to seek the best use of information from each source.
After examining several alternative models for use in county estimates of poor children, the U.S. Census Bureau adopted a log-linear regression model, with the logarithm of the CPS estimate (based on a three-year average to increase sample size) as the dependent variable and data from the decennial census, IRS, and the Food Stamp Program as independent variables. The resulting model was used to predict the number of poor schoolage children for each county for 1993 and 1995. These predicted values were averaged with direct CPS estimates for those counties that had actual data from the CPS sample. Within each state, the resulting county estimates were benchmarked to state estimates based on a separate model.
Three methods were used to evaluate the SAIPE Program county estimates. First, standard regression diagnostics for the model selected by the U.S. Census Bureau and several alternative models were examined to determine to what degree the results were consistent with modeling assumptions. Second, the U.S. Census Bureau model and some of the alternative models were used to prepare estimates for 1990, using inputs based on the 1980 census and appropriate data from the CPS, the IRS, and the Food Stamp Program. These estimates were compared with the direct estimates from the 1990 census. Third, for several groups of counties for which the 1993 estimates seemed unusually high or low in relation to previous levels and trends, local officials were contacted to obtain their assessments of the reasonableness of the trends in poverty implied by the SAIPE estimates for 1993.
Page 19
Kalton described some of the results from these evaluations, which were undertaken by joint efforts of the U.S. Census Bureau's SAIPE Program staff and panel members and staff. One analysis by the U.S. Census Bureau showed overestimation of the number of poor children in counties that had a high proportion of the population living in group quarters. This bias was substantially reduced in the revised 1993 estimates by changing one of the independent variables in the model from population under 21 to population under 18. A general conclusion of the panel was that many of the alternative models examined were fairly comparable and that the one selected by the U.S. Census Bureau was a good choice. Nevertheless, the estimates are subject to appreciable error. The comparison of model-based county estimates for 1989 with the decennial census numbers showed an average absolute difference of about 15 percent for numbers of poor children and average absolute proportional differences of 15 percent for numbers of poor children and 16 percent for proportions of poor children. Biases in the estimates for groups of counties with common characteristics are also a concern. In the aggregate, model-based county estimates for 1989, 1993, and 1995, when compared with direct estimates from the CPS, consistently underestimated the number of poor school-age children for the 199 counties with a population of 250,000 or more. Errors in the estimates can also affect the application of the threshold and hold-harmless provisions. An example of this would be a county for which the 90 percent confidence interval for the estimated proportion of poor school age children included 15 percent, the threshold level for receipt of concentration grant funds.
Kalton went on to discuss the estimates for school districts. Several new problems arise at this level: many of the districts are very small, their boundaries change frequently over time, some of them cross county boundaries, and some serve subsets of grades 1 through 12. A key difficulty is that there are no nationally consistent administrative data available to use for the kind of modeling that is done at the county level. The estimation procedure adopted allocated the county model-based estimates for the estimation year (e.g., 1995) in proportion to each district's share of poor schoolage children in the 1990 census. For districts whose boundaries changed between 1990 and the estimation year, census data by block were used to obtain census estimates for the districts as defined in the estimation year.
For selected counties, the school district estimation procedure was evaluated in the same way as the procedure for obtaining county estimates
Page 20
(i.e., the procedure was used to estimate the number of poor school-age children in 1989 based on data from the 1980 census and these estimates were compared with the 1990 census results). 4 The average absolute difference in the estimates for poor school-age children was 22 percent, roughly double that which had been observed for the county estimates. The differences in the estimates of the total number of school-age children by school district were smaller, with an average absolute difference of 12 percent, because the allocations were based on the 100 percent data from the previous census and the estimates were compared with 100 percent data from the 1990 census.
Initially the panel was uncertain about whether to recommend use of the model-based county estimates and subsequently had even more difficulty in deciding whether to extend its recommendation to the school district numbers. It recognized the high degree of error in the estimates, but, after examining all reasonable alternatives, concluded that these estimates were at least as good as and probably better than the alternatives.
In concluding, Kalton noted that even though the estimates now being used in the allocation process are more timely than they had been, they still lag the current program year by three or four years. Shifts in the distribution of poverty across the nation in that period of time can be substantial. The levels of variable error and possible persistent error (bias) in the estimates are a subject for concern. In particular, it is important to ask how these errors interact with thresholds and hold-harmless provisions. Finally, he noted that new data will be available soon from the 2000 census and, if it is funded, from the American Community Survey (ACS). These data sources offer possibilities for improving the estimates, but the transition from the current series will raise some complex technical issues.
Bruce Spencer of Northwestern University discussed the presentations by Brown and Kalton. He began by challenging the presupposition that accurate estimates of the number of school-age children in poverty are needed for Title I allocations. A general goal of the program, cited in the legislation, is “distributing resources, in amounts sufficient to make a difference, to areas and schools where needs are greatest” (Improving America's Schools Act of 1994, P.L. 103-382). Another possible goal might be to give
4This could be done only for school districts that did not change boundaries during the 1980s; also excluded from the evaluation were districts that were not unified, that is, that did not include both elementary and secondary grades.
Page 21
the federal government some authority over the educational system, which is controlled by state and local governments. It is not obvious why very accurate poverty data are essential to achieve either of these goals. He asked whether congressional intent would be thwarted by the levels of modeling errors in the poverty estimates that were identified by the CNSTAT panel.
Two possible criteria for evaluating improvements are cost effectiveness and fairness (both actual and perceived). If efficiency is the criterion, one needs to ask whether improvements in meeting program goals through the use of better estimates justify the additional costs of producing those estimates. To answer this question would require evaluation of Title I program outcomes for alternative allocation procedures; however, evaluation of Title I under any conditions is notoriously difficult. The concept of perceived fairness suggests that whether or not the allocation formula is optimal in any sense, the estimates used in the process should be as accurate as practicable. However, at some point, resources devoted to making them more accurate may be wasted.
Spencer reviewed some of the sources of error in the SAIPE Program estimates. He echoed Martin David's concerns about definitional problems, census undercoverage, nonresponse, and errors in reporting income, sampling error, and modeling error. He suggested that county estimates for 1986 be compared with the 1990 census data to reflect lack of timeliness. For the school district estimates, he asked whether alternative sources of data, such as participation in the school lunch program, might be used for states for which these data are uniformly available for all districts. Another possibility would be to make direct estimates of the current population ages 5 to 17, using school enrollment data by school district or tax return data geocoded to school districts.
Spencer pointed out that the kinds of data used in formula allocations have many uses and that improvement of these data could yield diverse benefits. It would be a mistake to look only at formula uses of statistics in order to justify their importance or their cost. Other uses may be more important, although harder to identify. For formula-based allocations, the underallocations are offset by the overallocations, so that the loss in overall social welfare resulting from these errors may be a small fraction of the total error.
Another question that needs to be asked is how should the amount of resources spent to obtain the data be influenced by the presence of definitional error? If we have a measure that is invalid for the intended purpose, is it still important to reduce sampling and modeling error? The answer to
Page 22
this question, Spencer said, depends on what loss function is appropriate. If the loss increases moderately with error, less money should be spent on data when the measure is invalid. If the loss from estimation error follows a quadratic function, one should spend the same amount regardless of the size of the bias. Only if it increases even more rapidly with the size of the error, should one spend more on improving the data when the bias is larger.
Henry Aaron of the Brookings Institution began the general discussion that followed by pointing out that the initial allocation is politically driven and that the formula is an instrument for achieving a political outcome. Once a formula is in place, it is very hard to change it. One should focus on how the allocation formula behaves over time. What counts is not whether the formula is accurate, but whether it changes in the same way as the true, target measure.
Several workshop participants called attention to the state per pupil expenditure component of the Title I allocation formula, which had been given only passing attention earlier in the session. This component is defined as current expenditures on public elementary and secondary education (minus certain federal revenue items), divided by attendance as defined by state law. Its value is allowed to vary only within a limited range of the national average. Unlike most states, California until recently defined attendance to include excused absences, which brought down their per pupil expenditure. They have now changed this, which will increase their share of the overall appropriation for the program. One participant, who noted that the inclusion of per pupil expenditure in the formula is commonly justified as a proxy for the cost of educational services, felt that it was not a good measure of relative costs and in fact measures differences among states in the amount and quality of education they want.
There was further discussion of hold-harmless provisions in allocation formulas. There is always a tension between program stability and targeting where the money is supposed to go. The concern of Congress may be less with accuracy in targeting funds and more with the avoidance of sharp differences, sudden changes, and high variability.
Paul Siegel, of the U.S. Census Bureau, had two suggestions about terminology. He objected to use of the term “poverty counts” to describe the SAIPE Program estimates, and he suggested that the term “uncertainty” be used in place of “errors” in the estimates. He also noted that the Congress has provided for updating the SAIPE Program estimates only at two-year intervals, which suggests they may have given some consideration to the costs of producing the data.
Page 23
THE SAMHSA BLOCK GRANTS
The third case study covered block grants to states for substance abuse and mental health services, administered by the Substance Abuse and Mental Health Services Administration (SAMHSA). Albert Woodward of SAMHSA began the session by describing the current allocation formula and summarized changes in the allocation procedures since the inception of the program in the early 1980s, when several related block grants were consolidated in the budget reconciliation bill for fiscal year 1982 (P.L. 97-35).
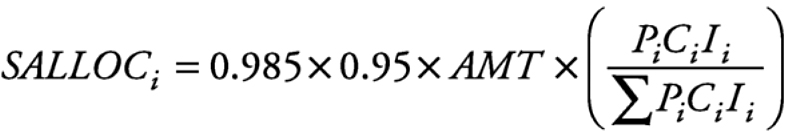
Currently, the total annual appropriation for these block grants is about $2 billion, of which about four-fifths goes to substance abuse and the remainder to mental health services. Of the total amount appropriated by Congress each year for the two types of grants, 5 percent goes to SAMHSA for data collection and other administrative activities and 1.5 percent goes to the U.S. territories. The remainder is allocated to the states. The same general allocation formula is used for both the mental health and substance abuse block grants:
~ enlarge ~
SALLOCi = the allocation to the ith state.
AMT = the appropriation for substance abuse or mental health.
Pi = a proxy measure of the state population at risk.
Ci = cost of services index for the state.
Fi = fiscal capacity index for the state.
The Pi component of the formula, which is a proxy measure of need based on population, is defined differently for the two kinds of grants. For substance abuse, two population groups, ages 18 to 24 and ages 25 to 64, are used, with the urban population ages 18 to 24 receiving twice the weight of the other groups. For mental health services, a weighted average of four age groups of the population age 18 and over is used, using weights specified in legislation.
The cost of services component, Ci, which is the same for both kinds of grants, represents an effort to account for differences between states in the costs of providing services. It is a weighted average of three subindexes covering labor costs, rent, and supplies. In the early 1990s, after SAMHSA was created, the agency used data from the Bureau of Labor Statistics on
Page 24
manufacturing wages by state for the required three-year updates of this component. However, this procedure was challenged by California because the legislation that established the formula had incorporated a research paper that used 1979 census data on wages in nonmanufacturing industries and noted specifically that the Bureau of Labor Statistics data on wages in manufacturing were not appropriate. After consulting with an expert panel, SAMHSA decided to use the most recent decennial census data on wages in nonmanufacturing industries, updated by using wage information for hospitals published annually by the Health Care Financing Administration, an approach consistent with legislative intent.
The fiscal capacity component, Fi, is also the same for both kinds of grants. It is based on the relationship between the Treasury Department's estimates of total taxable resources and the other two components. The larger a state's cost-adjusted taxable resources in relation to its population at risk, the smaller the value of this component in relation to its value for other states.
Woodward reviewed some aspects of the history of these grant programs. In 1981, when the categorical block grants were consolidated, there was a cut of about 20 percent in overall funding and states were given flexibility in the use of the funds received. Allocations were based on total population (as a proxy for need), with no factors representing need or capacity. Legislation passed in 1984 revised the population component of the formula in an attempt to approximate populations at risk and also introduced a factor based on per capita income. As these changes were phased in, Congress introduced a hold-harmless provision. In 1988, there were further changes in the population component of the formula, total taxable resources were substituted for per capita income, and the hold-harmless provision was phased out.
With the creation of SAMHSA in the ADAMHA [Alcohol, Drug Abuse, and Mental Health Administration] Reorganization Act of 1992 (P.L. 102-321), the substance abuse and mental health services block grants were separated and the cost of services component was introduced. As noted above, the change in the labor component from manufacturing to nonmanufacturing in order to conform with the statutory requirement was introduced for the fiscal year 1998 allocations. For fiscal year 1999, Congress introduced a small state minimum, so that no state would get less than 0.375 percent of the total, as well as a hold-harmless provision. For mental health services, every state received at least as much as in 1998 and,
Page 25
for substance abuse, each state got the same amount as for 1998 plus 5 percent.
Woodward drew three conclusions from experience with this formula grant program. First, he said, the formulas represent an attempt to achieve equity among the states. However, congressional changes to the formula, especially through the use of hold-harmless provisions, have interfered with the achievement of this goal. Second, little is known about what impact the federal dollars have had on state spending behavior. A recent U.S. General Accounting Office (1996) report suggests that the federal dollars are supplanting rather than supplementing state funding. It is not clear whether this is what Congress intended. Finally, the current population component of the formula is a very rough proxy for need. The Office of Applied Studies in SAMHSA sponsors a national household survey that collects current data on substance abuse. The National Household Survey of Drug Abuse (NHSDA) has recently been expanded to approximately 70,000 respondents so that it will be possible to produce direct estimates of the prevalence of substance abuse and mental health conditions for eight states and synthetic estimates for the remaining states. These new data may produce better estimates of need at the state level.
The 1992 legislation that created SAMHSA, split the grants between substance abuse and mental health, and introduced several changes into the allocation formula also mandated a study to review the formula and its components and determine whether improvements could be made. The methodology and results of the study (Burnam et al., 1997) were described by John Adams of RAND. His presentation focused primarily on the formula for the substance abuse block grant allocation.
The first step in the study was to examine how the different components of the formula—need, cost of services, and fiscal capacity—interacted. Then, alternative measures of need and costs were developed (the study team concluded that the fiscal capacity measure, total taxable resources, was appropriate and could not readily be improved) and allocations based on these alternative measures were compared with those based on the existing formula. It was not necessarily intended that the alternative measures be readily implementable. The goal was to develop a clearer picture of the main features of the measures that had been written into the legislation. Primary attention was given to the need component of the formula.
The RAND researchers reviewed the legislative history and interviewed congressional staffs in an attempt to clarify program goals. The grants are
Page 26
intended to support both treatment and prevention services related to substance abuse, which in the United States is dominated by alcohol abuse rather than hard-core drug abuse. The nature of the formula, as had been explained earlier by Albert Woodward, suggests a view that the need was greatest among young adults in urban areas.
In an effort to develop a more precise estimator of need, the study team worked with microdata from the NHSDA to develop a logistic regression model to predict the probability of need by state. The dependent variable was an approximation, based on available NHSDA variables, to a generally accepted measure of drug or alcohol dependence. Other NHSDA variables were used as predictors. The model was then applied to data in public-use microdata files from the 1990 census to predict the probability that each person in a state was in need of treatment services.
The usefulness of the NHSDA data was somewhat limited by the fact that RAND did not have access to complete information about the geographic locations of the NHSDA households. Except for a few large metropolitan areas that had been oversampled, the only geographic information available to them was census region and whether or not the household was located in a metropolitan statistical area (urban versus nonurban). Both of these variables turned out to be useful predictors. Contrary to what the framers of the legislation appear to have believed, the estimates of need were generally higher in smaller states with a less urban population. This may reflect the fact that there are more people with alcohol problems than there are with hard-drug problems and that alcoholism is more prevalent in rural areas than some people think.
One very strong predictor of individual treatment needs was gender. However, since the proportion of males does not vary much by state, its usefulness at the state level is limited. Other more useful predictors at the state level were age (highest for young adults), census region (highest probability of dependence in the West), race-ethnicity (highest for white, non-Hispanic), marital status (highest for single or separated), and completed education (highest for high school dropout). For the few large metropolitan areas that had been oversampled, it was possible to use the NHSDA data to make direct estimates of dependence and compare these with the model-based estimates. The agreement was reasonably good for four of the five areas, the exception being Los Angeles.
Some work was also done on the cost-of-services measure. Data from the National Drug and Alcoholism Treatment Unit Survey indicated that labor costs were a somewhat higher proportion of total treatment costs
Page 27
than would be indicated by the weights specified in the legislation. In addition, the survey showed that states spend more to provide services in rural areas, probably because they do not benefit from economies of scale that can be realized in urban areas. The RAND researchers believed that the cost-of-services measure could be made more equitable by adjusting the formula to reflect these differences.
After comparing allocations based on alternative measures with the allocation based on the existing formula, the researchers attempted to devise ways of presenting their findings without calling attention to outcomes for specific states. One global outcomes indicator was the fraction of the total allocation that would be moved. If only the needs component (an estimate of or proxy for the prevalence of drug or alcohol dependence) had been changed, 18 percent of the money would have been moved, and if only the cost-of-services component had been changed, 8 percent would have been moved. If both had been changed, 22 percent of the money would have been moved. A second indicator, which was referred to as “the Senate criterion,” was the number of states with changes of more than 20 percent in their shares. A third indicator, “the House criterion,” was the fraction of the population living in states with shares that changed by a large amount. Adams presented some tabulations of these indicators. One thing that stood out very clearly was the extent to which using the alternative formulas would cause funds to be transferred from the large, more urban states to the smaller, rural states.
Summarizing what was learned from the RAND study, Adams offered the following conclusions:
-
It would be possible to do a better job of defining the population and cost-of-services components of the formula. These improvements would matter, with funds being shifted from larger, urban states to smaller, rural states.
-
The formula does not recognize other programs that support substance abuse services. Also, the need estimates are for the entire state population, despite the reality that most block grant funds are spent on services for the poor and the uninsured.
-
The statistics used to improve the formula elements would be more useful if there were less clustering in the sample and if more geographic detail could be made available to the researchers.
-
The NHSDA, as a household survey, does not cover prisoners and the homeless, population groups that have a higher than average probabil-
Page 28
ity of dependence. Other data sources, such as emergency room and arrest records, should be sought to fill this gap.
Jane Maxwell, of the Texas Commission on Alcohol and Drug Abuse, was the designated discussant for the session on the SAMHSA block grants. Primarily addressing the population (needs) component of the formula, she cited several reasons why in her view it is not a good indicator of need. Block grant funds are being used to treat medically indigent people, but no measure of poverty is included in the current formula. The allocation formula includes an estimate of the number of persons at risk for substance abuse, but it does not consider what proportion of them are in need of public services. It does not reflect the need for services and it does not take into account different drugs, different populations, or differences among regions. Furthermore, the prevalence of drug abuse is changing. The allocation formula is weighted toward youth, but data from the NHSDA show that the population of drug abusers is aging.
Maxwell presented data by state from two federal data systems that indicate need:
-
The Drug Abuse Warning Network (DAWN), which collects data on mentions of drugs in cases from a sample of hospital emergency departments and medical examiners.
-
The Treatment Episode Data Set (TEDS), which contains admission and discharge data on all clients entering publicly funded substance abuse treatment programs.
She observed that there was little, if any association between indicators of substance abuse from these datasets and the per capita block grant amounts by state for 1997, which varied from $2.65 for North Dakota to $5.80 for California.
Maxwell concluded her presentation by offering options for improving the need component of the formula. The recent expansion of the NHSDA should provide good data on substance abuse for the eight states that have been oversampled. It is not clear how good the synthetic estimates for the remaining states will be. They should be compared with the results of recent telephone surveys administered by the states. If the agreement is not good, it may be necessary to use data from DAWN or TEDS to adjust the synthetic estimates. Furthermore, it should be understood that household surveys, which do not cover the institutional population, seriously under-
Page 29
count hard-core drug users. She presented data from Texas prison surveys to confirm this point.
In the general discussion that followed, it was noted that the weak association between state per capita grant amounts and measures of need might be explained, at least in part, by the fact that the formula has two other elements—cost of services and fiscal capacity. It was hypothesized that if adjustments were made for state differences in those elements, there might be a better correlation between indicators of need and grant amounts.
Jerry Fastrup provided some elaboration of Congress's reasoning behind the changes over time in the allocation formulas and procedures. He explained that the formula used prior to the 1992 amendments had favored states with a disproportionately high share of the nation's urban population. Responding to the concerns of rural states, the new formula reduced but did not eliminate this differential treatment. At the same time however, the cost-of-services factor, which favored the large urban states, was incorporated into the formula. Also associated with these changes were temporary hold-harmless provisions and features that limited the increase that any state could receive in a single year.
It had been pointed out previously that the SAMHSA block grant formulas did not take into account how much states were spending on substance abuse and mental health programs using other federal funds and their own funds. This appears to be the case for most block grant formula programs. One participant noted that it is difficult to obtain good data on what the states are spending on these programs. For matching grant programs, such as Medicaid, the size of the federal grant does depend in part on what the state spends, but it does not take account of other state programs directed at the same target populations.
Questions were raised about program rules that govern how the states use their block grant funds and about how much information is available about the extent to which program goals were being achieved. One participant observed that information is inadequate to evaluate the relative effectiveness of prevention (including interdiction) and treatment in reducing the prevalence of substance abuse. In the view of some participants, it was not cost-effective to make minor changes in formulas as long as these broader questions were not being addressed. Another view was that the important question whenever a change in a formula is being considered is whether that change is in the right or the wrong direction. The RAND study showed clearly that giving greater weight to the urban population was a move in the wrong direction.
Page 30
One participant called attention to the contrast between the nature of the formulas used for the SAMHSA block grants and the Title I education grants. For the latter, Congress has left it to an agency, the U.S. Census Bureau, to decide on what data sources and statistical procedures are best suited to produce the estimates needed for the allocation. But for the SAMHSA block grants, nearly all of these details have been specified in the legislation. It was suggested that part of the explanation for this contrast could be that until recently there have been no generally agreed-on measures of the prevalence of substance abuse and mental health treatment needs, and no agency that Congress felt it could rely on to produce such measures. How Congress will react to the improved state estimates to be produced from the NHSDA is not known. Whether they will be used in the formula may depend partly on the expected numbers of winners and losers and partly on whether members of the statistical community can agree among themselves and then convince Congress that these estimates are, in fact, better indicators of need.
THE WIC PROGRAM
The focus of the fourth case study was the Special Supplemental Nutrition Program for Women, Infants, and Children (WIC), a federal grant program administered by the Food and Nutrition Service of the U.S. Department of Agriculture. Ronald Vogel of that agency gave an overview of the program and the procedures for allocating program funds to states and Indian Tribal Organizations. The WIC program provides nutrition and health assistance services to low-income childbearing women, infants, and children. Pregnant and postpartum women and children under the age of 5 who have family incomes not exceeding 185 percent of the applicable poverty guidelines are “income eligible” to participate. To be fully eligible, participants must be determined to be at nutritional risk based on a medical or nutritional risk factor identified by a competent health professional. Persons exhibiting a medical risk factor, such as anemia, underweight, or diabetes, receive higher priority than persons at risk of inadequate nutrition. Participants receive federally prescribed packages of foods designed to meet their specific needs, plus nutrition education and counseling and access to health and social services. The program is currently funded at about $4 billion per year and serves about 7.1 million women, infants, and children each month.
For the first few years of the WIC program, which was established in
Page 31
1972, state grant amounts were determined at the discretion of the Department of Agriculture. In 1979, a funding formula was established by regulation. There have been several changes in the formula since then, but the underlying objective is to allocate the funds to state agencies in proportion to their share of the national estimate of persons eligible for assistance. The formula does not include a component to adjust for state differentials in the costs of the food packages that are distributed. The state and national estimates are both important: the former are used to determine state shares, and the latter are used by the administration and Congress to determine the total amount requested and appropriated for the program each year. Initially, the estimates were based on decennial census data, but as the program grew there were pressures to produce more timely estimates, leading to the successive introduction of a series of model-based estimates making use of more current survey and administrative data.
Vogel described several issues currently facing the WIC program:
-
Citizenship is not a condition of eligibility for WIC program benefits. Failure to include a significant portion of unauthorized immigrants in current population estimates could lower the shares of states with large numbers of eligibles in that category.
-
At present, only a few American Indian tribes are participating in the program, but the number is increasing and it may become difficult to obtain the data needed to determine how much of the funding should go to Indian Tribal Organizations.
-
There is an “adjunctive eligibility” issue. The current law establishes income eligibility for WIC for persons who participate in other means-tested programs—Medicaid, Food Stamps, and Temporary Assistance for Needy Families—even when their family income exceeds the 185 percent of the poverty cutoff. However, such persons are not included in the estimates.
-
Infant formula is a major component of the food packages provided to program participants. Congress has required the Food and Nutrition Service to seek large discounts from formula manufacturers. The WIC program currently pays about $0.35 for a can of formula that would cost from $2.50 to $2.70 in the retail market. Program data indicate that the number of infants currently served by the program exceeds the estimated number of income eligibles by 22 percent, and the manufacturers are concerned about the programs effect on their revenues.
Page 32
Like the Title I education and SAMHSA block grant programs, the WIC program includes a hold-harmless provision. Unless the current year's appropriation is smaller than that of the previous year, each state receives at least as much as it did last year, with an adjustment for inflation. When there is an increase in the overall appropriation, the growth funds are allocated to states that have been receiving less than their proportionate shares.
Allen Schirm, of Mathematica Policy Research, described the evolution of the method for estimating the number of eligible infants and children starting with 1979, when the first allocation formula was introduced by regulation. The “first-generation estimator,” which was simply the number of eligibles according to the decennial census, was used through fiscal year 1994, based initially on 1980 census data and, for fiscal year 1994 only, on 1990 census data. The shortcomings of this estimator became especially apparent following the 1990-1991 recession. Census and CPS data showed a 20 percent growth in the number of eligible infants and children between 1989 and 1992, and there was clear evidence that this growth had been spread unevenly across states. Thus, the assumption of no change not only created problems for program planning and budgeting, but also led to bias in the proportional allocation of program funds among the states.
The second-generation estimator of WIC program eligibles was an empirical Bayes shrinkage estimator (see Fay and Herriot, 1979; Ghosh and Rao, 1994) that optimally averaged CPS direct sample estimates and predictions from a regression model. The regression model predicted change in the percentage of income eligibles by state between 1989 (the income reference year for the 1990 census) and 1992 (the reference year for the March 1993 Income Supplement) based on observed changes in Food Stamp Program participation, Unemployment Insurance claims, and per capita income. The shrinkage estimates of change in the percentage eligible were added to the estimates for 1989 from the census to obtain state estimates for 1992. These 1992 estimates were multiplied by the U.S. Census Bureau's current population estimates for July 1, 1992, to obtain state estimates of income eligibles. Finally, these state estimates were ratio-adjusted to add to the CPS direct national estimate of income eligibles for 1992.
The resulting estimates were used to determine state food grants for fiscal year 1995. Over $125 million in growth funds was distributed. The estimates were more timely than census estimates and substantially more
Page 33
precise than direct CPS estimates (Schirm, 1995). Had there been no hold-harmless provision in the allocation formula, the WIC grants for about half the states would have differed by at least 10 percent from what they would have been using the first-generation estimates.
It was believed that further improvements could be realized by making use of CPS and administrative data for intervening years and by adding some new components to the regression model. This led to the third-generation estimator, which was used to allocate funds for fiscal year 1996 and has been used with some refinements for all succeeding years. Like its predecessor, the third-generation estimator is an empirical Bayes shrinkage estimator. Inputs for the 1997 estimates, for example, included data for 1989 from the 1990 census, CPS data for each of the years 1990 through 1997, and administrative data for 1989 through 1997. In the past few years, the regression model has predicted the percentage eligible in the estimation year, rather than the change in the percentage eligible, thus eliminating the need to go from levels to changes and then back to levels. Predictors that were added to those used in the earlier model were child poverty rates based on tax returns, tax return nonfiler rates for nonelderly persons, total population, and the “census regression residual,” that is, the residual obtained from regressing the WIC eligibility percentage for 1989 on values of the other predictors for that year.
Evaluation of the third-generation estimator showed good relative predictive fit of the regression model according to various criteria and there was no strong evidence of model bias. There have been substantial gains in precision from using CPS data for more than one year.
Schirm concluded his presentation by discussing opportunities for further improvements in the estimates as new and better data become available over the next few years. New data sources will include the 2000 census, the ACS, and possibly the Survey of Income and Program Participation, especially if it becomes a data source for official poverty statistics. In addition, Congress has appropriated funds for increasing sample sizes to improve the precision of CPS state estimates of children lacking health insurance, with the likely effect of also increasing the precision of state estimates of persons eligible for the WIC program. Administrative record data sources will have to be monitored, to identify potential new sources and to look at the data currently in use to see if they remain suitable as changes occur in the programs they are designed to support. Making the transition to new data sources, especially the 2000 census, will raise some complex technical and operational issues. There is still a lag of about three years between the
Page 34
period to which the estimates refer and the period for which funds are being allocated. It may be difficult to reduce this gap, but the possibilities should be examined.
The designated discussant for the session on the WIC program was David Betson, of the University of Notre Dame. He began by observing that case studies are most useful when it is possible to compare and contrast the evidence from more than one case. One issue that is present in most formula funding programs is the availability of relevant data from several different sources, for example income and poverty from the census, the CPS, and the Survey of Income and Program Participation. It is also important to consider how survey data will be used in conjunction with administrative data. The question is how to make optimum use of these varied sources of data.
Betson also noted that another common feature of the case studies presented at the workshop is that significant resources have been devoted to efforts to improve the quality of the estimates used in the funding formulas. He asked to what extent these efforts have been justified by the outcomes, taking into account the existence of program provisions that attenuate the effects of improved estimates.
Betson identified and discussed the implications of another kind of congressionally mandated formula, in the area of child support. In the Family Support Act of 1988, the states were required to develop and adopt mathematical formulas for use in setting child-support awards. Several consequences of this legislation may have some relevance to formula funding programs:
-
There was some initial resistance from the judiciary, who did not want to have their discretionary powers usurped by a mathematical formula. But when they were reassured that departures from the formula-based amount would be allowed when justified by special circumstances, they embraced the new procedure as a means of speeding up the disposition of child-support cases on their crowded calendars.
-
There was wide variation in the formulas adopted by the states. The clear intent was to develop formulas that reflect the needs of the child in the case being considered, yet only a few states take account of the age of the child.
-
Many states define need or ability to pay as 17 percent of the non-custodial parent's income. In practice, this is translated to a nominal dollar amount, which does not automatically change over time, so that no consid-
Page 35
eration is given to either changes in need as the child grows older or the effects of inflation.
Betson suggested that these observations about child support may be applicable to other formula-based programs. First, even though formula-based approaches may be viewed to take discretion out of the hands of decision makers, the formula can indeed serve their interests. Second, many formula-based programs use only crude proxies for the determination of need. Some judgment is needed to determine whether or not these proxies truly serve the intent of the program. Finally, many formula-based programs adopt ad hoc adjustments to the formula to balance competing needs or demands on the programs. Betson pointed out that the last feature is somewhat analogous to hold-harmless provisions in funding formulas. He observed that downside risks are viewed differently from upside gains but suggested that perhaps, in the interests of stability, some limitations should be placed on the latter as well.
In the general discussion of the WIC program, Schirm was asked to what extent he had examined the consequences of using alternative regression models and predictors. He said that many alternatives had been tried and their properties compared with the ones that were adopted. While others might not have chosen exactly the same estimation procedures, it did not appear to matter very much which of the more promising alternatives was finally chosen.
There was further discussion and clarification of the basis for the hold-harmless provisions of the allocation procedure, their specific nature, and their effects on the resulting allocations. Strictly speaking, it was the Food and Nutrition Service's responsibility, in consultation with the states, to develop the allocation formula and related provisions. However, the agency believed that members of Congress would have had serious concerns if no hold-harmless provisions had been included. At present, the hold-harmless amounts consist of last year's grant increased by some percentage of the accepted rate of inflation, so there is a small amount of money each year for growth allocation purposes, unless there is no increase in funding from the previous year. They have made comparisons of actual allocations with what the state grants would have been if there were no hold-harmless provisions, and there are some substantial differences in both directions. It has been observed that states that are well under their fair share have some of the lowest food package costs.
At the end of the earlier discussion of the SAMHSA block grants, one
Page 36
participant had pointed out the sharp distinction between them and the Title I education allocations. The SAMHSA block grants are based on a congressionally written formula, whereas for Title I, the responsibility for development of the estimation procedures has been delegated to the program agency. A participant noted that the WIC program followed the latter pattern, and he praised the Food and Nutrition Service for supporting the research that has been done in an effort to improve the process. However, in his experience, these two programs—Title I education and WIC—are unique; for most programs the specific details of the allocation formula and process are written into the legislation.


