
1
Introduction
Since its creation by an act of Congress in 1879, the U.S. Geological Survey (USGS) has devoted a substantial portion of its personnel and budget to studying the nation’s water resources. As a result, this agency of the Department of the Interior has been looked to historically as the primary national source of information on water quantity and quality in the United States, including both surface waters (e.g., lakes, rivers, estuaries) and groundwater. Subsequent to the increased national interest in environmental issues and the passage of extensive environmental legislation in the 1970s, the USGS role in providing data and information on water quality has become even more pivotal and more highly scrutinized. During congressional testimony in the mid-1980s, scientists at USGS realized that their ability to understand the quality of the nation’s water as a whole was limited by sporadic and variable monitoring networks across the country that did not allow national-scale data analysis. Thus, the National Water Quality Assessment (NAWQA) Program was created in 1985 to better assess historical, current, and future water quality conditions and trends in representative river basins and aquifers across the United States using highly consistent methods.
A primary objective of the NAWQA program is to describe relationships between natural factors, human activities, and water quality conditions and to define those factors that most affect water quality in different parts of the nation. More specifically, three goals drive NAWQA’s design and development: (1) status—to provide a nationally consistent description of the current water quality conditions for a large part of the nation’s water resources; (2) trends—to define long-term trends (or lack of trends) in water quality; and (3) understanding—to identify, describe, and explain (to the extent possible), the major factors that affect (and cause) observed water quality conditions and trends. Although
the exact wording of the goals has been refined over time, these three goals are the organizing themes for NAWQA’s past, present, and future.
During its first decade of monitoring (called Cycle I; see more below), which spanned from 1991 until 2001, NAWQA concentrated primarily on gathering comparable information on water resources (i.e., status assessments) in dozens of geographic areas, called study units, that include major river basins and/or aquifers nationwide. Perhaps the most important facet of the program is that the similar design of each investigation and the use of standardized methods make comparisons among disparate study units possible. Combining, comparing, and analyzing data from individual study units has led to regional and national assessments of water quality, collectively referred to as “national synthesis.” More specifically, national synthesis also includes information from other programs, agencies, and researchers to produce regional and national assessments for priority water quality issues. At first, national synthesis in Cycle I concentrated on two issues of national priority—the occurrence of (1) nutrients and (2) pesticides in streams and groundwater. These topics were ranked among the highest in importance because of widespread environmental and public health concerns and because the information necessary for a national assessment of these contaminants was incomplete. Later topics addressed by the national synthesis component of NAWQA included volatile organic compounds, trace elements, and ecological synthesis (in that order).
The National Research Council’s (NRC’s) Water Science and Technology Board (WSTB) has provided advice to NAWQA four separate times in the past as the NAWQA program has evolved from an unfunded concept in 1985 to a relatively mature and tested program in 2001. In a letter report from Walter Lynn, then the WSTB chair, to former USGS director Dallas Peck in October 1985, the WSTB heartily endorsed the concept of the original NAWQA program. WSTB members raised certain issues for USGS consideration during NAWQA program development. First, in response to the strong focus of data collection on physical and chemical parameters, the WSTB stressed the importance of including biological parameters in the program. It felt that both short-term and long-term impacts of water quality on human and ecological health would be best assessed via biological assessment. The board promoted increasing the level of interaction between the USGS and other federal and state agencies to maximize the utility of NAWQA data. Finally, the difficulties inherent in measuring groundwater parameters were acknowledged and a pilot program on groundwater quality assessment was suggested.
Shortly after this initial communication, the WSTB convened a colloquium (NRC, 1986) to specifically address what the necessary elements should be for a national water quality monitoring and assessment program. Colloquium participants raised new issues for consideration, such as which particular chemical constituents should be chosen for measurement, whether and how to interface with state monitoring programs, and how the program could reflect surface water-
groundwater interactions. Keynote speaker William Ackermann (deceased; then of the University of Illinois) warned that a national monitoring network, even if designed optimally, cannot be all things to all users. However, it should strive to meet the highest technological standards, and its data and information should be made widely available. Colloquium participants supported the idea that to initiate the program it should be operated by a single federal agency continuously for at least five years.
NAWQA was initiated in 1987 via a pilot program that focused on seven study units, all of which were either surface water or groundwater dominated. Later that year, the WSTB was requested to undertake a two-year evaluation of the pilot program and make recommendations for full-scale implementation of NAWQA. The committee that was formed to conduct the study unanimously agreed that that there was a genuine need for a national water quality program and that the USGS was ideally situated to manage such a program. After evaluating five early NAWQA reports, visiting pilot study locations, and interviewing users of NAWQA products, the NRC committee released its final report, A Review of the USGS National Water Quality Assessment Pilot Program, in 1990.
That report recommended that during full-scale implementation, some study units should be selected in which both surface water and groundwater are jointly investigated to better understand such integrated systems. Regarding possible program deficiencies, the committee questioned the decision not to include lakes and estuaries in the monitoring program and recommended that they be included whenever possible. To conserve limited resources, the pilot program was designed to rotate between study units on a regular basis, a strategy with which the committee agreed but felt should be reviewed after completion of the first phase of the program. The committee was generally pleased with the choice of chemical and physical constituents but, as in earlier WSTB communications, felt that the chosen biological parameters needed refinement. The report noted that the NAWQA pilot program at that time lacked a quantitative framework for evaluating cause-and-effect relationships between pollution sources and nearby waters, particularly at large scales. It recommended the development of mathematical modeling to assess cause-and-effect relationships and suggested directing greater resources toward these efforts.
The 1990 report states that “[NAWQA] program documentation is vague on how the information from the study units will be scaled up to the national level so that a national synthesis can be accomplished.” Shortly after commencement of the full-scale program in 1991, the USGS sought the WSTB’s advice on that very topic. The resulting report National Water Quality Assessment Program: The Challenge of National Synthesis (NRC, 1994) discusses the issues that are critical for successful national synthesis, particularly the need for process-oriented research and associated mathematical modeling. The report does not promote the use of specific models, although it notes that mass-balance models should serve as the starting point for conducting national synthesis. It also suggests that a
special program be created within NAWQA to develop basin-scale analysis tools necessary for national synthesis. Finally, because of the presumed importance of land-use impacts on water quality, the report recommends a strong effort to compile and make available land-use and land-cover data in a standardized format. Such efforts are readily apparent in many subsequent NAWQA publications.
Nearing completion of the first full cycle of data collection, USGS scientists are planning for the program’s future and have again requested the input of the NRC to help shape NAWQA activities during the program’s second decade of monitoring, known as Cycle II. An overarching concern of the USGS is to maximize program usefulness for a variety of stakeholders, given limited resources and the inherent limitations of the study unit approach. Public interest in water quality information continues to increase, and the potential applicability of NAWQA data and analyses goes well beyond a simple assessment of the nation’s overall water quality. Indeed, information from the NAWQA program is becoming integral to research, monitoring, and regulatory activities at the local, state, and regional levels.
In addition to conducting an initial assessment of the general accomplishments of the NAWQA program to date and making suggestions for the program’s overall improvement, the USGS asked the committee to provide comment on four particular areas of NAWQA: (1) suggest methodologies to improve understanding of the causative factors affecting water quality conditions; (2) assess whether information produced in the program can be extrapolated to allow inferences about water quality conditions in areas not studied intensely under NAWQA; (3) examine current priority issues (e.g., pesticides, nutrients, volatile organic compounds, trace elements) selected for broad investigation under NAWQA for completeness, and suggest other pollutants (e.g., microbial pathogens, sediments) that might also be studied on a national basis; and (4) make recommendations on the aggregation and presentation of information generated at the study unit scale so that it is meaningful at the regional and national levels.
This report presents the WSTB’s most recent effort to advise the USGS on the NAWQA program as it completes its first cycle of intensive data collection, which was focused on water quality conditions in the United States. Although some of the report’s conclusions and recommendations revisit the issues discussed by previous WSTB committees, the majority of the report concerns the increased emphasis in Cycle II on defining long-term water quality trends and understanding the causative factors of water quality conditions. It is important to state that the structure of this report, unlike many NRC reports, does not directly follow the committee’s statement of task in terms of the order and discussion of major study topics. Rather, the report’s structure, and indeed the committee’s approach to addressing its charge, evolved to reflect discussions with NAWQA staff and especially to be consistent with several iterations of the NAWQA Cycle II Implementation Team (NIT) report Study-Unit Design Guidelines for Cycle II of the National Water Quality Assessment (NAWQA) (Gilliom et al., 2000b) that were
provided for the committee’s deliberations (see Chapter 8 for further information). It is also important to state that in presenting such a comprehensive programmatic overview, the committee felt it was necessary to make some general comments about budgets and resources where pertinent to the scope of the proposed changes and additions to the NAWQA program.
The aforementioned NIT report describes the design and implementation strategy for Cycle II investigations in NAWQA study units regarding the major change in emphasis among the three NAWQA goals along with their corresponding themes and objectives. As such, it is cited frequently throughout this report. Indeed, the content, conclusions, and recommendations of Chapters 3 to 5 (see more below) are targeted to a careful review of the NIT report and subsequent deliberations by the committee. Chapters 3 to 5 differ further from the remaining chapters in that they contain sectional summaries and recommendations whereas the others do not. (However, with the exception of this introductory chapter, which has no recommendations, all chapters end with a comprehensive conclusion and recommendation section.) This format was deemed appropriate and necessary given the large number of distinct topics that are addressed in the three central chapters. While many of the committee’s recommendations were influenced by or even directly result from a careful review of this important NIT report, the committee did not directly comment on every proposed Cycle II theme and objective since many were fundamental to NAWQA operations and did not warrant discussion or comment. (The committee directs the interested reader to Appendix A of this report, which includes summaries of all Cycle II goals, themes, and objectives, and other important supporting materials that are taken directly from the NIT report.)
At the same time that this study was proceeding, a different NRC committee was addressing issues important to the mission of the USGS as a whole. That committee’s report Future Roles and Opportunities for the U.S. Geological Survey (NRC, 2001) was published during the final deliberations for this report. Obviously, future opportunities for NAWQA should comprise a subset of opportunities for the USGS. Thus, in Chapter 8, the committee also places its conclusions and recommendations for NAWQA within the broader perspective of that NRC (2001) report to the USGS.
This introductory chapter provides a brief overview and some representative results and accomplishments of NAWQA’s first decade of national water quality monitoring and introduces the forthcoming second cycle. Chapter 2 describes the transition and design changes from Cycle I to Cycle II in terms of coverage, representativeness, and other related issues. Chapters 3 to 5 assess the design and implementation goals, themes, and objectives of the USGS for Cycle II of NAWQA as related to water quality status, trends, and understanding of their cause and effects, respectively. Chapter 6 provides a review and recommends ways to improve the communication of NAWQA data and findings to a wide variety of users. Chapter 7 discusses opportunities for increased cooperation and
coordination between NAWQA personnel and local, state, and federal agencies that are concerned with water quality. Lastly, Chapter 8 summarizes the report’s key conclusions and recommendations as related to the committee’s statement-of-task issues and, more broadly, to the future of the NAWQA program.
It is also important to state that the committee’s four specific tasks related to its charge are fundamentally interwoven throughout the planned Cycle II goals, themes, and objectives. As such, they are addressed in many places throughout the report, where appropriate, in the context of NAWQA’s Cycle II design and implementation planning framework. Issue 1, to “recommend methods for the improved understanding of the causative factors affecting water quality conditions,” is addressed primarily in Chapter 5, but pertinent issues are also discussed in Chapters 3 and 4. Issue 2, to “determine whether information produced in the program can be extrapolated so as to allow inferences about water quality conditions in areas not studied intensely in NAWQA,” is addressed in Chapter 2 in terms of the representativeness of the reduced study unit framework; in Chapters 3 and 4 in discussing the adequacy of monitoring and monitoring networks; and further in Chapter 5 in terms of extrapolation and forecasting. Issue 3, to “assess the completeness and appropriateness of priority issues . . . selected for broad investigation under the national synthesis component of the program,” is addressed primarily in Chapter 3, although Chapters 4 and 5 also comment on related topics such as the effects of urbanization, changing agricultural management practices, and the assessment of stream ecology. Issue 4, to “describe how information generated at the study unit scale can be aggregated and presented so as to be meaningful at the regional and national levels,” is addressed at various levels in Chapter 2, again related to the discussion of representativeness and the language of national synthesis; in Chapter 5, as related to extrapolation; and in Chapter 6, as related to meaningfully communicating information to regional and national policy makers. Finally, Chapter 8 explicitly summarizes where and how all four statement-of-task issues are addressed throughout this report.
In summary, throughout its deliberations, the committee maintained that its fundamental and overriding charge was clearly “to provide guidance on opportunities to improve the NAWQA program”—not simply to address four particular issues interwoven in the Cycle I and planned Cycle II design of the program. In this regard, many of the conclusions and recommendations of this report go beyond those implied by a strict reading of the issues raised in the statement of task. For these reasons, the report’s organization is essentially a blend of a review of the NAWQA implementation plans for Cycle II and the committee’s statement of task.
OVERVIEW OF CYCLE I OF NAWQA
As noted previously, the goals of the NAWQA program are to assess the status of and trends in the quality of the nation’s surface and groundwater
resources and to link the status and trends with an understanding of the natural and human factors that affect water quality (Gilliom et al., 1995; Hirsch et al., 1988). To this end, NAWQA is completing its first decade of nationwide study (1991 to 2001; Cycle I) and is about to embark on its second decade of study (Cycle II). While this report provides conclusions and recommendations primarily cogent to Cycle II of NAWQA, an overview of the design, implementation, and representative results of its first cycle is prudent because much of the basic design characteristics will remain in place for its second decade. Indeed, NAWQA has been designed to build and expand on the broad base of knowledge gained in its first decade to support the Cycle II emphasis on understanding and explaining the processes controlling water quality (Mallard et al., 1999). This improved understanding will help make NAWQA even more relevant and useful to resource managers, policy makers, and regulatory agencies throughout the United States.
The NAWQA program seeks to balance the unique assessment requirements of individual hydrological systems with those of a nationally consistent design structure that incorporates a multiscale, interdisciplinary approach for groundwater and surface water (Gilliom et al., 1995, 1998; Miller and Wilber, 1999). The program integrates diverse information about water quality at a wide range of temporal and spatial scales and focuses on water quality conditions that affect large areas of the United States. As noted previously, nutrients and pesticides have been the initial focus of much work since the program’s inception (Gilliom et al., 1995; USGS, 1999).
The basic building blocks of the NAWQA program in Cycle I continue to be the study unit investigations of major hydrologic basins located throughout the nation. While the original design of NAWQA called for 60 study units, their number in Cycle I was reduced to 59 in 1996 by combining two adjoining study units in New England that were determined to have similar hydrologic and land-use characteristics. At the time this report was written, a total of 51 Cycle I study unit assessments had been initiated since 1991. Of these, 36 assessment reports were completed, with another 15 due to be completed later in 2001. In this regard, eight study unit investigations slated to begin in fiscal year 1997 were never initiated because of budgetary constraints (see Figure 1-1, Table 1-1, and Chapter 2 for further information). In addition, initiated during Cycle I (1999) of NAWQA and continuing into Cycle II, the USGS has a six-year monitoring program to evaluate groundwater quality in the High Plains aquifer system that underlies 174,000 square miles in parts of eight states (Colorado, Kansas, Nebraska, New Mexico, Oklahoma, South Dakota, Texas, and Wyoming; see Figure 1-1). This ongoing NAWQA investigation is called the High Plains Regional Ground Water (HPGW) Study and covers much of the geographic area of the study units that were not conducted because of budget constraints.
Chapter 2 of this report includes a detailed discussion and assessment of the number of study unit investigations planned for Cycle II. Collectively, the
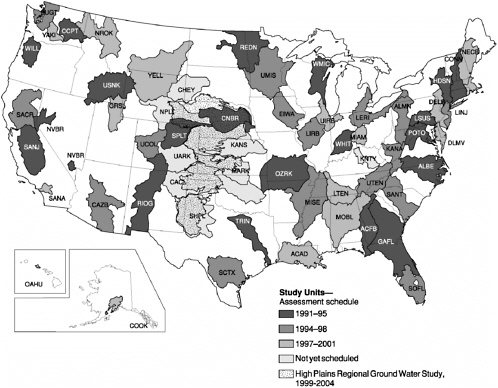
TABLE 1-1 Monitored and Planned Cycle I NAWQA Study Units
|
Abbreviation |
Name |
States in Study Unit |
Starting Year |
|
ACAD |
Acadian-Pontchartrain Drainages |
LA, MS |
1997 |
|
ACFB |
Apalachicola-Chattahoochee-Flint River Basins |
AL, FL, GA |
1991 |
|
ALBE |
Albemarle-Pamlico Drainages |
NC, VA |
1991 |
|
ALMN |
Allegheny-Monongahela River Basins |
MD, NY, PA, WV |
1994 |
|
CACI |
Canadian-Cimarron River Basins |
CO, KS, NM, OK, TX |
None |
|
CAZB |
Central Arizona Basins |
AZ |
1994 |
|
CCPT |
Central Columbia Plateau |
ID, WA |
1991 |
|
CHEY |
Cheyenne-Belle Fourche River Basins |
NE, SD, WY |
None |
|
CNBR |
Central Nebraska Basins |
NE |
1991 |
|
CONN |
Connecticut, Housatonic, and Thames River Basins |
CT, MA, NH, NY, RI, VT |
1991 |
|
COOK |
Cook Inlet Basin |
AK |
1997 |
|
DELR |
Delaware River Basin |
NY, NJ, PA |
1997 |
|
DLMV |
Delmarva Peninsula |
DE, MD, VA |
1997 |
|
EIWA |
Eastern Iowa Basins |
IA, MN |
1994 |
|
GAFL |
Georgia-Florida Coastal Plain Drainages |
FL, GA |
1991 |
|
GRSL |
Great Salt Lake Basins |
ID, UT, WY |
1997 |
|
HDSN |
Hudson River Basin |
CT, MA, NJ, NY, VT |
1991 |
|
KANA |
Kanawha-New River Basin |
NC, VA, WV |
1994 |
|
KANS |
Kansas River Basin |
CO, KS, NE |
None |
|
KNTY |
Kentucky River Basin |
KY |
None |
|
LERI |
Lake Erie-Lake St. Clair Drainages |
IN, MI, OH, PA, NY |
1994 |
|
LINJ |
Long Island-New Jersey Coastal Drainages |
NJ, NY |
1994 |
|
LIRB |
Lower Illinois River Basin |
IL |
1994 |
|
LSUS |
Lower Susquehanna River Basin |
MD, PA |
1991 |
|
LTEN |
Lower Tennessee River Basin |
AL, GA, TN |
1997 |
|
MARK |
Middle Arkansas River Basin |
CO, KS, OK |
None |
|
MIAM |
Great and Little Miami River Basins |
IN, OH |
1997 |
|
MISE |
Mississippi Embayment |
AR, KY, LA, MO, MS, TN |
1994 |
|
MOBL |
Mobile River Basin |
AL, GA, MS |
1997 |
|
NECB |
New England Coastal Basins |
MA, ME, NH, RI |
1997 |
|
NPLT |
North Platte River Basin |
CO, NE, WY |
None |
|
NROK |
Northern Rockies Intermontane Basins |
ID, MT, WA |
1997 |
|
NVBR |
Nevada Basin and Range |
CA, NV |
1991 |
|
OAHU |
Oahu |
HI |
1997 |
|
OZRK |
Ozark Plateaus |
AR, KS, MO, OK |
1991 |
|
POTO |
Potomac River Basin |
DC, MD, PA, VA, WV |
1991 |
|
PUGT |
Puget Sound Basin |
WA |
1994 |
|
REDN |
Red River of the North Basin |
MN, ND, SD |
1991 |
|
RIOG |
Rio Grande Valley |
CO, NM, TX |
1991 |
|
SACR |
Sacramento River Basin |
CA |
1994 |
|
Abbreviation |
Name |
States in Study Unit |
Starting Year |
|
SANA |
Santa Ana Basin |
CA |
1997 |
|
SANJ |
San Joaquin-Tulare River Basins |
CA |
1991 |
|
SANT |
Santee River Basin and Coastal Drainages |
NC, SC |
1994 |
|
SCTX |
South-Central Texas |
TX |
1994 |
|
SHPL |
Southern High Plains |
NM, TX |
None |
|
SOFL |
Southern Florida Drainages |
FL |
1994 |
|
SPLT |
South Platte River Basin |
CO, NE, WY |
1991 |
|
TRIN |
Trinity River Basin |
TX |
1991 |
|
UARK |
Upper Arkansas River Basin |
CO, NM |
None |
|
UCOL |
Upper Colorado River Basin |
CO, UT |
1994 |
|
UIRB |
Upper Illinois River Basin |
IL, IN, WI |
1997 |
|
UMIS |
Upper Mississippi River Basin |
MN, MI |
1994 |
|
USNK |
Upper Snake River Basin |
ID, MT, NV, UT, WY |
1991 |
|
UTEN |
Upper Tennessee River Basin |
GA, KY, NC, SC, TN, VA |
1994 |
|
WHIT |
White River Basin |
IN |
1991 |
|
WILL |
Willamette Basin |
OR |
1991 |
|
WMIC |
Western Lake Michigan Drainages |
MI, WI |
1991 |
|
YAKI |
Yakima River Basin |
WA |
1997 |
|
YELL |
Yellowstone River Basin |
MT, ND, WY |
1997 |
59 Cycle I study units would have accounted for 60 percent to 70 percent of national water use and of the population served by public water supplies (Gilliom et al., 1998). They would have covered about one-half of the total land area of the United States and included diverse hydrological systems that differ widely in the natural and human factors that affect water quality.
During Cycle I (as indicated in Figure 1-1 and Table 1-1), the study units were divided into three groups that were studied on a rotational schedule. The approximately decadal study cycle included three to five years of intensive data collection and analysis, preceded by an initial planning period and followed by several years of report preparation and low-level assessment activities (Gilliom et al., 1998). Thus, about one-third of the Cycle I study units were in the intensive data collection phase at any given time (Miller and Wilber, 1999).
To maximize their utility, study unit investigations are designed to meet the national synthesis requirements for consistent and integrated information, yet to remain flexible enough to meet individual, local needs of study units for assessing water quality. Each study unit investigation in Cycle I consisted of four interrelated components (Gilliom et al., 1995; Miller and Wilber, 1999):
-
Retrospective analysis. This review and analysis of existing water quality data provided a historical perspective on water quality throughout the study unit. It formed the basis for addressing what was already known and aided the design of further investigations with respect to current water quality conditions, trends and changes, and understanding causes and effects (e.g., USGS, 1997).
-
Occurrence and distribution assessment. This component built on the findings of the retrospective analysis and characterized the broad-scale geographic and seasonal distributions of current water quality conditions in a study unit in relation to major point and nonpoint contaminant sources and natural or background conditions. This assessment was also used to help fill gaps in existing data for each study unit. Assessment features, including physical, chemical, and biological measurements, media sampled, and spatial and temporal resolution, were designed to be consistent among the study units. Results of this assessment were also used to identify the most important questions in the study unit area about sources, transport, fate, and effects to be addressed by the case studies (see below).
-
Trend and change assessment. This assessment focused on long-term (decadal-scale) trends and changes in water quality conditions. This component led to new questions about causes and effects in each study unit and identified changes that needed to be made in the periodic intensive study phases. Future trend and change assessments are intended to be based on data collected between intensive study phases and on data from subsequent three-year intensive phases.
-
Case (synoptic) studies of sources, transport, fate, and effects. Case studies were used to improve understanding of selected questions about sources, transport, fate, and effects that arise from all aspects of NAWQA investigations and often lead to changes in assessment approaches over time.
As noted previously, the occurrence and distribution assessment was the primary focus during Cycle I for all study units because it provides the foundation of data and information needed for later study unit investigation components.
Surface Water
Because the national study design for surface water and groundwater studies in Cycle I has been described in detail (Gilliom et al., 1995, 1998), only a brief summary is provided here. The surface water design focuses on water quality conditions in rivers and streams (collectively referred to as streams) of each study unit. Lakes, reservoirs, and coastal waters were not addressed as part of the national design in Cycle I, although they are selectively investigated in some study units (e.g., Callender and Van Metre, 1997). Furthermore, while the surface water sites located throughout NAWQA included a wide range of stream sizes, types, and land-use settings in major regions of the nation, they were not selected to be a statistically representative sample of streams in the United States
(Miller and Wilber, 1999). Rather, the NAWQA study design for surface water investigations is somewhat biased toward sampling a greater prevalence of small (17 to 1,243 km2) and large basins (1,244 to 221,497 km2) with large proportions of agricultural and urban land compared to all similarly sized basins in the United States. The surface water study design used the following three interrelated components:
-
Water-column studies focused on assessing physical and chemical characteristics, including major ions, nutrients, organic carbon, dissolved pesticides, and suspended sediment, and related these characteristics to hydrologic conditions, sources, and transport.
-
Bed sediment and tissue studies were the primary means by which trace elements and hydrophobic organic contaminants (which tend to associate with particles and accumulate in biological tissues rather than be dissolved in water) were initially assessed in Cycle I of NAWQA.
-
Ecological studies evaluated the impacts of land use and the effects of physical and chemical characteristics of water on aquatic biota in streams, such as benthic macroinvertebrates, algae, and fish communities.
All three study components relied on coordinated sampling of varying intensity and scope at two general types of sites: integrator and indicator (Gilliom et al., 1995). In brief, integrator sites were chosen to represent water quality conditions of streams in heterogeneous large basins that are commonly affected by complex combinations of land-use settings, point and nonpoint sources of contaminants, and natural influences. Data from integrator sites provide a general check on the persistence of water quality influences evident at indicator sites associated with specific environmental settings (see more below) and are used for water budget and contaminant transport assessments. In contrast, indicator sites were chosen to represent water quality of streams in relatively homogeneous and usually smaller basins associated with specific environmental settings (e.g., a specific combination of geologic setting and land use). Thus, the water quality at indicator sites is influenced primarily by the targeted environmental setting. Furthermore, there are two special types of indicator sites known as reference and point source sites. Reference indicator sites were located downstream of undisturbed drainages that were chosen to represent background conditions within a basin. Point source indicator sites were located downstream of specific major point sources of contamination that may result in regionally significant water quality effects. They were usually paired with a site upstream of the point source.
The sampling strategy for water column, bed sediment and tissue, and ecological studies in Cycle I was based on monitoring at a combination of integrator and indicator sites (Gilliom et al., 1995). A few selected sites underwent intensive sampling for all water quality characteristics of concern related to all three components. Additional sites were included progressively and underwent more
specialized but less frequent sampling. The most complete data set for the three components of a surface water investigation were collected at a selected core of three to five integrator sites and four to eight indicator sites in each study unit, which together constitute the fixed-site monitoring network for regular collection of samples over time (Miller and Wilber, 1999). In each study unit, a subset of two to five sites, usually one integrator site and two to four indicator sites, was sampled more intensively than the rest, and these were the only sites for which water samples were routinely analyzed for pesticides. Samples were also collected for low-level analyses of volatile organic compounds (VOCs).
Groundwater
The national study design in Cycle I for groundwater focused on water quality conditions in major aquifers and in recently recharged shallow groundwater associated with present and recent human activities (Miller and Wilber, 1999). However, the agricultural and urban settings focus of the Cycle I NAWQA groundwater design was similar to the surface water investigations. Whereas stream water quality is highly variable over time, groundwater quality is determined primarily by chemical characteristics that tend to vary more spatially than temporally. Thus, the general groundwater monitoring approach in Cycle I focused on spatial characterization. Specifically, groundwater quality was assessed using three primary study components:
-
Aquifer or “study unit” surveys assessed the quality of water in the major aquifer systems of each study unit by primarily sampling existing wells.
-
Land-use studies used observation wells to assess the quality of recently recharged shallow groundwater (generally less than 10 years old) associated with regionally extensive combinations of land uses and hydrogeological conditions.
-
Flowpath studies used transects and groups of clustered, multilevel observation wells to examine specific relations among land-use practices, groundwater flow, contaminant occurrence and transport, and surface water and groundwater interactions.
Generally, each Cycle I aquifer survey and land-use study consisted of sampling about 30 randomly selected sites (wells or springs) in the geographic area and aquifer zone targeted for the specific study, with one sample collected from most of the sites (Gilliom et al., 1998). A total of 114 aquifer surveys and 105 land-use studies were completed in the 51 study units during Cycle I (Robert Gilliom, USGS, personal communication, 2001). Of the 105 land-use studies, 67 targeted agricultural settings, 34 targeted urban settings, and 4 targeted forested settings. One or two flowpath studies were planned in each study unit during the first cycle and were viewed as the potential beginning of long-term studies that would lead to more intensive groundwater investigations (Gilliom et al., 1995).
However, the flowpath study component of many study units in Cycle I was dropped because of a lack of background information and inadequate financial resources (Mallard et al., 1999).
Selection of Target Analytes and Contaminants1
During Cycle I of NAWQA, the USGS selected a wide range of physical, chemical, and biological parameters to monitor in a nationally consistent manner (Miller and Wilber, 1999). In general, the selection of target analytes and contaminants was based on their relevance to important water quality issues and on the existence of appropriate analytical methods. Water quality measurements included field measurements of streamflow, pH, temperature, dissolved oxygen, and specific conductance and laboratory analyses of major ions, nutrients, trace elements, organic carbon, pesticides, and VOCs (Gilliom et al., 1995, 1998). Miller and Wilber (1999) noted that for some water quality issues (e.g., nutrient enrichment, acidification, salinity, sedimentation) the choice of target analytes is a relatively simple task and their analysis is relatively inexpensive. In contrast, selection of target analytes for chemical contaminants such as pesticides and VOCs is much more difficult because of the large number of substances to consider and their relatively high unit cost of measurement. Descriptions of biological communities were considered essential for an overall assessment of water quality resources and were made by assessing three taxonomic groups (fish, invertebrates, and algae) and habitat conditions. Chapter 3 of this report includes a discussion of the role of Cycle II of NAWQA in identifying and assessing emerging contaminants.
National Synthesis
The national assessment component of NAWQA accomplishes two primary goals (Miller and Wilber, 1999). First, the regular accumulation of consistent and comparable water quality assessments for some of the largest, diverse, and important hydrological systems of the nation stands by itself as a major contribution to the knowledge of regional and national water quality. Second, the NAWQA national synthesis builds on and expands the findings from individual study units by combining them with other historical information (e.g., land use) reported by the USGS and other agencies and researchers. National synthesis teams produce regional and national assessments for priority water quality topics by comparative analysis of these study unit findings. National synthesis efforts focused on pesticides and nutrients began in 1991 and continue to this day, with
several related USGS reports and other documents already having been published (e.g., Kolpin et al., 1998; USGS, 1999) and made available on the Internet. Similarly, national synthesis of data on VOCs began in 1994, trace elements in 1997, and ecological synthesis in 1999 (see Chapter3 and 8 for further information on the national synthesis topics and teams).
INITIAL ASSESSMENT OF NAWQA RESULTS AND ACCOMPLISHMENTS
As part of its statement of task and to help put the remainder of this report into proper context, the committee was charged to conduct an initial assessment of the general accomplishments of the NAWQA program to date (i.e., essentially Cycle I). More specifically, to perform such an assessment, the committee was tasked to engage in discussions—during official committee functions and independently—with USGS-NAWQA program scientists and other persons and organizations that routinely interact with NAWQA personnel and use or contribute to their data (i.e., “NAWQA users”). In this regard, at four of its five scheduled meetings the committee heard presentations and had discussions with several USGS-NAWQA personnel, including the chief hydrologist of the USGS, the NAWQA chief, NAWQA national synthesis chief, three national synthesis topic chiefs (VOCs, pesticides, and ecological synthesis), two study unit chiefs (Santa Ana Basin and Long Island-New Jersey Coastal Drainages), and other NAWQA scientists. In addition, the committee also heard presentations and had discussions with several NAWQA users and collaborators at most of its meetings. Outside of the scheduled meetings, however, all committee members met with or had phone discussions with various USGS-NAWQA staff and many NAWQA users in support of their deliberations and work on this report.
As required, the committee also carefully reviewed several iterations of draft internal reports by USGS-NAWQA that outline opportunities and strategies to improve NAWQA as it enters its second decade as a national monitoring program. However, the committee’s overall assessment of the NAWQA program went beyond these stipulated activities and includes an abbreviated (by necessity) overview of the breadth, availability, and usefulness of NAWQA publications and Internet-based information to date. These are summarized below and discussed more extensively in Chapter 6 of this report. Several representative accomplishments and results of NAWQA to date are also provided to illustrate the widespread importance and success of this national monitoring program.
Summary of Data and Information Dissemination in NAWQA
As of February 2001, almost 1,000 NAWQA-related documents have been published or otherwise made publicly available. These can be divided into several categories of documents including circulars, fact sheets, Open-File Reports,
Water-Resources Investigation Reports, conference proceeding papers, journal articles, and books or chapters. In addition, newsletters, academic theses, pamphlets, and other miscellaneous materials have been generated. These documents can be further classified as to whether they are generated at the study unit level (e.g., 36 individual study unit circulars from Cycle I have been published); are based on findings from national synthesis topics (e.g., The Quality of Our Nation’s Waters: Nutrients and Pesticides; USGS, 1999); are technical documentation of study design, field protocols, and methods comparisons (Koterba et al., 1995); or are of national-level interest and outreach (e.g., Review of Phosphorus Control Measures in the United States and Their Effects on Water Quality, Litke, 1999). Much of this published information is also available through the Internet, and many of the data collected from the first 36 Cycle I study units are contained in the NAWQA Data Warehouse (an Oracle database) that is also available on the Internet.
As noted above, Chapter 6 provides further information and discussion of such NAWQA products as related to the communication of NAWQA data and findings to various users.
Representative Accomplishments of Cycle I of NAWQA
The NAWQA program has been remarkably productive in its first decade of national monitoring. There are numerous accomplishments, important to every study unit, but also many that are recognized accomplishments at the national scale. As a sampling, the committee presents below 10 examples of the program’s representative accomplishments that illustrate the breadth of contributions NAWQA has already made, and continues to make, to the nation.
Identification of Unexpectedly Frequent Occurrences of Pesticides in Urban Streams
In Cycle I of NAWQA, water samples from streams flowing through agricultural and urban landscapes were analyzed for herbicides and pesticides. One result from these studies, which was surprising to many, was the prevalence of insecticides in urban streams (USGS, 1999). In contrast to agricultural landscapes, urban areas had not traditionally been considered important contributors to pesticide contamination of waters. NAWQA researchers documented widespread occurrence of insecticides that are commonly used in homes, gardens, and commercial areas. The most commonly occurring insecticides were diazinon, carbaryl, chlorpyrifos, and malathion. These occurred with higher frequency and oftentimes at higher concentrations in urban than in agricultural areas. Most urban streams sampled had insecticide concentrations exceeding water quality guidelines for health of aquatic organisms in 10 to 40 percent of samples collected throughout the year. Some herbicides commonly used on lawns, road
margins, and golf courses were also detected frequently. Pesticides in urban streams most commonly occurred in mixtures, similar to agricultural areas, rather than as isolated occurrences of a single pesticide.
Integrating Biological Assessments into Water Quality Monitoring
Previous USGS water quality monitoring has been directed almost exclusively to measures of physical and chemical aspects of water quality. During Cycle I of NAWQA, USGS scientists began a program of biological assessment that was integrated with the more traditional physical and chemical measures. As noted later in this report (Chapter 5), this data set will provide a valuable contribution to the ongoing debate on how best to do biological assessment and what such assessment tells us about water quality that was not evident from other methods. In addition, some interesting patterns were observed during the early Cycle I analyses. For example, in the Yakima River Basin (Cuffney et al., 1997), condition of algal and invertebrate communities declined precipitously above a certain value of an agricultural intensity index and then showed little further decline. This suggests a threshold response to increasing intensity of agricultural activity, which has implications for the design of both monitoring and restoration programs. Future monitoring efforts can be directed toward better documenting that part of the response curve nearest the threshold (i.e., assessing conditions when biological communities are affected most rapidly). The USGS has used this approach in its Cycle II design for assessing impacts of urban expansion (see Chapter 5). The existence of a threshold also provides a potential mechanism for prioritizing sites for restoration. Dollars invested in creating improvements in conditions at sites that are near the threshold are likely to provide a greater payoff in improved biological conditions than dollars invested in sites that are well beyond the threshold. At the most degraded sites, a much greater investment may be needed to improve conditions such that there is measurable improvement in biological integrity.
Ecological and Human Health Issues
Potential impact on the reproductive, nervous, and immune systems from low-level exposure to environmental contaminants has become a growing concern for the protection of wildlife, aquatic organisms, and human health. The assessment of substances that may exert potential “endocrine disruption” health effects is a focus of the Food Quality Protection Act of 1996. NAWQA data have provided the first significant glimpse of potential associations among groups of pesticides and hormones in fish on a national scope. These early studies show a strong association of the highest pesticide concentrations in surface waters— though typically below suspected aquatic toxicity levels—with the lowest values of a key hormone ratio, which suggests impacts on endocrine functioning
(Goodbred et al., 1996). This is an important early signal that warrants further research.
Emerging and Unexpected Chemical Contaminants in Water: MTBE
Developing a list of chemical contaminants of concern that affect the nation’s water quality is an ever-changing target. Each year, industry produces thousands of new chemicals that may be released intentionally or inadvertently into the environment. Furthermore, established chemicals occasionally may create unforeseen environmental problems or be of greater concern for ecological or human health than originally thought. These emerging contaminant concerns go far beyond the monitoring of currently regulated chemicals. NAWQA, through its broad-spectrum approach to contaminants in water (and to a lesser extent in biota and sediments), is on the front line to assess these new and emerging chemicals. Many of the analytical methods used in NAWQA are multiresidue methods (i.e., they can detect a broad spectrum of contaminants in a single sample). While NAWQA uses a list of target chemical compounds for which every sample is analyzed, USGS scientists often evaluate their samples and analysis results for nontarget compounds that may be present or look for new or unexpected chemical occurrence (e.g., through the use of computerized searches of mass spectral libraries).
In the 1970s, methyl tert-butyl ether (MTBE) was not generally regarded as a water contaminant, but as a compound that could help to produce cleaner air by being added to gasoline. In the 1990s, however, MTBE was discovered to be widely occurring in NAWQA and USGS Toxic Substances Hydrology Program samples (e.g., Delzer et al., 1996; Squillace et al., 1996; Zogorski et al., 1997) and was subsequently added to the USGS list of VOCs to be monitored. These data have played an important role in the U.S. Environmental Protection Agency (EPA) and several states in making a more thorough review of MTBE’s potential impact on drinking water. In fact, these data showed that as an unintended consequence of MTBE use, shallow groundwater, particularly in urban areas, was showing widespread albeit low-level contamination. EPA and USGS have since entered into a jointly funded program to conduct more detailed monitoring for MTBE in some critical states where it is suspected to be a greater problem. For example, they have found that about nine percent of community drinking water systems in New England had detections of MTBE. These findings have prompted new state policies and monitoring as well.
Assessment of Linkages Between Changes in Phosphorus Loads and Clean Water Act Policy
One of the major accomplishments of NAWQA to date is the use of historical data on phosphorus loadings to evaluate the effects of various phosphorus control measures implemented in response to the Clean Water Act (Litke, 1999).
Phosphorus is a plant nutrient and enriched phosphorus levels in surface water can accelerate the growth of algae and other plants, resulting in eutrophic conditions in lakes and streams. Such conditions can harm the aquatic environment and impair recreational fishing and other uses. Phosphorus inputs to the environment began to increase since the 1950s as the use of fertilizers and phosphate-based laundry detergent increased. Eutrophication was recognized as a primary water quality concern during the 1960s, and reducing eutrophic conditions in surface water was one of the goals of the Clean Water Act. Some of the actions taken to reduce phosphorus levels included upgrading wastewater treatment plants, state-level bans on phosphate detergents, and reducing runoff from cropland.
As part of the (NAWQA) National Synthesis for nutrients, Litke (1999) reviewed the history of phosphorus controls in the United States and demonstrated how retrospective data collected by the NAWQA program might be used to evaluate the effect of phosphorus controls on water quality. More specifically, data from NAWQA are representative of a variety of phosphorus control measures and therefore may be used to evaluate the effects of various control strategies. To date, data show that phosphorus concentrations are reported to be decreasing in many NAWQA study units, largely a result of the reduction in the use of phosphate detergents and phosphorus limits at treatment plants. However, more analysis needs to be done to explain why phosphorus concentrations have not declined in some basins.
Development of SPARROW
SPARROW (Spatially Referenced Regressions on Watershed Attributes) is a watershed scale model with a mechanistic basis and is a major contribution to water quality modeling tools and literature. SPARROW was developed by the USGS (Smith et al., 1997), although not under the NAWQA program. However, NAWQA’s highly visible use of SPARROW is helping to make the model increasingly known and is enabling many parties to use it. The watershed model has many desirable characteristics including consideration of multiple sources of nutrients, a good balance between land-to-water processes and in-stream processes, its ability to be validated with monitored data, and the fact that it quantifies uncertainties. SPARROW has been used to assess sources of nutrients in the nation’s watersheds (Smith et al., 1997), to predict total nitrogen transport in rivers of the conterminous United States (Smith and Alexander, 2000), to predict the delivery of nitrogen to the Gulf of Mexico that contributes to hypoxia (Alexander et al., 2000), and to predict total nitrogen in the monitoring sites in the Chesapeake Bay watershed. SPARROW has the potential to become one of the most commonly applied models in support of the EPA’s Total Maximum Daily Load (TMDL) Program because it employs watershed parameters that may be estimated using generally available data.
Hyporheic Zone Work Throughout NAWQA
The hyporheic zone, or surface water-groundwater ecotone, is the interface between groundwater and surface water (Gibert et al., 1990; Vervier et al., 1992). In this region, active and dynamic exchange of water, organisms, and chemicals occurs between the surface water and the adjacent groundwater system (Gibert et al., 1990; Triska et al., 1989; Vervier et al., 1992). Thus, the hyporheic zone is an important component for understanding surface water quality and near-surface groundwater quality, and NAWQA researchers are advancing our knowledge of hyporheic processes and their effects on water quality. For example, Hinkle et al. (2001) showed that calculation of groundwater solute loads to large streams based on regional groundwater geochemistry, without accounting for hyporheic zone biogeochemical transformations, could result in significant errors. Another excellent example of surface water-groundwater-hyporheic zone water quality work emerging from Cycle I of NAWQA is that of McMahon and Bohlke (1996). They showed that along the South Platte River, denitrification and surface water-groundwater mixing within the alluvial aquifer sediments may greatly decrease the nitrate added to streams by discharging groundwater.
Information Dissemination in NAWQA
Although most of the NAWQA budget and effort is devoted to data collection and interpretation, it is the reporting of the program’s findings that is most critical for its widespread use and ultimate success. In this regard, the NAWQA program is generating a tremendous amount of data and information that are of interest to researchers, resource management and regulatory agencies, and the general public. A wide range of information has been made available, including program history and design, sampling and analysis protocols, study unit findings, and interpretations at both the study unit and the national scales. NAWQA information is communicated to a wide audience through reports, databases, the Internet, and other digital products. Information generated by NAWQA is already being used by a number of states to assist them in designing and implementing additional water quality programs (see Chapters 6 and 7 for further discussion).
Improved Methods and Detection Levels for Chemical Contaminants
NAWQA program personnel have worked to refine and improve existing analytical methods while simultaneously lowering their detection and reporting levels (i.e., concentrations). These efforts have also led to improvements outside the laboratory to include field sampling and processing and extraction of samples. However, many of these improvements require well-trained field personnel (such as USGS staff) to collect samples. The improved, lower-level reporting concentrations are another important contribution. For example, as one tries to gain an
increased understanding of chemical contaminant occurrence, fate and transport, and cause-and-effect relationships, it is important to know what the real concentration of a contaminant is in the environment—that is, to distinguish between low-level and “zero” occurrence (or censored “less than” data) of chemical contaminants. Other organizations have adopted USGS protocols to achieve lower detection levels for new studies.
Improved Coordination and Collaboration with Other Federal and State Agencies
NAWQA has become a model of an effective, collaborative federal program—an attribute that policy makers always stress, but seldom achieve. Within the USGS, NAWQA has successfully integrated its program with the Toxic Substances Hydrology Program, the National Research Program, and the District-State Cooperative Programs, for example. NAWQA has established some exemplary relations with EPA and state governments. It has placed USGS staff within key EPA offices. The EPA and both state and local agencies have found NAWQA of such value that they have furthered the symbiosis by providing funding to USGS for NAWQA to help meet their additional information needs (see Chapter 7 for further discussion).
These examples are but a small cross section of NAWQA accomplishments. The committee’s initial assessment finds that NAWQA is a well-organized, managed, and implemented program. It has significantly contributed to understanding the quality of the nation’s water resources and the natural and anthropogenic factors that affect their quality. In this report, the committee provides guidance and recommendations for program improvements in Cycle II. In a program of this scope, there is always room for improvements and new efficiencies. However, the committee is duly impressed with the significance and magnitude of NAWQA’s accomplishments in Cycle I. NAWQA clearly has provided the nation with a significant body of new knowledge to better understand and manage our vital water resources. The program has become an exemplary institution, illustrating that sound science can be applied at a national scale to resource assessment. Finally, NAWQA has assumed a vital leadership role, helping to improve environmental monitoring in many agencies from the federal to the local levels, both by its example and by technical assistance to others.
INTRODUCTION TO CYCLE II OF NAWQA
As NAWQA neared the end of its first decade of nationwide study, the USGS internally organized the NAWQA Planning Team (NPT) in January 1997 to evaluate the overall success of the program and make recommendations for NAWQA design as it begins its second cycle (see Mallard et al., 1999). Overall, the NPT lauded NAWQA’s valuable contributions to the understanding of the quality of
the nation’s waters and concluded that the principles established during the first decade of the program should guide NAWQA during its second decade. The NPT provided 10 major conclusions and recommendations for the design of Cycle II of NAWQA, the most important being a recommended shift in the overall emphasis of the program from the occurrence and distribution of selected contaminants to enhanced efforts toward understanding and explaining the processes controlling water quality. This shift in program emphasis is reflected in the committee’s statement of task and is the primary subject of Chapter 5 of this report. The other major theme pervading the NPT report is the realization that program-wide design changes are needed for the second cycle of NAWQA to maintain and enhance the program in the face of funding shortfalls that are not likely to improve (and may worsen) in the immediate future. One major consequence of these budgetary constraints was a strong recommendation for the reduction in the total number of study units investigated in Cycle II rather than reducing the extent of monitoring and assessment activities.
In June 1999, the USGS internally formed the NAWQA Cycle II Implementation Team to develop a strategy for implementing the second cycle of NAWQA studies. Furthermore, Cycle II investigations must be based on the recommendations of the NPT, budget and management considerations, and experiences learned from implementing Cycle I of NAWQA. The first of two reports by the NIT describes its recommendations for the prioritization and selection (reduction) of study units for the second cycle of NAWQA (Gilliom et al., 2000a). Based largely on this report, the USGS recently decided to reduce the total number of study units in Cycle II to 42, not including the HPGW, which is being monitored intensively for six years and is the financial equivalent of two regular study units. An analysis of how this reduction was accomplished and its implications can be found in Chapter 2 of this report.
The second and broader report of the NIT describes the design and implementation strategy for Cycle II investigations in the (now reduced in number) NAWQA study units. As noted previously, several iterations of this internal report (Gilliom et al., 2000b; see also Appendix A) were provided to the committee to assist its deliberations and ultimately helped determine (in conjunction with the statement of task) the report’s overall structure and organization.
Coordination Efforts
At all levels of the program, NAWQA benefits from information exchange and coordination activities that occur through several mechanisms (Miller and Wilber, 1999). First, each study unit is associated with and assisted by a liaison committee to help ensure that the water quality information produced by the program is relevant to regional and local interests. These liaison committees are comprised of non-USGS personnel that bring a balance of technical and management interests. Typically represented organizations include federal, state, inter-
state, and local agencies, Indian nations, and universities. At the national level, the NAWQA Advisory Committee was formed in 1991 to improve interaction between the USGS and parties with an interest in the success of the NAWQA program. The national liaison structure was changed in 1999. In 2000, the NAWQA National Liaison Committee was established to replace the dissolved NAWQA Advisory Council. Chapter 7 provides a more detailed discussion of the history and role of NAWQA’s national liaison efforts.
The USGS and NAWQA have also established liaison positions with the EPA’s Office of Ground Water and Drinking Water and Office of Pesticide Programs to provide a stronger and more timely linkage with the information needs of these two groups. Chapter 7 also describes a variety of federal, state, and local agencies and programs with which NAWQA collaborates. Finally, as described earlier in this chapter, the NRC’s Water Science and Technology Board has provided advice to the USGS four times in the past—from NAWQA’s inception to the present.
CONCLUSIONS
An initial assessment of Cycle I of NAWQA and its representative accomplishments to date finds that it has evolved into a mature and respected national program, with hundreds of publications to its credit and many significant science and policy achievements related to the quality of our nation’s ground- and surface waters for it to build upon. NAWQA has produced not only an unprecedented volume of quality data for use in the scientific community, but also unbiased information that is being used by decision makers, managers, and planners at all government levels. However, NAWQA program personnel have also worked to refine and improve existing analytical methods while simultaneously lowering their detection and reporting levels (i.e., concentrations). These efforts have also led to improvements outside the laboratory to include field sampling and processing and extraction of samples. The use of NAWQA information, and the linkages that many other organizations continually seek to make with NAWQA are an illustration of the important void that NAWQA has filled in the realm of the nation’s water quality. NAWQA is also to be commended for striving for continual improvement and, to this end, has repeatedly asked for review and critical input from various stakeholders, interest groups, and the NRC. Despite their accomplishments and impressive legacy of quality reports, NAWQA staff will be increasingly challenged to plan and execute monitoring in Cycle II because of budgetary constraints. For these reasons, NAWQA must continue to review its efficiency and cost-effectiveness; NAWQA staff will have to apply the lessons learned from their first decade of national monitoring and find new ways to operate effectively. With such continued diligence and improvement, NAWQA should be able to meet the challenges and goals that Congress and the nation have asked of it.
REFERENCES
Alexander, R. B., R. A. Smith, and G. E. Schwarz. 2000. Effects of stream channel size on the delivery of nitrogen to the Gulf of Mexico. Nature 403:758-761.
Callender, E., and P. C. Van Metre. 1997. Reservoir sediment cores show U.S. lead declines. Environmental Science and Technology 31:424a-428a.
Cuffney, T. F., M. R. Meador, S. D. Porter, and M. E. Gurtz. 1997. Distribution of Fish, Benthic Invetebrate, and Algal Communities in Relation to Physical and Chemical Conditions, Yakima River Basin, Washington, 1990. U.S. Geological Survey Water-Resources Investigations Report 96-4280. Reston, Va.: U.S. Geological Survey.
Delzer, G. C., J. S. Zogorski, T. J. Lopes, and R. L. Bosshart. 1996. Occurrence of the Gasoline Oxygenate MTBE and BTEX Compounds in Urban Stormwater in the United States, 1991-1995. U.S. Geological Survey Water-Resources Investigations Report 96-4145. Reston, Va.: U.S. Geological Survey.
Gibert, J., M. J. Dole-Olivier, P. Marmonier, and P. Vervier, P. 1990. Surface water/groundwater ecotones. Pp. 199-225 in Naiman, R. J., and H. Decamps (eds.) Ecology and Management of Aquatic-Terrestrial Ecotones. Man and the Biosphere Series. Volume 4. Paris: United Nations Educational, Scientific, and Cultural Organization.
Gilliom, R. J., W. M. Alley, and M. E. Gurtz. 1995. Design of the National Water Quality Assessment Program—Occurrence and Distribution of Water-Quality Conditions. U.S. Geological Survey Circular 1112. Sacramento, Calif.: U.S. Geological Survey.
Gilliom, R. J., D. K. Mueller, and L. H. Nowell. 1998. Methods for Comparing Water-Quality Conditions Among National Water Quality Assessment Study Units, 1992-1995. U.S. Geological Survey Open-File Report 97-589. Sacramento, Calif.: U.S. Geological Survey.
Gilliom, R. J., K. Bencala, W. Bryant, C. Couch, N. Dubrovsky, D. Helsel, I. James, W. Lapham, M. Sylvester, J. Stoner, W. Wilber, D. Wolock, and J. Zogorski. 2000a. Prioritization and Selection of Study Units for Cycle II of NAWQA. U.S. Geological Survey NAWQA Cycle II Implementation Team. Draft for internal review. Sacramento, Calif.: U.S. Geological Survey.
Gilliom, R. J., K. Bencala, W. Bryant, C. A. Couch, N. M. Dubrovsky, L. Franke, D. Helsel, I. James, W. W. Lapham, D. Mueller, J. Stoner, M. A. Sylvester, W. G. Wilber, D. M. Wolock, and J. Zogorski. 2000b. Study-Unit Design Guidelines for Cycle II of the National Water Quality Assessment (NAWQA). U.S. Geological Survey NAWQA Cycle II Implementation Team. Draft for internal review (11/22/2000). Sacramento, Calif.: U.S. Geological Survey.
Gilliom, R. J., P. A. Hamilton, and T. L. Miller. 2001. The National Water-Quality Assessment Program—Entering a New Decade of Investigations. U.S. Geological Survey Fact Sheet 071-01. Reston, Va.: U.S. Geological Survey. Available online at http://water.usgs.gov/pubs/FS/fs-071-041/pdf/fs07101.pdf.
Goodbred, S. L., R. J. Gilliom, T. S. Gross, N. P. Denslow, W. B. Bryant, and T. R. Schoeb. 1996. Reconnaissance of 17β-Estradiol, 11-Ketotestosterone, Vitellogenin, and Gonad Histopathology in Common Carp of United States Streams: Potential for Contaminant-Induced Endocrine Disrup-tion. U.S. Geological Survey Open-File Report 96-627. Sacramento, Calif.: U.S. Geological Survey.
Hinkle, S., J. Duff, F. Triska, A. Laenen, E. Gates, K. Bencala, D. Wentz, and S. Silva. 2001. Linking hyporheic flow and nitrogen cycling near a large river in the Willamette Basin, Oregon. Journal of Hydrology 244(3-4):157-180.
Hirsch, R. M., W. M. Alley, and W. G. Wilber. 1988. Concepts for a National Water-Quality Assessment Program. U.S. Geological Survey Circular 1021. Denver, Colo.: U.S. Geological Survey.
Kolpin, D. W., J. E. Barbash, and R. J. Gilliom. 1998. Occurrence of pesticides in shallow groundwater of the United States: Initial results from the National Water-Quality Assessment Program. Environmental Science and Technology 32(5):558-566.
Koterba, M. T., F. D. Wilde, and W. W. Lapham. 1995. Ground-Water Data-Collection Protocols and Procedures for the National Water-Quality Assessment Program: Collection and Documentation of Water-Quality Samples and Related Data. U.S. Geological Survey Open-File Report 95-399. Reston, Va.: U.S. Geological Survey.
Litke, D. W. 1999. Review of Phosphorus Control Measures in the United States and Their Effects on Water Quality. U.S. Geological Survey Water-Resources Investigations Report 99-400. Denver, Colo.: U.S. Geological Survey.
Lynn, W. R. 1985. Letter to D. Peck, Director, USGS. Reston, Va.
Mallard, G. E., J. T. Armbruster, R. E. Broshears, E. J. Evenson, S. N. Luoma, P. J. Phillips, and K. R. Prince. 1999. Recommendations for Cycle II of the National Water Quality Assessment (NAWQA) Program. U.S. Geological Survey NAWQA Planning Team. U.S. Geological Survey Open File Report 99-470. Reston, Va.: U.S. Geological Survey.
McMahon, P. B., and J. K. Bohlke. 1996. Denitrification and mixing in a stream-aquifer system: Effects on nitrate loading to surface water. Journal of Hydrology 186:105-128.
Miller, T. L., and W. G. Wilber. 1999. Emerging drinking water contaminants: Overview and role of the National Water Quality Assessment Program. Pp. 33-42 in Identifying Future Drinking Water Contaminants. Washington, D.C.: National Academy Press.
NRC (National Research Council). 1986. National Water Quality Monitoring and Assessment. Report on a Colloquium Sponsored by the Water Science and Technology Board, May 21-22, 1986. Washington, D.C.: National Academy Press.
NRC. 1990. A Review of the USGS National Water Quality Assessment Pilot Program. Washington, D.C.: National Academy Press.
NRC. 1994. National Water Quality Assessment Program: The Challenge of National Synthesis. Washington, D.C.: National Academy Press.
NRC. 2001. Future Roles and Opportunities for the U.S. Geological Survey. Washington, D.C.: National Academy Press.
Smith, R. A., and R. B. Alexander. 2000. Sources of nutrients in the nation’s watersheds. In Managing Nutrients and Pathogens from Animal Agriculture. Proceedings from the Natural Resource, Agriculture, and Engineering Service Conference for Nutrient Management Consultants, Extension Educators, and Producer Advisor. Camp Hill, Pa. March 28-30. Available online at http://water.usgs.gov/nawqa/sparrow/nut_sources/nut_sources.htm.
Smith, R. A., G. E. Schwarz, and R. B. Alexander. 1997. Regional interpretation of water quality monitoring data. Water Resources Research 33(12):2781-2798.
Squillace, P. J., J. S. Zogorski, W. G. Wilber, and C. V. Price. 1996. Preliminary assessment of the occurrence and possible sources of MTBE in groundwater in the United States, 1993-1994. Environmental Science and Technology 30(5):1721-1730.
Triska, F. J., V. C. Kennedy, R. J. Avanzino, G. Zellweger, and K. E. Bencala. 1989. Retention and transport of nutrients in a third-order stream in northwestern California: Hyporheic processes. Ecology 70:1893-1905.
USGS (U.S. Geological Survey). 1997. Pesticides in Surface Waters: Current Understanding of Distribution and Major Influences. U.S. Geological Survey Fact Sheet FS-039-97. Sacramento, Calif.: U.S. Geological Survey.
USGS. 1999. The Quality of Our Nation’s Waters: Nutrients and Pesticides. U.S. Geological Survey Circular 1225. Reston, Va.: U.S. Geological Survey.
Vervier, P., J. Gibert, P. Marmonier, and M. J. Dole-Olivier. 1992. A perspective on the permeability of the surface freshwater-groundwater ecotone. Journal of the North American Benthological Society 11:93-102.
Zogorski, J. S., A. Morduchowitz, A. L. Baehr, B. J. Bauman, D. L. Conrad, R. T. Drew, N. E. Korte, W. W. Lapham, J. F. Pankow, and E. R. Washington. 1997. Fuel oxygenates and water quality. Chapter 2 in Interagency Assessment of Oxygenated Fuels. Washington, D.C.: Office of Science and Technology Policy, Executive Office of the President.


