
B
Coverage Does Matter: The Value of Health Forgone by the Uninsured
Elizabeth Richardson Vigdor
In the United States, 16.5 percent of the nonelderly population lacks health insurance (Fronstin, 2002). This translates into approximately 41 million people who are exposed to the potential risks of being uninsured. This problem has not attenuated over time. In fact, the uninsured proportion of the population has been on a generally upward trend for more than 10 years (Fronstin, 2002).1 There has long been concern in the policy world about the cost to society of this phenomenon. Health insurance is a key component of access to timely and effective medical care. Without the latter, individuals may end up consuming unnecessarily costly medical care at a later date, and productivity may be adversely affected if individuals are unable to work. One factor that is often overlooked, however, is the cost of forgone health experienced by the uninsured individuals. This paper examines the loss in health capital—the imputed dollar value of health that individuals will have over their remaining lifetimes—that accrues to society from this lack of health insurance.
To measure this, I apply a variation of the methodology previously developed by Cutler and Richardson (1997) to measure “health capital,” following Grossman (1972). This measure combines several different dimensions of health to estimate the present value of the stock of present and future quality-adjusted life years. This analysis measures health capital empirically, using data on the length of life, the
prevalence of various health conditions, and the quality of life conditional on having those conditions. I estimate the average health capital of the insured and the uninsured first assuming perfect health, then incorporating morbidity. I calculate a lower-bound estimate of morbidity-adjusted health capital assuming no difference in morbidity between the two groups, and an upper-bound estimate using observed cross-sectional differences in morbidity. I then estimate the amount of health capital lost by not insuring the uninsured. I examine this under two scenarios. One assumes that everyone who is uninsured today will remain so until age 65, and another assumes that the uninsured face the average probability of being uninsured in a given year.
Using benchmark assumptions of a 3 percent discount rate and a $160,000 value of a life year, I estimate that the value of future forgone health to an uninsured 45-year-old is between $7,800 and $83,000 using the years of life (YOL) approach, and between $6,000 and $102,000 using the quality-adjusted life year (QALY) approach. The value of future forgone health to an uninsured infant is between $4,600 and $50,000 with the years of life approach, and between $3,800 and $98,000 when morbidity is incorporated. These numbers add up to an extremely large social cost. Reasonable, conservative estimates of the total cost to society of forgone health are between $250 billion and $3.3 trillion, depending on the assumptions about lifetime insurance status. If health insurance were extended to the currently uninsured population, the average gain in healthier years of life would be between $1,600 and $4,400 per additional year of coverage provided.
WHOSE HEALTH LOSS ARE WE MEASURING?
This analysis addresses the question of how much health is lost due to a lack of universal insurance coverage. Another way to frame that question is to ask how much health would be gained if we were to suddenly provide coverage to the uninsured. In order to do this, there are several steps that one must take. First, one must identify the population of interest. Second, one must determine the precise intervention to be undertaken. Many individuals transition in and out of insurance, remaining uninsured for only a short spell. Others remain uninsured for a long time. Clearly, the impact of granting universal coverage will have a very different impact on the two groups. Similarly, there is a difference between insuring someone for the rest of their life and giving them insurance for a short period of time, such as a year. Indeed, there are an infinite number of permutations for such an intervention when one considers timing, degree of coverage, cost-sharing arrangements, and so on. Next, we need to determine the differences in the underlying components of health capital that arise from being uninsured. Finally, we must calculate health capital before and after the intervention, and sum the difference over the relevant population.
TABLE B.1. Percentage of Population Uninsured by Age Category, 2000
|
|
Male |
Female |
|
Under 18 |
11.6 |
11.6 |
|
18–24 |
30.1 |
24.4 |
|
25–34 |
23.9 |
18.9 |
|
35–44 |
16.9 |
14.3 |
|
45–54 |
12.0 |
12.1 |
|
55–64 |
12.0 |
15.2 |
|
SOURCE: Fronstin, 2001b. |
||
Identifying the Population
The population comprises the uninsured from ages 0 to 64 in 2000 as estimated by the March Current Population Survey (CPS) (Fronstin, 2001b). The March CPS health insurance questions refer back to the previous year. If people are answering the questions correctly, the Fronstin estimates represent people who were uninsured for the whole year.2 The percentage of the population without health insurance by age category is presented in Table B.1. Men are more likely to be uninsured than women until about age 45, at which point women have a higher likelihood of lacking insurance. For both men and women, one is most likely to be uninsured between ages 18 and 24. Nearly 30 percent of men and a quarter of women in this age group did not have health insurance in 2000.
I use the estimates from Fronstin to determine the size and age distribution of the population of interest, multiplying the proportion of individuals without insurance at a given age by the sex- and year of age-specific population for 2000 (CPS, 2001). I assume that the age-group probability of being uninsured applies to the midpoint of the age range, and extrapolate linearly for individual years within categories.3 The comparison group of interest is individuals with private health insurance coverage.
Determining the Intervention
This analysis assumes that the intervention is to provide lifetime health insurance to each uninsured person at a given age. That is, the individual will be covered from his or her current age until age 65, at which time Medicare coverage
begins. Because not all insurance plans are alike, the actual impact on health is likely to vary with the design of the particular plan. Without the detailed data to construct health capital measures that vary by plan feature, the effective comparison is that uninsured individuals have the “average” private health plan.
In order to determine accurately the impact of the intervention of providing health insurance, one needs to know the counterfactual. This is problematic because of great heterogeneity in the duration and frequency of spells without insurance. Some people are uninsured for only a short period of time, and others lack coverage more often than not (IOM, 2001a; Short, 2001). Not surprisingly, the impact on health is greater for those who are uninsured for longer periods of time (Ayanian et al., 2000; Kasper et al., 2000). Although there is a fairly large literature that examines duration and frequency of periods without coverage,4 there is not enough information to map out expected patterns of insurance over a lifetime and incorporate the differential effect of duration of uninsurance on health outcomes.5
Given the practical need to make some generalizing assumptions, I will measure the difference in health between the insured and uninsured under two scenarios. In the first, the counterfactual is that the individual would have otherwise remained uninsured until age 65, at which point Medicare coverage would begin. In the second, I assume that being uninsured in time t is independent of the probability of being uninsured in period t + 1. Thus the counterfactual for the individual receiving the intervention is that his expected health in the year occurring at age a is pr(uninsureda) *Hunins + (1 – pr(uninsureda)) *Hins, where pr(uninsured) is the proportion uninsured at age a. This assumes that the overall rate of insurance at a particular age will remain constant over time.
Reality probably lies somewhere in between these two scenarios. Few individuals will actually remain uninsured until age 65 in the absence of the intervention. Many will eventually obtain private or public insurance coverage and realize health benefits from doing so. Therefore this approach will overestimate the impact of providing lifetime insurance, assuming that there are health gains to be made that in fact have already occurred as people transition back into the insured state. On the other hand, insurance status is not a random draw every year. The latter scenario captures the fact that the probability of being without health insurance is not constant across the lifespan. It does not, however, account for any difference in the probability of being uninsured in the future conditional on being uninsured now. It also ignores any residual effects on health of being uninsured in the previous period. If the effect of insurance status were instantaneous and non-persistent, this method would accurately capture the average difference in health capital by insurance status. However, if being uninsured now increases the prob-
ability of being uninsured in the future and the length of uninsured spell has an adverse impact on health outcomes, this scenario will lead to an underestimate of the benefit from providing health insurance. Furthermore, if rates of uninsurance continue on an upward trend, this scenario will provide a conservative estimate of the gains from providing insurance.6
I compute health capital under three sets of assumptions, which will be described. I calculate each set of estimates for the two alternative insurance scenarios. Because one approach will overestimate the health gains from insurance and the other will underestimate these gains, we can use the results from each scenario to bracket the actual effect we would expect to see under each set of assumptions.
HEALTH CAPITAL: A FRAMEWORK FOR MEASURING HEALTH
We are interested in measuring the gains in health from insuring the uninsured. But “health” has many dimensions, and is a difficult concept to define and measure. One component of health is generally straightforward: Is the person alive? Health has other physical and mental attributes as well. Is the person in pain? Does the person need help caring for herself, or is she unable to work or otherwise function normally? Is the person happy and well adjusted? We need to combine all of these elements into a single measure of health.
One approach combines these elements into a measure of quality-adjusted life. In previous work, we employed such a methodology to measure changes in the health of the U.S. population over time (Cutler and Richardson, 1997). Consider H(a) to be an individual’s health at age a. Because health has no natural units, we can scale H however we want. Suppose we scale H from 0 to 1, where 0 is death and 1 is perfect health. Any diseases or impairments the person has will reduce his quality of life so that it falls somewhere in the 0 to 1 range. This definition of H is frequently referred to as a health-related quality of life (HRQL) weight (Gold et al., 1996a). A year in a health state with a particular HRQL weight is referred to as a “quality-adjusted life year,” or QALY (Zeckhauser and Shepard, 1976). Because a dead person has H = 0, expected health is simply Pr[alive at a]*Q(a) where Q(a) is the average quality of life among those who are alive at that age.
We then defined health capital as the utility7 resulting from the stock of current and future quality-adjusted life years:

where r is the discount rate and V is the marginal rate of substitution between health and other goods and services. Because health is measured in life years, V is the value of an additional year in perfect health. The bracketed term in the above equation is simply the discounted value of the expected number of QALYs that a person has remaining at age a.
Health capital can be thought of as analogous to human capital, a concept frequently used in labor economics. Human capital is the present value of the income one can expect to receive over the course of one’s life as a function of educational attainment. Having a better education allows a person to earn more in the future. Similarly, having more health makes a person happier (and possibly more productive). Health capital is the present value of the utility resulting from a person’s health.
For this paper, we are interested in finding the difference between the health capital of an insured person and an uninsured person at age a, and summing these differences over the current population of the uninsured. Note that in theory we want to isolate the difference in average health capital that is caused by lack of insurance, and not differences that arise as a result of different distributions of underlying characteristics, such as gender or income. In other words, we want to hold constant individual and environmental factors, and change only the variables that are affected by insurance coverage.
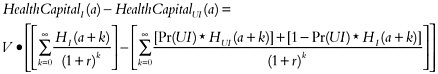
The change in health capital can be decomposed into two terms: the change in the present value of the number of quality-adjusted life years times the dollar value of those life years. We are making two different assumptions about future insurance status without the intervention. In the first case, we are assuming that an uninsured person would have remained in that state until he or she reaches age 65. For a person at age a, the difference in health capital is:

In the second case, we are assuming that the uninsured person has a probability less than 1 of being uninsured at any given year in the future. In that case the difference in health coverage from the intervention is:8
The Discount Rate
Which discount rate to use is a longstanding issue in economics. The appro-priate discount rate is the one that trades off utility across different years. Although market interest rates are often very high, these are discount rates for dollars rather than utility. Interest rates will be higher than the discount rate for utility for a number of reasons, including taxes and risk. I use a range of discount rates that are in line with the range considered appropriate in the health literature (Lipscomb et al., 1996): 0 percent, 3 percent, and 6 percent. The benchmark assumption is a discount rate of 3 percent.
The Value of a Life Year
In addition to measuring years of life, we need to value them in dollars. The value of a human life or a quality-adjusted life year is a subject of much debate.9 Although there is an extensive literature on the value of life, remarkably little work has been done to date on the value of a life year. This is true despite the fact that QALYs are frequently used as an outcome measure in cost-effectiveness analyses of medical technologies and health care programs.
One reason QALYs have become so widespread in the literature is almost certainly the appeal of being able to compare options without putting a dollar value on health. The problem with this, of course, is that it does not fully solve the problem of how to allocate resources efficiently (Johannesson and Jonsson, 1991). What is frequently done in evaluation studies is to compare the cost per QALY to commonly used medical technologies and draw a conclusion relative to accepted practice (Mason et al., 1993). One widely used benchmark (Tolley et al., 1994) set forth by Kaplan and Bush (1982) is that a policy is cost-effective if the cost per QALY is less than $34,000, updated to 1999 dollars, which is not always done
when used as a benchmark (Hirth et al., 2000), and questionable if it is greater than $238,000 (1999 dollars). The area in between was deemed controversial, but acceptable by the standards of currently employed technologies. Another commonly used benchmark of acceptability is $40,000 (Bala and Zarkin, 2000). Of course, using a benchmark value for determining what is “cost-effective” is implicitly assigning a value to a life year, albeit a range of acceptable values. However, these and other benchmarks are quite arbitrary, and there is no evidence that they represent societal willingness to pay for a life year (Hirth et al., 2000; Johannesson and Meltzer, 1998).
From a welfare economics perspective, the theoretically correct way to determine whether a policy should be adopted is to compare the total benefit that would accrue to society from the policy with the total cost to society of implementing the policy (Mishan, 1972). If an individual will receive a total benefit of X from the consumption of a good, it follows that he will be willing to pay a maximum of X to obtain that good. Therefore to value the social benefit from health outcomes such as QALYs, one would need to sum each individual’s willingness to pay for the QALYs gained by them and by others (i.e., any external effects that someone else’s improved health might have on a particular individual). With market-produced goods, the consumer’s maximum willingness to pay is the area under the demand curve for the units consumed. It is difficult enough to construct a demand curve when a market exists, but for most health outcomes there is no direct market. Thus the challenge is to determine the maximum willingness to pay for these health outcomes. In this exercise, we need to determine willingness to pay for an individual year of life.
One way to determine societal willingness to pay for a life year is to impute it from the value of a life literature. The bulk of this literature uses one of three approaches to measuring the value of life: the human capital method, revealed preference, and contingent valuation. The human capital approach (e.g., Rice and Cooper, 1967) uses the labor market to estimate the value of life. A life is worth the sum of expected future earnings. Although it is relatively easy to measure, principal limitations of this approach are as follows: indirect costs will be zero for individuals not participating in the labor market, such as retirees, homemakers, or children; it fails to consider any disutility from illness over and above forgone earnings; and it does not allow for altruism (Mishan, 1971). Furthermore, people value leisure time as well as time spent in the labor force. Keeler (2001) shows that if the average worker places the same value on leisure time and time spent in the labor force, the value of his life is 5 to 10 times the value of future earnings.10 Thus the human capital method does not capture an individual’s full willingness to pay and is likely to underestimate social benefits.
An alternative approach is to measure willingness to pay for reduction in health risks through revealed preference. By observing individuals’ behavior in existing markets, we can evaluate willingness to pay indirectly for features such as automobile safety or lower risk of mortality on the job. A great deal of work has been done in examining compensating wage differentials to estimate willingness to pay for lower risk of fatal and nonfatal injury in the labor market (see Viscusi, 1993, for a review). Consumer market studies have also examined implied willingness to pay for reduced morbidity and mortality risk through the purchase of products such as smoke detectors (Dardis, 1980).
Because the consumer market studies are limited, much of what is known about the value of a statistical life comes from the labor market literature. However, this is problematic in that it represents a subset of society—primarily workers in blue-collar jobs. How much these results can be generalized to the overall population is unknown. These studies also assume unlimited job mobility, which may not be the case for workers in low-paying jobs (Lanoie et al., 1995). Furthermore, both labor and consumer market studies suffer from possible omitted variable bias due to the inherent difficulty in identifying other job or product amenities that may be highly correlated with lower risk jobs or products (Viscusi, 1993; Gerking et al., 1988). For example, someone who buys a smoke detector is not simply purchasing a reduction in the risk of death, but also a decreased chance of injury, property damage, and psychological harm. All of these elements have value, making it difficult to isolate the actual value of a life. Finally, many health interventions that need to be valued are not traded even in an implicit market (Viscusi, 1993).
The approach that is most consistent with the theoretical foundations of costbenefit analysis is to measure willingness to pay through contingent valuation (CV) (Diener et al., 1998; O’Brien and Gafni, 1996). CV is a survey-based methodology for eliciting consumers’ willingness to pay for benefits from a particular policy, usually expressed as a small change in risk. The advantage of this approach is that it directly elicits total willingness to pay for a benefit, which is precisely the theoretically desirable measure. CV studies can be conducted from different perspectives, which determine how the results are interpreted. A societal perspective asks all individuals affected by a policy about their willingness to pay for that policy. This gives the total societal benefit of the policy. On the other hand, asking an individual how much she is willing to pay for a reduction in personal risk provides that individual’s valuation of her life, but theoretically will not capture any impact of this change on others.
Developed originally in environmental economics, CV is now a widely accepted tool for assessing the benefits of environmental programs (Mitchell and Carson, 1989). In the health field, CV studies have been conducted to measure a wide range of benefits, including blood donation (Lee et al., 1998; Eastaugh, 1991), arthritis treatment (Thompson et al., 1984; Blumenschein and Johannesson, 1998; Thompson, 1986), in-vitro fertilization (Neumann and Johannesson, 1994), and hypertension therapy (Johannesson and Jonsson, 1991).
Although CV provides a direct and theoretically appealing way to measure willingness to pay for a risk reduction, it can be difficult to implement in practice. It suffers from all the standard limitations of survey questions, such as anchoring, framing, and interviewer bias. In addition there may be concern about the validity of people’s responses to questions that have no real implications for their lives. There is also the issue of whose willingness to pay should be considered in an analysis. For example, do we survey only those directly affected or a representative sample of the whole population, because some people may have an altruistic interest in a policy? These issues are real, but much can be done to address them. For example, O’Brien and Gafni (1996) have set forth a valuable conceptual framework for contingent valuation studies in the health field. Among their recommendations are that (1) the entire population (or a representative sample) be surveyed; (2) an ex-ante insurance framework be utilized; and (3) the question be framed as a tax referendum or some other type of compulsory payment scheme.
One criticism of both the human capital and contingent valuation methods is that they value individuals with low income or wealth less than those with high income or wealth. Indeed, how one “should” value a life year within a lifetime or across individuals is a controversial and extremely subjective subject. A good illustration of the inherent challenges is the administration of the Victim’s Compensation Fund established for victims of the September 11 attacks. The grand master of the fund, Kenneth Feinberg, was directed by Congress to consider the economic loss to a victim’s family in making awards. Recent articles in the popular press have documented his controversial attempt to balance the lost economic potential of each victim with some degree of equity—for example, by capping awards (Kolbert, 2002; Belkin, 2002).
Aside from an individual’s valuation of her own life, there are other reasons why the value of a year of perfect health might vary across people. Society has invested more in some people than in others, and some contribute more back to society than others. Thus, one might vary the value of a life year with the amount that one contributes to society or that society has invested in a person. This is essentially the approach taken in the literature on disability-adjusted life years. In that methodology, it is assumed that society values young adults more than children or older adults, but there is no variation by other factors such as income or the number of dependents an individual is supporting.11
The type of weights to use, let alone the values to employ, are questions about the social welfare function. Because there is not a standard social welfare function, the choice of weights in this context does not have clear theoretical rationale. In this paper, as in previous work, I do not vary the value of a life across people, age, or time. This assumes that society values a healthy year of life the
same for everyone, at any point in their life. Another way to think of this is that it defines the social value of a life year to be the average of all individual values.12 If as a society we value equity, this is a perfectly reasonable assumption.
In previous work, we used $100,000 as the value of a life year (Cutler and Richardson, 1997). This value came from a brief synthesis of the literature done by Tolley et al. (1994), which concluded that a range of $70,000 to $175,000 per life year is reasonable. A subsequent study by Hirth and colleagues (2000), however, reviewed the value-of-life literature more thoroughly and with the express purpose of determining the value of a QALY. Hirth and colleagues identified 42 studies that used one of the three valuation methods described earlier and were appropriate for inclusion in their analysis. To estimate the value of a QALY from this literature, they first converted all the values to 1997 dollars and determined the average remaining life expectancy of the sample population. If age was not reported in the study, they assumed an average age of 40, with a sensitivity analysis ranging from 35 to 45. They then applied age-specific HRQL weights from the literature and assumed a 3 percent discount rate (with sensitivity analysis using 0, 5, and 7 percent).
Not surprisingly, Hirth and colleagues found that the median value of a life year varied tremendously. Not only were there large differences based on the methodology used, but within methods values also varied greatly. They found that the median value per life year was approximately:
-
$25,000 in the human capital studies;
-
$93,000 in the revealed preference for safety studies;
-
$161,000 in the contingent valuation studies; and
-
$428,000 in the revealed preference for job safety studies.
The authors presented their sensitivity analysis in terms of the percentage change to the life year value of the relevant studies; for example, changing the assumption about the average age from 40 to 35 lowered the value per life year in those studies by 7 percent. I recalculated the median value per life year for each methodology, incorporating the high and low ends of the range of estimates they tested for the discount rate and the average age of the population (when it was assumed). These numbers, along with their benchmark median values, are presented in Table B.2. Under the assumption of no discounting and an average study age of 35, the value per life year ranges from $14,000 for the human capital approach to $256,000 for the revealed-preference-for-job-risk method. Under the looser assumptions of 7 percent discounting and an average study age of 45, the
TABLE B.2 Estimates of the Value of a Life Year
|
Median Estimate |
Human Capital |
Revealed Preference: |
Contingent Valuation |
|
|
Job Risk |
Safety |
|
||
|
3% discount rate (3% discount rate, average age 40) |
$24,777 |
$428,286 |
$93,402 |
$161,305 |
|
Low assumptions (0% discount rate, average age 35) |
$14,142 |
$255,718 |
$54,123 |
$85,492 |
|
High assumptions (7% discount rate, average age 45) |
$40,710 |
$685,258 |
$151,909 |
$272,605 |
|
SOURCE: Author’s calculations from Hirth et al. (2000), 1997 dollars. |
||||
human capital method yields a value per life year of $41,000, while the revealed-preference-for-job-risk studies have a median value of $685,000 per life year.
As discussed earlier, I believe that the contingent valuation is the theoretically correct methodology for valuing life and health changes and use a benchmark value of $160,000 for a year in perfect health.13 Assuming a 3 percent discount rate and a life expectancy at birth of 76 years, this translates into a value of $4.8 million for a life. This is in line with Viscusi’s (1993) conclusion that reasonable value of life estimates using any approach are clustered in the $3 to $7 million dollar range.14 For comparison, U.S. government agencies use a range of values for a life, with most falling within Viscusi’s spectrum. For example, the Environmental Protection Agency recommends a baseline estimate of $6.1 million (in 1999 dollars) for benefit calculations (USEPA, 2000); the Department of Transportation (which includes the Federal Aviation Administration) recommends a value of $3 million for all its economic evaluations (U.S. Department of Transportation, 2002)15 ; and the Food and Drug Administration and Consumer Product Safety Commission use a value of $5 million (U.S. Department of Transportation, 2002).
MEASURING THE CHANGE IN HEALTH CAPITAL EMPIRICALLY: YEARS OF LIFE APPROACH
To measure health capital empirically for the insured and the uninsured, we must measure expected quality-adjusted life years for each group over a lifetime, value those years in monetary terms, and discount them to the present. A simple way to start is to dichotomize the quality-adjusted life year variable H. In this scenario there are only two values of H: 1 for someone who is alive, and 0 for someone who is dead. When the discount rate is 0, the last term in the health capital equation is simply the standard measure of life expectancy conditional on reaching age a.
Determining the probability of survival in a given year is relatively straightforward. I start with the 1999 period life table generated by the Social Security Administration (SSA). The SSA life tables are available for men and women. However, we need separate life tables by insurance status. To construct these, I use data on mortality differences by insurance status. The Committee’s earlier report, Care Without Coverage: Too Little, Too Late (IOM, 2002a), presented a systematic review of the literature on health outcomes as a function of insurance status, and concluded that individuals without insurance experience a 25 percent higher mortality risk in future years than individuals with insurance. This conclusion is based primarily on two long-term longitudinal studies. The first study, by Franks and colleagues (1993), followed a cohort of adults for 13 to 17 years. Those that were uninsured at baseline had cumulative mortality throughout the follow-up period that was approximately 25 percent higher than those who were privately insured at baseline (with a 95 percent confidence interval ranging from 0 to 55 percent). The second study, by Sorlie and colleagues (1994), followed a large sample of adults over a 2- to 5-year period and found mortality rates were 20 to 50 percent higher for those uninsured at baseline, depending on sex and race (with 95 percent confidence intervals ranging from about 0 to more than 200 percent).
Since the confidence intervals around the mortality estimates in these two studies are wide, it is possible that the true impact of insurance on mortality is substantially greater or less than 25 percent. Furthermore, if the uninsured differ systematically from the insured along unmeasured dimensions that are associated with higher or lower mortality, then these studies will overestimate or underestimate the impact of insurance, respectively. Theoretically, it is not clear which way this bias will go. On one hand, people may opt out of insurance because they are relatively healthy and believe they do not need coverage; on the other hand, people may lose their health insurance as a result of being sick.
Evidence from two studies that explicitly try to control for unobserved heterogeneity suggests that there is some causal effect of insurance status on mortality. A recent study by Doyle (2001) uses severe automobile accidents to examine treatment patterns by insurance status. Controlling for patient, crash, and hospital characteristics, he found that the uninsured receive 20 percent less treatment and have a 37 percent higher risk of mortality. The RAND Health Insurance Experi-
ment, which placed individuals randomly into different categories of cost sharing for health insurance, found that high-risk individuals with very high cost sharing had a 10 percent higher risk of dying than those with free care. This effect came entirely through the adverse effect of cost sharing on high blood pressure (Newhouse et al., 1993).
Several studies have also documented higher rates of infant mortality among the uninsured (Foster et al., 1992; Moss and Carver, 1998; Currie and Gruber, 1996; Howell, 2001). However, the evidence is mixed on the effectiveness of interventions designed to provide insurance to pregnant women or improve access to prenatal care, suggesting that other factors may account for the difference. Studies of individual states have found effects of various programs ranging from zero (Piper et al, 1990; Coulam et al., 1995) to declines of more than 30 percent (Foster et al., 1992). Two national studies of Medicaid expansions have also found contradictory results. Currie and Gruber (1996) found that infant mortality dropped by 8.5 percent following coverage expansions to pregnant women. However, Howell (2001) finds no significant difference in infant mortality among unmarried mothers. She argues that the differences can be explained by better hospital resources overall, rather than better access to prenatal or postnatal care.16
To incorporate mortality into the life tables, I assume that the cumulative risk of mortality is 25 percent higher for the uninsured of both sexes from age 1 until age 65.17 Because of the uncertainty in the literature about the causes of the infant mortality differential, I make the conservative assumption that there is no difference in infant mortality by insurance status. At age 65, I assume that the annual mortality rate equalizes (and thus the cumulative risk difference declines). The implication of this is that life expectancy conditional on reaching age 65 or any older age is the same for the two groups, although fewer of the uninsured will have lived to that age.
In fact it seems likely that differences in the annual mortality rates persist even after Medicare coverage begins. Individuals who enter Medicare from an uninsured state are more likely to have conditions that have not been treated appropriately (or at all, particularly in the case of diseases that are diagnosed late as a result). Therefore, we would expect a lag before any realization of health status improvements. Although I do not have the data necessary to model such a process in this paper, this omission will bias downward the estimate of the gap in mortality. In other words, this analysis overestimates the extent to which the life expectancy
gap narrows at age 65 without any intervention, and thus underestimates the potential gains to be made from giving insurance to the uninsured. If in fact the uninsured continue to experience higher mortality upon entering Medicare, and if the mortality estimates are not picking up any unobserved factors correlated with higher mortality for the uninsured, then the life expectancy differences presented here are too low.
Table B.3 presents life expectancy conditional on reaching selected ages, by sex and insurance status. The first column is the comparison group, individuals who have private insurance coverage from age a until they reach 65. The next two columns represent the two sets of assumptions about coverage in the absence of the intervention. The second column is life expectancy for individuals who have no insurance coverage until they reach age 65. The third column assumes that for each year in the future, the individual faces the average probability of being uninsured. That is, the expected annual mortality rate at age a is pr(insa)* pr(death|insureda) + (1 – pr(insa))*pr(death|uninsureda). Recall that these are conditional estimates; current year mortality depends only on current insurance status and everyone is assumed to have Medicare coverage at age 65. Thus life expectancy conditional on surviving to age 65 is the same for all groups.
TABLE B.3 Conditional Life Expectancy by Insurance Status
|
|
Insured Until 65 |
Uninsured Until 65 |
Average pr(Ins) Until 65 |
|
Men |
|||
|
Years of life remaining at age: |
|
||
|
0 |
73.2 |
71.5 |
73.0 |
|
18 |
56.1 |
54.6 |
55.9 |
|
25 |
49.6 |
48.2 |
49.4 |
|
35 |
40.2 |
39.0 |
40.1 |
|
45 |
31.1 |
30.1 |
31.0 |
|
55 |
22.5 |
21.8 |
22.5 |
|
65 |
15.0 |
15.0 |
15.0 |
|
Women |
|||
|
Years of life remaining at age: |
|
||
|
0 |
78.6 |
77.5 |
78.5 |
|
18 |
61.4 |
60.4 |
61.2 |
|
25 |
54.5 |
53.6 |
54.4 |
|
35 |
44.9 |
44.0 |
44.7 |
|
45 |
35.4 |
34.7 |
35.3 |
|
55 |
26.4 |
25.9 |
26.3 |
|
65 |
18.1 |
18.1 |
18.1 |
A newborn boy with no insurance coverage until he is age 65 can expect to live 1.7 fewer years than his counterpart with continuous private insurance coverage. A newborn boy facing the average annual probability of being uninsured only loses 0.3 life year relative to a boy with lifetime private insurance coverage. For both groups the gap narrows with age. By age 55, a male who will remain uninsured for the next 10 years and then be covered under Medicare can expect 0.7 fewer years of future life than someone who will remain privately insured until age 65, while a male with an average chance of insurance from age 55 to 65 loses 0.1 life year. For females, the amount of life expectancy lost is lower: 1.1 and 0.2 years for newborns in the continuously uninsured and average probability groups, respectively. As with males, the gap narrows with age.
Converting these life expectancy numbers into health capital under this approach simply requires multiplying by the value of a life year and discounting. Table B.4 shows the health capital estimates by insurance status and sex at certain ages using the years of life approach, and the differences in health capital between the comparison group and the two groups who lack coverage. For all groups, health capital is large, between $4.6 and $4.7 million at birth, and around $2 million for someone age 65. Women have higher health capital than men at all ages, simply reflecting the higher life expectancy for women.
In contrast, the difference in health capital between a continuously insured individual and someone who is uninsured for all or part of her life seems relatively small. Recall that we can think of the two counterfactuals as bracketing the true difference in health capital between the insured and the uninsured. For a newborn, the difference in health capital ranges from $5,000 to $50,000. The difference is greatest in the mid-forties, ranging from $8,000 to $83,000. The difference peaks at this age because the annual relative mortality risk is increasing as one gets older. At younger ages, the discounting places less weight on this higher mortality risk in the future. For the people facing the average probability of being uninsured, the peak is not as dramatic; in fact, it is barely perceptible in Table B.4. This is because the increasing annual mortality risk for the uninsured is offset by the fact that one is much less likely to be uninsured at age 45 than at ages 18 to 34.
Are these differences large or small? Relative to the level of health capital, they are small. However, the present value of lifetime earnings for a newborn who works from ages 18 to 64 and earns the 2001 mean annual income of $32,000 (CPS, 2001) is just under $500,000. Thus the value of lost health from being uninsured is equal to between 1 and 10 percent of expected lifetime earnings for an infant, which seems considerably less trivial.
Naturally the differences in health capital vary with the discount rate used. The first two columns of Table B.5A show the differences using discount rates of 0 and 6 percent under this scenario. With no discounting, an uninsured infant has between $27,000 and $270,000 less health capital than an insured infant. The magnitude of the difference declines with age because remaining life expectancy also declines with age. Using a 6 percent discount rate, an insured infant has between $1,000 and $14,000 more health capital than an uninsured infant. As with
TABLE B.4 Health Capital by Insurance Status, Sex, and Age: Years of Life Approach
|
|
Health Capital Levels and Differences (thousands of dollars) |
Benefit per Year of Insurance (dollars) |
|||||
|
(1) |
(2) |
(3) |
|
||||
|
Insured Until 65 |
Uninsured Until 65 |
Average pr(Ins) Until 65 |
Difference (1)–(2) |
Difference (1)–(3) |
Uninsured Until 65 |
Average pr(Ins) Until 65 |
|
|
Men |
|||||||
|
0 |
4,617 |
4,567 |
4,609 |
50 |
8 |
1,752 |
1,408 |
|
18 |
4,205 |
4,141 |
4,194 |
64 |
11 |
2,568 |
1,841 |
|
25 |
3,983 |
3,914 |
3,972 |
69 |
11 |
3,039 |
2,197 |
|
35 |
3,583 |
3,504 |
3,572 |
78 |
11 |
4,069 |
2,952 |
|
45 |
3,077 |
2,994 |
3,067 |
83 |
10 |
5,691 |
3,872 |
|
55 |
2,473 |
2,404 |
2,465 |
69 |
8 |
8,244 |
4,466 |
|
65 |
1,811 |
1,811 |
1,811 |
|
|||
|
Women |
|||||||
|
0 |
4,733 |
4,701 |
4,728 |
32 |
5 |
1,108 |
893 |
|
18 |
4,382 |
4,345 |
4,377 |
37 |
6 |
1,474 |
1,120 |
|
25 |
4,178 |
4,136 |
4,172 |
42 |
6 |
1,818 |
1,427 |
|
35 |
3,811 |
3,762 |
3,804 |
50 |
7 |
2,530 |
2,009 |
|
45 |
3,345 |
3,291 |
3,337 |
53 |
8 |
3,576 |
2,661 |
|
55 |
2,768 |
2,723 |
2,761 |
45 |
7 |
5,285 |
3,267 |
|
65 |
2,110 |
2,110 |
2,110 |
|
|||
|
NOTE: Calculations assume a value of a life year of $160,000 and a real discount rate of 3 percent. Benefit per year of insuran ce is calculated by dividing the gain in health capital by the discounted years of insurance coverage provided (sees Tables B.5A, B.5B). |
|||||||
TABLE B.5A Differences in Health Capital by Discount Rate, YOL Approach (thousands of dollars)
the 3 percent discount rate, the differences actually increase with age as the mortality differentials become more imminent. At age 55, the difference in health capital between the insured and the uninsured ranges from $4,000 to $45,000.
A useful way to think about the gain in health capital from insurance is to compare it with the additional years of health insurance that we are providing to obtain this benefit.18 For an individual at age a, this is the total number of years that she can expect to be uninsured for the rest of her life, discounted to make it comparable to our baseline estimates.19 This can be written as:
Under the scenario assuming a counterfactual of no insurance prior to Medicare, pr(uninsured) is equal to one before age 65, so the estimate is simply the discounted years of expected life between now and age 65. Table B.6 shows the discounted years of insurance coverage provided at different ages under the two
TABLE B.5B Differences in Health Capital by Discount Rate, QALY Approach (thousands of dollars)
TABLE B.6 Discounted Years of Insurance Provided Under Different Scenarios
scenarios, discounted at 3 percent. It would require 28.4 years of insurance in present-value terms to insure a newborn boy who otherwise would be uninsured until age 65, and 28.8 years of insurance to do the same for a newborn girl. For newborns facing the average probability of being uninsured in each year up to age 65, it would take 5.5 years of insurance for a boy and 5.1 for a girl.
The last two columns of Table B.4 show the gain in health capital per year of health insurance provided for various ages, using the years of life approach. For a 25-year-old male, the gain in health capital for each year of insurance is $2,200 under the average probability of insurance scenario, and $3,000 under the continually uninsured scenario. For a 25-year-old female, the corresponding estimates are $1,400 and $1,800, respectively. Because we are now normalizing the change in health capital by the amount of time one otherwise would have been uninsured, the ratios are much closer than the raw differences under the two insurance scenarios. They are still quite different, however, due to the uneven distribution of mortality and insurance status over the lifespan. Specifically, there are large health benefits from being insured later in life when overall levels of mortality are higher. Yet the probability of being uninsured at this stage is much lower than at younger, healthier ages. Therefore we would expect lower estimates from the scenario that assigns a much lower probability to receiving these health benefits later in life.
Not surprisingly, the benefit per year of insurance increases substantially with age. This is true because mortality rates are larger at older ages, and therefore gains from a reduction in mortality are larger as well. The estimates for younger uninsured individuals are lowered by the years in which insurance coverage is provided, but mortality simply is not very high. Furthermore, the gains that these individuals will receive in the future take on smaller weight due to the discounting. For older people, these gains are closer and therefore the discount factor has a smaller effect. The health gains for women remain quite a bit smaller than for men, even when controlling for the fact that women are more likely to be insured. Again, this is because women have lower overall mortality, so a proportional reduction in the mortality rate simply will not have as large an impact as it will for the men.
MEASURING THE CHANGE IN HEALTH CAPITAL EMPIRICALLY: THE QALY APPROACH
The next step is to incorporate morbidity into our estimates. To compare the difference in morbidity-adjusted health capital that arises from a lack of insurance, we need to calculate the expected differences in disease presence and quality of life by insurance status. Several factors make this very difficult. First, the uninsured have different characteristics than the insured. If we observe in the population that the uninsured are more likely to have diabetes, for example, this might simply be explained by the fact that the uninsured are more likely to be male, and men report a higher prevalence of diabetes. Even if we control for a variety of characteristics, however, it is not necessarily the case that equalizing insurance status will eliminate the remaining difference in health capital. One reason for this is that we might expect some of the adverse effects of going without coverage to persist or have long-term implications. If someone with diabetes receives inadequate treatment because she lacks insurance, she may have a higher risk of developing complications later on, even after she starts receiving appropriate care. Unfortunately this is extremely complicated to model and we lack sufficient data to do so. Another reason we would not expect to eliminate the entire difference in health capital by insuring the uninsured is that there may be factors correlated with lack of insurance and worse health outcomes that are difficult or impossible to measure, such as an aversion to doctors. Therefore, if we assume that the entire health capital differential will vanish once an individual receives insurance coverage, we will overestimate the true impact of the intervention.
The issue of selection bias makes it impossible to draw inferences about causality when comparing the health of the insured and the uninsured in the crosssection. Theoretically, the direction of any measurable difference in health by insurance status is unclear. On one hand, we might expect the uninsured to have more chronic conditions due to a lack of adequate prevention (e.g., more untreated hypertension leading to more heart disease). On the other hand, they may have a lower rate of reported prevalence at a given age if diagnosis occurs at a later
stage of the disease (e.g., cancer). The uninsured may also have a lower prevalence of disease if they are more likely to die; we may observe less cancer in the uninsured at older ages because most of them (and perhaps the sickest) have already died from heart disease. Finally, we may see a difference in health status because of adverse selection and “cream skimming.” In the first case, we would expect to see better health in the uninsured if individuals choose not to buy insurance because they are healthier and do not need it. In the latter case, patients with chronic disease who lose their insurance may subsequently be unable to find affordable coverage, and we will observe worse health. Which of these effects will dominate in practice is an empirical question. However, the conclusion of the Committee (IOM, 2002a) is that overall, the uninsured suffer worse health outcomes than the insured.
Literature on the Impact of Lacking Coverage on Health
A reasonable approach toward estimating the difference in health capital caused by a lack of insurance coverage would be to examine the literature and incorporate information from well-designed studies that control for selection bias. Care Without Coverage (IOM, 2002a) thoroughly evaluated and synthesized the literature on this topic. The report concludes that being uninsured leads to increased mortality, lower health status, less appropriate medical care, and lower rates of screening for many conditions.
Despite the overwhelming evidence that being uninsured is not good for overall health or access to care, however, the literature that specifically addresses the components of health capital is relatively sparse. In particular, there are few high-quality studies that examine differences in the incidence or prevalence of disease by insurance status, or differences in quality of life for a particular disease or condition. Many of the disease-specific studies focus on outcomes such as treatment patterns, utilization of services, and timely access to medical care. These types of outcomes are important for understanding the problems faced by the uninsured, but they are not the final outcome of interest here. Rather, they are the mechanisms through which health might be adversely affected. The magnitude of the effect of these particular mechanisms on quality of life, functional status, and disease prevalence are rarely measured.
One outcome that is often examined in disease-specific studies is mortality. For some diseases, such as cancer, the increased mortality the uninsured face due to later diagnosis provides clear evidence that the uninsured suffer worse health outcomes (see Roetzheim et al., 1999; Ayanian et al., 1993; Lee-Feldstein et al., 2000, among others). This is something we could easily incorporate into our measure of health capital. However, in practice the usefulness of these studies is diminished by several studies that examine overall mortality differences between the uninsured and those with coverage. Because the studies that measure total mortality should in theory incorporate all the mortality differences documented in
the disease-specific measures, disease-specific mortality is not needed to conduct this analysis.
There are outcomes studies that we could incorporate into measures of health capital. For example, blood pressure levels increase when hypertensive patients lose coverage (Lurie et al., 1984; Lurie et al., 1986) and vice versa (Keeler et al., 1985). Diabetics without insurance are less likely to receive appropriate monitoring and care, putting them at higher risk for serious complications (Palta et al., 1997; Beckles et al., 1998; Ayanian et al., 2000). This information could be used to simulate an expected disease path. For example, we could determine from the literature the increased probability over one’s lifetime of a cardiac event from higher blood pressure or the increased probability of future blindness from untreated diabetes. Given the limitations of the literature, however, there are relatively few diseases for which this could be done, and for many diseases the population effects would be small. This would be a very complicated exercise for an estimate that would by necessity omit many of the effects we are trying to measure.
As an alternative, I use a pair of approaches to bound the differences in the value of health capital for the uninsured. First, I assume that there is no difference in morbidity between the insured and the uninsured and calculate health capital for the insured. To generate the health capital measures for the uninsured, I simply adjust the mortality risk as in the above section. As long as the uninsured are on average less healthy than the insured, and if they do have some higher morbidity that could be alleviated with coverage, this will provide a lower bound of the potential gains from the intervention.
For the second approach, I use the National Health Interview Survey (NHIS) to determine the differences in disease prevalence and quality of life by insurance status. I control for age, sex, and a number of other demographic and socioeconomic factors when estimating prevalence and health-related quality of life. Nevertheless, there may be unobservable characteristics that confound the relationship between insurance status and health outcomes. If the uninsured differ from the insured along dimensions that are correlated with worse health, then this approach is likely to yield estimates of the difference in health capital by insurance status that are too large. Providing insurance will not completely eliminate the gap in observed health outcomes between the two groups. Therefore this approach can be considered an upper bound to the gains from extending coverage to the uninsured.
Incorporating Morbidity Empirically
Incorporating morbidity empirically is complex because it is hard to measure. It is useful to consider a schematic framework for various types of disease. Diseases arise as a result of environmental and behavioral factors, often combined with some random event. A disease can progress to death, complete recovery, or a chronic state. Chronic disease can result in reduced quality of life through lower
physical and mental well-being, and it can also increase future risk of death or other diseases. It is useful to distinguish three health conditions: acute conditions, chronic conditions, and risk factors. Acute conditions are characterized by short bouts of illness followed by complete recovery. Death may follow an acute illness, but in general acute disease has become less salient to people over time. The prevalence of acute illness is difficult to measure because it fluctuates considerably from year to year or even month to month (flu season, for example). This analysis ignores short-term illnesses. Chronic diseases, on the other hand, can affect mortality, long-term quality of life, or both. Because chronic conditions persist over time, they are relatively easy to measure. The health capital framework employed here focuses on chronic conditions.
The NHIS and the Surveillance, Epidemiology and End Result (SEER) database are nationally representative sources of disease prevalence for measuring chronic conditions. The NHIS offers a cross-sectional sample of the noninstitutionalized U.S. population, approximately 100,000 people each year. It is designed in part to measure disease prevalence and asks about a large number of conditions. Mental health and HIV/AIDS are conditions that are not consistently measured in the NHIS; however, SEER is a nationally representative registry of all cancers reported at nine sites, covering a population of about 40 million.
I incorporate 14 diseases or conditions from the NHIS: heart disease (defined as coronary heart disease, angina, heart attack, other heart condition), stroke, diabetes, emphysema, asthma, bronchitis, joint pain or swelling, other pain (neck, back, jaw, or head), kidney disorder, liver condition, blindness, poor vision, deafness, and bad hearing. Prevalence data were obtained from the 1998, 1999, and 2000 NHIS. The data were pooled to increase the sample size for a final adult sample of about 95,000. Cancer prevalence is measured using SEER data. The SEER data report cancer incidence and survival by year after diagnosis. From this I construct a measure of prevalence defined as having been diagnosed with cancer in the past five years.20 I use SEER data from 1994 to 1999 to calculate the combined 1998 and 1999 prevalence of cancer under this definition.21,22
In previous work, one important category of disease that we were unable to include was mental disorders (Cutler and Richardson, 1997). The current NHIS does ask some mental health questions; however, the scope and nature of these
questions are not consistent throughout the 1998–2000 surveys. Few studies have produced reliable measures of the prevalence of mental health disorders, and the few studies that do exist generally do not provide age- and sex-specific rates (Narrow et al., 2002). In any case, there is no way to examine whether prevalence varies by insurance status, and the appropriate HRQL weights for the relevant conditions are not available. As a result, information on mental health is not included in these calculations on health capital.
One question of interest in this analysis is whether the observed burden of disease varies by insurance status. We can use the NHIS to observe net differences in reported disease prevalence by insurance status, although there is not enough information to examine the underlying mechanisms in detail. To incorporate differences in disease prevalence into this measure of health capital, I take the following approach. First, one needs to control for the fact that the uninsured population differs from the insured in many ways. For example, the uninsured are more likely to be younger and male. To address this I calculate prevalence by insurance status, sex, and age, using the following age categories: under 18, 18– 24, 25–34, 35–44, 45–54, and 55–64. I also control for race (Black), Hispanic origin, income (less than $5,000, $5,000–$9,999, $10,000–$14,999, $15,000– $24,999, $25,000–$34,999, $35,000–$44,999, $45,000–$54,999, and over $55,000), residing in an urban area, region of the country (Northeast, South, Midwest, West), and insurance status. I exclude individuals with public insurance from this analysis because the proper comparison is the privately insured and the uninsured. For the elderly, I use sex and 10-year age categories, but I do not differentiate by insurance status as this population is predominantly insured by Medicare.23
Next I calculate the prevalence of each disease by insurance status for each age-sex category and use a t-test to determine whether the prevalence rates are significantly different. If the difference is statistically significant at the 10 percent level, I use the insurance status-specific prevalence for that disease for that age-sex group.24 If the difference is not significant, I use the combined prevalence. I use linear interpolation to calculate prevalence by year of age, with the estimated prevalence representing the middle of the age range. The SEER data do not
TABLE B.7 Condition Prevalence per 1,000 Population, by Age and Insurance Status
provide information on insurance status. Therefore, I use the NHIS prevalence of ever having cancer to test for statistical differences by insurance, and then adjust the SEER prevalence numbers to reflect the difference in relative risk observed in the NHIS.
Disease prevalence differed significantly by insurance status in approximately one-quarter of the age-sex cells. In about half the significant cases the uninsured were significantly less likely to have a particular disease. This may reflect later diagnosis amongst the uninsured due to reduced access to medical care. For several diseases, the uninsured were less likely than the insured to report prevalence at younger ages, but equally or more likely to report it at older ages. For example, this was true for diabetes and asthma in both genders, and stroke for women. This is the pattern we would expect to see if the uninsured are diagnosed at a later stage with diseases for which early treatment reduces severity, or if they are not receiving adequate preventive care at younger ages. All significant differences in prevalence were incorporated into the analysis, regardless of direction.
Table B.7 shows the overall prevalence of the conditions used in this analysis, by age and insurance status category. Men and women are combined for ease of presentation. Some of the statistically significant differences by insurance status are confounded when men and women are combined, but the same general conclusions can be drawn. Because I assume that everyone over age 65 is insured, overall
|
35–44 |
45–54 |
55–64 |
|
|||
|
Insured |
Uninsured |
Insured |
Uninsured |
Insured |
Uninsured |
Over 65 |
|
49.6 |
49.1 |
89.9 |
89.9 |
145.3 |
128.6 |
297.4 |
|
4.7 |
4.3 |
7.5 |
14.7 |
21.5 |
21.3 |
77.1 |
|
2.9 |
3.0 |
7.7 |
12.3 |
20.1 |
19.8 |
52.7 |
|
77.8 |
77.1 |
78.1 |
77.9 |
80.0 |
81.7 |
76.0 |
|
6.6 |
6.5 |
17.0 |
13.0 |
38.4 |
38.5 |
82.5 |
|
23.3 |
23.1 |
54.1 |
54.2 |
96.2 |
95.4 |
142.9 |
|
32.5 |
47.8 |
42.9 |
42.7 |
50.6 |
50.1 |
60.8 |
|
7.1 |
7.1 |
10.8 |
10.1 |
14.9 |
15.0 |
28.5 |
|
9.1 |
9.2 |
14.0 |
14.0 |
12.4 |
12.4 |
11.0 |
|
255.7 |
255.3 |
350.0 |
349.7 |
410.6 |
390.8 |
484.3 |
|
1.1 |
1.1 |
1.0 |
1.0 |
2.0 |
1.9 |
7.6 |
|
100.4 |
99.6 |
159.1 |
141.2 |
221.7 |
174.9 |
370.1 |
|
1.6 |
1.6 |
2.4 |
2.4 |
2.9 |
2.9 |
10.3 |
|
55.5 |
82.4 |
89.8 |
121.2 |
81.8 |
124.0 |
146.6 |
|
388.4 |
404.9 |
405.9 |
405.2 |
384.2 |
389.6 |
372.3 |
prevalence for the elderly population is shown for comparison. The most prevalent conditions are joint pain and other musculoskeletal pain. At the older ages, heart disease, bad hearing, bad vision, and diabetes are also relatively common. Asthma is one of the most prevalent diseases for the 18–24 age group, especially for the insured, but the prevalence decreases somewhat with age. I was not able to detect a statistically significant difference in prevalence by insurance status for most of the diseases, but the table generally supports the theory that the uninsured are more likely to have diseases that could be prevented or minimized with appropriate care. Stroke and emphysema are both much more common among the uninsured ages 45 to 54, and pain and bronchitis are more prevalent among the uninsured ages 35 to 44. Asthma is more common among the uninsured at ages 25 to 34. Bad vision tends to be more prevalent in the uninsured. Interestingly, there is very little difference between the two groups for heart disease, except that it is more prevalent in the insured for the 55 to 64 age group.
Measuring Quality of Life
In addition to knowing the prevalence of the conditions, we also need to know quality of life conditional on having the disease. In particular, for this measure we need a HRQL weight to assign to each condition. In theory, one
would want to measure the HRQL weight using standard gamble or time tradeoff methods, which have the theoretical underpinnings of von Neumann-Morganstern utility theory (Gold et al., 1996a). In practice, conducting these surveys in the population is time consuming and methodologically difficult. As a result, there are relatively few studies that measure disease-specific HRQL weights that could be used in this analysis. Furthermore, one of the concerns that frequently surfaces with this survey methodology is the difficulty that people have in answering hypothetical questions. The QALY literature often demonstrates that people in poor health rate their health status higher than do healthy people who are asked how they would rate their health if they were in that state (for example, see Epstein et al., 1989; Najman and Levine, 1981; and Sackett and Torrance, 1978).
In previous work, both of these problems were addressed by taking a different approach toward estimating the HRQL weights (Cutler and Richardson, 1997). We compared the self-reported health of people with and without a particular condition, controlling for demographics and other conditions that the person may have. Essentially what this is doing is measuring how far a particular condition moves you along the self-reported health scale, which gives you the reduction in the HRQL weight for that particular disease. A similar methodology is employed in this paper to obtain the HRQL weights.
I use data from the NHIS to calculate the HRQL weights. The NHIS contains a question on self-reported health status that asks, “Would you say your health in general is excellent, very good, good, fair or poor?”25 I then order these responses from 1 (poor) to 5 (excellent). I assume that people have a latent measure of health h*, which is related to the individual’s conditions (c) and demographics (X) as follows:
h* = cß1 + Xß2 + e,
where e is a random error term. This is then estimated as an ordered probit, under the assumption that the error term is normally distributed.
I control for sex, age, age squared, race, ethnicity, education, income, marital status, urbanicity, and region of the country in the model, as well as all the conditions that the individual reports having. Included in this are some conditions that are not included in Table B.7. In addition to asking chronic condition questions, the NHIS also has a section that asks about activity limitations. If someone reports a limitation, they are asked whether certain conditions caused the limitation. These questions are not designed to measure prevalence, so I cannot incorporate them in the overall measure of health capital. However, I include any
information captured in these variables to avoid spurious correlation between the conditions in which we have an interest and the other conditions someone may have. Some of the additional conditions included in the probit model are disorders of the digestive system, injuries, and mental disorders.
In order to produce an HRQL weight that falls between 0 and 1 from our regression, we must normalize the ßs. It is not clear how to do this because any endpoints one chooses are somewhat arbitrary. In a previous analysis, we used the highest and lowest cut points—the values of h* at which a person will move into a different category—estimated by the model. This effectively assumes that excellent health is better than 1 and poor health is worse than death, which is obviously not the case. In this paper, I adopt a different approach.26 Instead of using the cut points, I bound the scale with the highest and lowest predicted values (h~) from the probit equation. This approach assumes that the person with the worst predicted health in the sample is in a near-death state, and the person with the best predicted health is in near-perfect health. This improves greatly on previous methodology.27 We can then estimate the HRQL weight for disease i as HRQLi = ß1/ (h~max – h~min).
One important factor that must be considered with this methodology is the role of interactions between the conditions. We do not want to assume linearity of the HRQL weight reductions. Having heart disease and stroke will probably not be as bad as one would predict by looking at the two conditions separately because many of the implications for quality of life are the same. To address this, I calculated the joint prevalence of pairs of conditions listed in Table B.7 and selected those with a high joint prevalence. I then fit the probit model, including these condition pairs. Pairs that were not significant at the p = 0.05 level were subsequently dropped from the model. The condition pairs that were included in the final model were heart disease and joint pain, heart disease and other pain, heart disease and stroke, diabetes and stroke, joint pain and other pain, poor hearing and poor vision, poor hearing and diabetes, and poor hearing and cancer.
It is also possible that the HRQL weights could vary by insurance status. To test this, I interact each of the single and joint conditions with a dummy variable for not having insurance. Interactions that were not significant at the p = 0.05 level were dropped from the model. Only cancer and the diabetes/stroke pair turned out to differ significantly by insurance. Notably, the main effect of not having insurance was significant and negative and is discussed below.
I also estimate the HRQL reduction associated with aging and gender. These
HRQL weights are capturing any omitted disease factor, as well as any age norming that people may be doing. I include in the model age, age squared, a dummy for male, and the interaction between the male dummy and both the age variables.
The coefficients from the probit model and the estimated HRQL weight for the condition are presented in Table B.8. The direction of the coefficient estimates seems quite reasonable. All the main disease effects are negative and significant, while most of the disease interaction coefficients are positive as expected. The only disease pairs that have a negative coefficient are poor vision with poor hearing, and joint pain with other pain. It seems plausible that these could be situations in which the effect of having both conditions is actually worse than additive HRQL weights would suggest. For example, people with poor vision or poor hearing often use their other senses to compensate; having both conditions limits one’s ability to do that.
The last column of Table B.9 shows the implied HRQL weights (the marginal increase or decrease in the HRQL weight is shown for the interaction terms and the uninsured dummy). Because there is no gold standard for disease-specific HRQL weights, it is difficult to compare these estimates with the existing literature. Tengs and Wallace (2000) compiled 1,000 disease- and limitation-specific HRQL weights reported in the literature. The range for most of these weights is quite large (stroke, for example, has reported weights ranging from 0.37 to 0.92). My estimates are within the reported range for nearly every condition, but they tend to fall at the high end of the range. The relative magnitudes of the HRQL weights look plausible. More serious conditions such as diabetes, stroke, and mental health disorders tend to have lower HRQL weights than less severe conditions such as poor vision or poor hearing. For the diseases included in this analysis, the HRQL weights range from 0.91 to 0.99.28
The uninsured interaction terms are both negative and significant, implying that quality of life for cancer patients and those with both diabetes and stroke is worse for those who are uninsured. This is consistent with the literature that suggests that cancer and diabetes are two of the chronic conditions that are most adversely affected by lack of insurance. Although none of the other interactions with the uninsured dummy variable were significant, the coefficient on the dummy variable itself is significant and negative. It is associated with a reduction in the HRQL weight of 0.01, which is similar to having asthma. Unless there is a direct impact of simply being uninsured on one’s perception of health, this variable is
TABLE B.8 Relationship Between Chronic Conditions and Self-Reported Health
|
|
Coefficient |
Standard Error |
QALY |
|
Disease (Conditions included in health capital) |
|
||
|
Heart disease |
-0.459 |
(0.024) |
0.93 |
|
Stroke |
-0.577 |
(0.043) |
0.91 |
|
Asthma |
-0.070 |
(0.034) |
0.99 |
|
Bronchitis |
-0.129 |
(0.031) |
0.98 |
|
Emphysema |
-0.439 |
(0.042) |
0.93 |
|
Cancer |
-0.279 |
(0.022) |
0.96 |
|
Diabetes |
-0.630 |
(0.022) |
0.91 |
|
Kidney disorder |
-0.500 |
(0.041) |
0.92 |
|
Liver disease |
-0.536 |
(0.047) |
0.92 |
|
Deaf |
-0.205 |
(0.067) |
0.97 |
|
Bad hearing |
-0.113 |
(0.015) |
0.98 |
|
Blind |
-0.412 |
(0.066) |
0.94 |
|
Bad vision |
-0.172 |
(0.019) |
0.97 |
|
Joint pain |
-0.242 |
(0.014) |
0.96 |
|
Head/back/neck pain |
-0.255 |
(0.012) |
0.96 |
|
Interactions (Change in QALY weight) |
|
||
|
Heart disease*joint pain |
0.084 |
(0.029) |
0.01 |
|
Joint pain*other pain |
-0.051 |
(0.019) |
-0.01 |
|
Heart disease*other pain |
0.105 |
(0.029) |
0.02 |
|
Poor hearing*poor vision |
-0.097 |
(0.032) |
-0.01 |
|
Poor hearing*diabetes |
0.092 |
(0.038) |
0.01 |
|
Heart disease*stroke |
0.186 |
(0.060) |
0.03 |
|
Lung disease*diabetes |
0.146 |
(0.044) |
0.02 |
|
Poor hearing*cancer |
0.143 |
(0.040) |
0.02 |
|
Diabetes*stroke |
0.203 |
(0.070) |
0.03 |
|
Cancer*uninsured |
-0.293 |
(0.086) |
-0.04 |
|
Diabetes*stroke* uninsured |
-1.254 |
(0.495) |
-0.19 |
|
Control conditions |
|
||
|
Hypertension |
-0.321 |
(0.011) |
0.95 |
|
Other circulatory |
-0.612 |
(0.076) |
0.91 |
|
Other lung disease |
-0.185 |
(0.036) |
0.97 |
|
Other endocrine |
-0.678 |
(0.094) |
0.90 |
|
Nervous system |
-0.748 |
(0.047) |
0.89 |
|
Ulcer |
-0.190 |
(0.016) |
0.97 |
|
Digestive disorders |
-0.863 |
(0.081) |
0.87 |
|
Skin conditions |
-0.492 |
(0.221) |
0.93 |
|
Blood conditions |
-0.771 |
(0.194) |
0.88 |
TABLE B.9 Health Capital by Insurance Status, Sex, and Age: Lower-Bound QALY Approach
|
|
Health Capital Levels and Differences (thousands of dollars) |
Benefit per Year of Insurance (dollars) |
|||||
|
(1) |
(2) |
(3) |
|
||||
|
Insured Until 65 |
Uninsured Until 65 |
Average pr(Ins) Until 65 |
Difference (1)–(2) |
Difference (1)–(3) |
Uninsured Until 65 |
Average pr(Ins) Until 65 |
|
|
Men |
|||||||
|
0 |
4,308 |
4,265 |
4,301 |
42 |
7 |
1,490 |
1,198 |
|
18 |
3,707 |
3,654 |
3,698 |
53 |
9 |
2,121 |
1,536 |
|
25 |
3,446 |
3,389 |
3,437 |
57 |
9 |
2,491 |
1,812 |
|
35 |
3,023 |
2,959 |
3,014 |
64 |
9 |
3,304 |
2,403 |
|
45 |
2,535 |
2,469 |
2,527 |
67 |
8 |
4,584 |
3,119 |
|
55 |
1,996 |
1,941 |
1,989 |
55 |
7 |
6,582 |
3,565 |
|
65 |
1,434 |
1,434 |
1,434 |
|
|||
|
Women |
|||||||
|
0 |
4,356 |
4,329 |
4,352 |
27 |
4 |
941 |
754 |
|
18 |
3,842 |
3,811 |
3,837 |
31 |
5 |
1,208 |
920 |
|
25 |
3,605 |
3,570 |
3,600 |
34 |
5 |
1,481 |
1,164 |
|
35 |
3,215 |
3,175 |
3,209 |
40 |
6 |
2,047 |
1,624 |
|
45 |
2,757 |
2,715 |
2,751 |
43 |
6 |
2,868 |
2,131 |
|
55 |
2,229 |
2,193 |
2,223 |
36 |
6 |
4,198 |
2,594 |
|
65 |
1,660 |
1,660 |
1,660 |
|
|||
|
NOTE: Calculations assume a value of a life year of $160,000 and a real discount rate of 3 percent. Benefit per year of insurance is calculated by dividing the gain in health capital by the discounted years of insurance coverage provided (see Tables B.5A, B.5B). |
|||||||
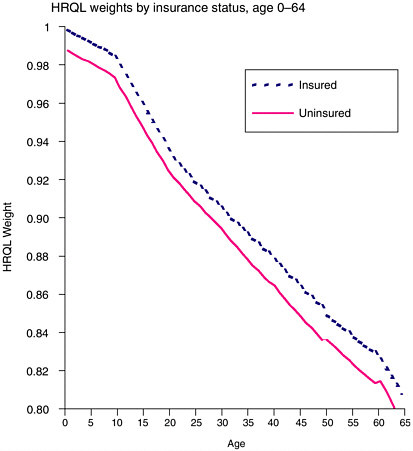
FIGURE B.1 HRQL weights by insurance status, age 0–64.
picking up the impact of omitted factors that are correlated with insurance status and health. This could be omitted chronic conditions, acute conditions, or personal characteristics. This negative impact of being uninsured is included in the overall HRQL weight for the uninsured state. As in previous work, I also include age factors for men and women.
Figure B.1 shows the overall expected HRQL weight for the insured state and the uninsured state from ages 1 to 64. The insured have a slightly higher HRQL weight in any given year, with a difference of about 0.01 to 0.02. The gap between them narrows throughout childhood and then gradually starts to widen a bit in the early twenties.
The QALY Approach: Lower-Bound Estimates
Table B.9 shows health capital at certain ages by sex and insurance category. In these estimates, the HRQL weights and disease prevalence are assumed to be
the same for the uninsured and the insured. These estimates differ from those in Table B.4 only in that they are adjusted for morbidity. If morbidity were evenly distributed by age, this would only affect the level of health capital and not the relative difference in health capital between the uninsured and the insured. Because the disease burden is not constant over the lifespan, however, the difference is likely to change as well.
Because we are incorporating morbidity, the levels of health capital should be lower at every age for every group. Table B.9 shows that they are lower, but still very high. Health capital for an insured infant is about $4.3 million, slightly lower than it was using the years of life method. There are much larger decreases in health capital as one ages, however, compared with the Table B.4 estimates. At age 65, health capital is $1.4 million for men, and $1.7 million for women, quite a bit lower than the YOL method. Again, this is because the burden of disease increases with age. At birth the decrease in health capital once morbidity has been incorporated gets relatively little weight once we discount, whereas the decline in QALYs is more imminent at older ages.
Incorporating morbidity under this conservative approach actually decreases the differences in health capital between the insured and the uninsured. For a newborn, the forgone health capital from lacking insurance ranges from $4,000 to $42,000. As before, the difference is greatest in late middle age, reaching $6,000 to $67,000 at age 45. The left-hand columns of Table B.5B show the impact on the health capital differences by insurance of using a range of interest rates. The pattern is exactly like that observed under the YOL approach. With no discounting, the magnitude of the difference declines with age, while the difference increases slightly with age when a higher discount rate is used. The health capital difference between insured and uninsured 45-year-olds is between $3,000 and $36,000, using a 6 percent discount rate, and between $13,000 and $134,000 with a discount rate of zero.
The last two columns of Table B.9 show the gain in health capital per year of insurance coverage provided. Because the increases in health capital from insurance are lower with this approach than with the years of life method, the gain per year of insurance will be correspondingly lower as well. A 25-year-old male realizes an improvement in health capital of between $1,800 and $2,500 per incremental year of coverage. A 25-year-old female experiences gains of between $1,200 and $1,500 for each additional year of health insurance provided. A large difference in the health gains for men and women remains. The improvements in health capital are still driven by mortality because morbidity does not vary by insurance status.
Health Capital Estimates: Upper-Bound QALY Approach
Table B.10 shows the analogous results to Table B.9 when we allow the HRQL weight to differ by insurance status. As expected, the differences in health
TABLE B.10 Health Capital by Insurance Status, Sex, and Age: Upper-Bound QALY Approach
|
|
Health Capital Levels and Differences (thousands of dollars) |
Benefit per Year of Insurance (dollars) |
|||||
|
(1) |
(2) |
(3) |
|
||||
|
Insured Until 65 |
Uninsured Until 65 |
Average pr(Ins) Until 65 |
Difference (1)–(2) |
Difference (1)–(3) |
Uninsured Until 65 |
Average pr(Ins) Until 65 |
|
|
Men |
|||||||
|
0 |
4,308 |
4,210 |
4,292 |
98 |
16 |
3,435 |
2,842 |
|
18 |
3,707 |
3,602 |
3,688 |
105 |
19 |
4,239 |
3,288 |
|
25 |
3,446 |
3,337 |
3,428 |
109 |
18 |
4,753 |
3,646 |
|
35 |
3,023 |
2,912 |
3,007 |
111 |
15 |
5,758 |
4,286 |
|
45 |
2,535 |
2,433 |
2,523 |
102 |
13 |
7,012 |
4,766 |
|
55 |
1,996 |
1,921 |
1,987 |
75 |
9 |
8,879 |
4,806 |
|
65 |
1,434 |
1,434 |
1,434 |
|
|||
|
Women |
|||||||
|
0 |
4,356 |
4,276 |
4,344 |
79 |
12 |
2,759 |
2,273 |
|
18 |
3,842 |
3,763 |
3,828 |
78 |
13 |
3,090 |
2,482 |
|
25 |
3,605 |
3,526 |
3,593 |
79 |
12 |
3,400 |
2,705 |
|
35 |
3,215 |
3,135 |
3,204 |
81 |
12 |
4,099 |
3,191 |
|
45 |
2,757 |
2,684 |
2,747 |
74 |
11 |
4,958 |
3,610 |
|
55 |
2,229 |
2,176 |
2,220 |
52 |
8 |
6,134 |
3,780 |
|
65 |
1,660 |
1,660 |
1,660 |
|
|||
|
NOTE: Calculations assume a value of a life year of $160,000 and a real discount rate of 3 percent. Benefit per year of insurance is calculated by dividing the gain in health capital by the discounted years of insurance coverage provided (see Tables B.5A, B.5B). |
|||||||
capital between the insured and the uninsured increase dramatically; they are generally 2 to 3 times larger once morbidity is allowed to vary. For an uninsured newborn, the reduction in health capital relative to an insured newborn ranges from $12,000 to $98,000. At age 35, the difference is between $12,000 and $111,000. The distribution of the difference over the lifespan changes as well. The difference in health capital is now greater at the younger ages and generally declines with age. This reflects the differences in the relative risk of disease by age as well as the fact that the decreased quality of life from being uninsured is felt more heavily at the younger ages. The last four columns of Table B.5B show that, without discounting, the value of health capital is between $40,000 and $354,000 greater for an insured newborn; the difference shrinks to $5,000 to $43,000 with a 6 percent discount rate.
Looking at the last two columns of Table B.10, we see some big differences in the health capital benefits per year of insurance under this approach compared with the previous two approaches. First, the gains are much larger, reflecting the improvements in morbidity from obtaining insurance coverage. Now a 25-year-old male has a gain in health capital of between $3,600 and $4,800 per year of coverage, while a 25-year-old female has an increase in health of between $2,700 and $3,400 per year of insurance. Now that morbidity gains are incorporated, the change in women’s health capital is much closer to the change in the health capital of men.
To summarize, our benchmark estimates of the reduction in health capital from being uninsured range from $27,000 to $98,000 for a newborn who will remain uninsured until age 65 and from $4,000 to $16,000 for an uninsured newborn who faces the average probability of being uninsured each year. These results are quite sensitive to the discount rate. The overall range of estimates we get by varying the discount rate from 0 to 6 percent widens to $8,000 to $354,000 for a newborn who will remain uninsured until age 65, and to a range of $1,000 to $55,000 for an uninsured newborn who faces the average probability of being uninsured each year. This is obviously an extremely wide range of estimates. Figure B.2 shows the pattern of health capital across the lifespan using the different approaches and scenarios. This simply presents more clearly the patterns that were visible in the tables.
If we normalize the gains in health capital from insurance by the number of years of insurance coverage provided, a newborn who will remain uninsured until age 65 sees an increase in health of between $940 and $3,400 per year. An uninsured newborn facing the average probability of being uninsured realizes a gain in health capital of $750 to $2,800 per year of coverage. For a 25-year-old, the corresponding increases per year of insurance range from $1,500 to $4,800 and from $1,200 to $3,600, respectively.
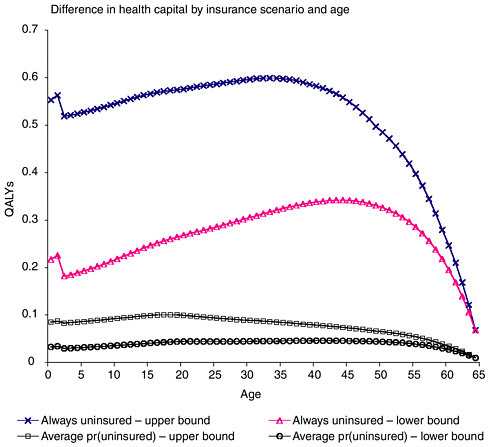
FIGURE B.2 Difference in health capital by insurance scenario and age.
CONCLUSION: TOTAL COST OF HEALTH FORGONE BY THE UNINSURED
The previous section presented a range of estimates for the difference in health capital between the insured and the uninsured at various ages. If we suddenly gave a lifetime of health insurance to the 40 million people who are currently uninsured, how much health would we gain? One key question is how much of the difference in health capital or other measures of health status would disappear and how much would persist. In constructing the health capital measures described earlier, I have tried to focus only on the difference that arises purely from a lack of insurance. The two measures of health capital using the QALY approach should provide an upper and lower bound to this impact.
If that is the case, then to estimate the total value of the health that society would gain from insuring the uninsured, we simply multiply the average gain in health capital at age a by the number of uninsured at that age and sum over all ages. Table B.11 presents the results of that exercise. The total value of forgone health
TABLE B.11 Total Cost of Health Forgone by Lack of Insurance
is extremely large. Using the benchmark discount rate of 3 percent, the conservative estimate of the value of this health is between $250 billion and $499 billion. This assumes that each uninsured individual faces the average probability of being uninsured each year in the future. If they otherwise would have remained uninsured until age 65, the value of this health would be between $1.7 and $3.3 trillion. In reality, the value probably falls somewhere in between. This corresponds to an average increase in health capital per year of insurance coverage provided of between $1,600 and $4,400. Using a range of discount rates from 0 to 6 percent, the conservative estimate of the total value of health is between $109 billion and $1.2 trillion. The highest upper-bound estimate is nearly $7.8 trillion.
Even using the most conservative measures, the estimates of lost health capital are substantial. There is no doubt that this forgone health imposes tremendous disutility on our society. Furthermore, it is important to remember that measure of health capital only captures the value of an individual’s health to that individual. It
does not include any possible spillover effects to others in society from that one person being in better health.
There are numerous limitations to a study such as this one. Obviously, great uncertainty is inherent in all the numbers presented. Many implicit and explicit assumptions could shift the numbers in either direction. For example, the results are sensitive to the choice of discount rate, the value of a life year, the magnitude of any mortality reduction, and estimates of the HRQL weight. Also, we cannot be certain how much of the difference in observed health capital can truly be attributed to lack of insurance coverage. There may be omitted variable bias from unobservable differences between the insured and uninsured that are correlated with health outcomes. Even if there were a causal relationship, there is no guarantee that providing coverage will restore health outcomes to a preuninsured state. A related point is that this analysis also assumes that expanding coverage to a large number of people will not have any macroeconomic effects that would influence health outcomes. In reality, a large-scale expansion might have a measurable impact on access to care by insured individuals, incomes of health-sector workers, the productivity of society in general, and any number of other things, all of which might in turn affect population health.
Another limitation is the assumption that differences in mortality and morbidity by insurance status are eliminated once someone turns 65 and becomes eligible for Medicare. In fact, individuals who lack insurance suffer morbidity consequences that cannot be rectified immediately. Therefore, providing insurance coverage prior to Medicare is likely to lead to additional gains after age 65 that are not measured in this analysis.
This assumption is true for the under-65 population as well. Permanent decreases to health capital as a result of previous spells of uninsurance are not taken into account. Conditional on reaching a certain age, any adverse events prior to that age have no bearing on future health. This is an unrealistic but necessary assumption, given the data limitations. Consequently, the levels of health capital for individuals with a history of being uninsured are overestimated, although it is unclear a priori what effect this will have on changes in health capital.
I also make several assumptions about the uninsured population. I extrapolate rates of uninsurance within age categories to obtain uninsurance rates by year of age. The specification in which each individual faces the average probability of being uninsured assumes that rates of uninsurance will not change, when in fact they appear to be on an upward trend. Wherever possible, all these assumptions were made conservatively, that is, to understate the loss in health capital to the uninsured.
The estimates of health capital depend heavily on the value assigned to a life year. In this analysis, $160,000 per life year is the value used, which is derived from the literature on stated willingness to pay for a statistical life. This value falls in the middle of the range of estimates considered appropriate in the literature and used by government agencies. However, one feature of this measure of health capital is that it is quite straightforward to revise the value of a life year. One need
only divide the health capital estimate of interest by $160,000 and multiply it by a different value for a single life year.
Even by conservative estimates, the lost health capital due to lack of health insurance is substantial. Further research is necessary to increase the precision of each component of this analysis. This will better enable us to examine changes in population health from public policies, improvements in medical technology, or any number of health-related interventions.


