
Implications of Changes in the Financing of Public Higher Education
SUMMARY
Public colleges and universities play a critical role in our nation’s integrated system of education, research, and innovation. They educate the majority of undergraduates and constitute many of the nation’s top research universities. They are training grounds for the people and ideas that drive innovation and improve our lives.
Yet even as public colleges and universities are becoming more important than ever in our knowledge-intensive society, many have come under intense financial pressure. Demographic changes in enrollments are driving up student enrollment in some places and reducing them in others, forcing institutions to adapt to new circumstances. The increasing costs of higher education have led to difficult tradeoffs affecting the quality of the education and services students receive. Extremely tight budgets in some states have reduced the relative appropriations to education in those states even as more students are looking to college as a means of personal advancement.
Though federal funding for student aid is up, more of this funding is going toward loans and tax benefits as opposed to student grants. Also, increases in funding have not been sufficient to match the needs of students.
The result has been a narrowing of educational choices for some students and concerns over deteriorating quality of public institutions.
Some organizations have proposed that the federal government take several important steps to improve the funding of public higher education and to increase student access to these institutions:
-
Expand federal matching programs that encourage increased state appropriations for higher education.
-
Reform the Medicaid program to slow the growth of state commitments that crowd out spending on higher education.
-
Focus national resources on improving the purchasing power of Pell awards.
-
Offer matching funds to states based on their funding of means-tested grant aid.
THE ROLE OF HIGHER EDUCATION IN THE KNOWLEDGE ECONOMY
Higher education has been central to the strength of the US economy over the last half-century. Broadened access for students has created social and economic opportunities for millions of Americans. The integration of education and research has become a key pillar of our research and innovation system. And the new knowledge generated has provided a strong engine for innovation and economic growth.
Public institutions are a particularly important component of America’s higher education system. They enroll and educate one-quarter of all 4-year undergraduates (see Figure PHE-1). When community colleges are included, public schools account for more than 70% of all undergraduate enrollment (see Figures PHE-2A and B). Many of the nation’s top research institutions, particularly in the Midwest and West, are public universities.
A strong system of higher education is more critical now than ever. Global competition in the knowledge economy is growing. Developed and developing countries are working to create high-quality educational institutions, often using American colleges and universities as a model. They are developing their own pool of knowledge workers and knowledge-sector firms.
For the United States to compete in this environment, American higher education needs to remain preeminent. It must continue to play a central role in the production of knowledge and innovation. It needs to create dynamic environments that will entice knowledge-based companies to locate in this country. The United States should facilitate world leadership of its higher education system by continuing to invest where it counts most.

FIGURE PHE-1 Distribution of BA-granting institutions, by sector.
SOURCE: S. Turner. “Policy Implications of Changing Funding for Public Higher Education.” Presentation to National Academies’ Board on Higher Education and Workforce, April 2005.
STRESSES IN THE FINANCIAL STRUCTURE OF PUBLIC HIGHER EDUCATION
Public higher education is under severe financial pressures. The first source of pressure is increasing enrollments. The children of the baby boom are now reaching college age and will increase enrollments at some institutions over the coming decade (see Figures PHE-3A, B, and C). At the same time, the value of higher education as a means for students and society to achieve economic, social, and political goals also is boosting enrollments. Because public institutions typically do not charge students for the full cost of their education, the financial demands on these institutions are expected to grow significantly.1
A second stress on the system is the growing cost of higher education. Costs per student in higher education have grown consistently since the 1960s and steeply since the 1970s.2 Both internal and external factors ap-

FIGURE PHE-2A Distribution of undergraduate enrollment, by type of college, 1967 and 1996.
SOURCE: S. Turner. “Policy Implications of Changing Funding for Public Higher Education.” Presentation to National Academies’ Board on Higher Education and Workforce, April 2005.
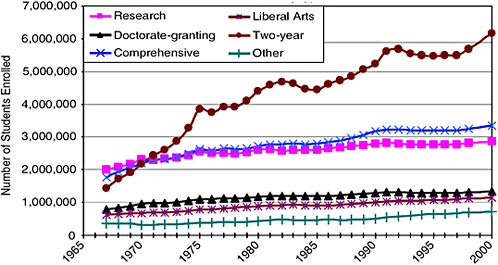
FIGURE PHE-2B Enrollment by type of institution, 1965-2000.
SOURCE: National Science Board. Science and Engineering Indicators 2004. NSB 04-01. Arlington, VA: National Science Foundation, 2004.

FIGURE PHE-3A Number of 18- to 24-year-olds enrolled in college, total and public colleges, 1920-2000.
SOURCE: S. Turner. “Policy Implications of Changing Funding for Public Higher Education.” Presentation to National Academies’ Board on Higher Education and Workforce, April 2005.
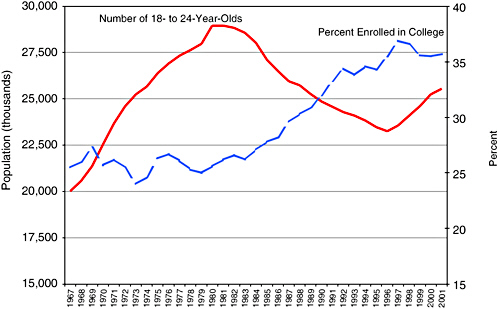
FIGURE PHE-3B Number and percent of 18- to 24-year-olds enrolled in college, 1967-2001.
SOURCE: T. J. Kane. “The Role of Federal Government in Financing Higher Education.” Presentation to National Academies’ Board on Higher Education and Workforce, March 21, 2005.

FIGURE PHE-3C Population growth projection for the United States, Texas, California, and New York, ages 18-24, 2000-2025.
NOTE: Calculations based on US Census Bureau, Population Projections.
SOURCE: T. J. Kane. “The Role of Federal Government in Financing Higher Education.” Presentation to National Academies’ Board on Higher Education and Workforce, March 21, 2005.
pear to be driving up costs. Universities need to compete for high-quality faculty, staff, and students. Computing services, information resources, and other services for students and faculty have added financial burdens (see Figure PHE-4). To cut costs in other areas, institutions have increased student:faculty ratios, shifted toward lower-cost part-time and nontenure-track faculty, encouraged early retirement, capped or postponed faculty salary increases, and outsourced noncritical missions3 (see Figure PHE-5).
A third and perhaps the most important stress on public higher education has been a changing paradigm for public support at both the state and federal levels (see Figures PHE-6A, B, and C). Public colleges and universities—and even private ones that receive state support—have experienced strong competition for state resources over the last decade. Other state financial commitments—such as Medicaid payments—have continued to increase both in real dollars and as a percentage of state budget outlays, which has crowded out other spending priorities4 (see Figure PHE-7).

FIGURE PHE-4 Expenditure of all public institutions, by type of expense, 2001.
SOURCE: National Center for Education Statistics. Enrollment in Postsecondary Institutions, Fall 2001 and Financial Statistics, Fiscal Year 2001. NCES 2004-155. Washington, DC: US Department of Education, December 23, 2003. Table 29. Available at: http://nces.ed.gov/pubsearch/pubsinfo.asp?pubid=2004155.
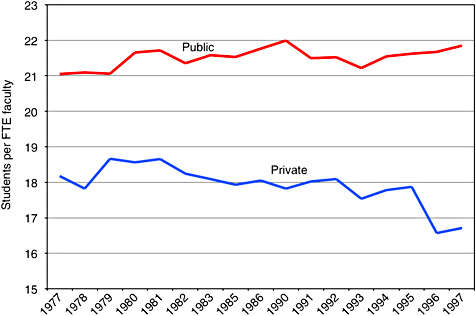
FIGURE PHE-5 Student-faculty ratios, by academic institution sector, 1977-1997.
SOURCE: T. J. Kane. “The Role of Federal Government in Financing Higher Education.” Presentation to National Academies’ Board on Higher Education and Workforce, March 21, 2005.

FIGURE PHE-6A Revenue sources for all public degree-granting institutions, 1980-1981 to 2000-2001.
SOURCE: College Board. Trends in College Pricing, 2004. Washington, DC: College Board, 2004. P. 20. Available at: http://www.collegeboard.com/prod_downloads/press/cost04/041264TrendsPricing2004_FINAL.pdf.
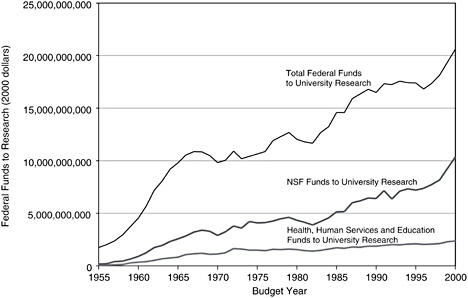
FIGURE PHE-6B Federal funds for university research, total and by select agency, 1955-2000.
SOURCE: S. Turner. “Policy Implications of Changing Funding for Public Higher Education.” Presentation to National Academies’ Board on Higher Education and Workforce, April 2005.

FIGURE PHE-6C Tuition and source of fund revenues, by academic institution type.
SOURCE: S. Turner. “Policy Implications of Changing Funding for Public Higher Education.” Presentation to National Academies’ Board on Higher Education and Workforce, April 2005.

FIGURE PHE-7 Medicaid expenses as percent of gross state product, 1980-2001.
SOURCE: T. J. Kane. “The Role of Federal Government in Financing Higher Education.” Presentation to National Academies’ Board on Higher Education and Workforce, March 21, 2005.
As a consequence of this financial pressure, education funding as a share of state spending, the percentage of education dollars directed to higher education, and the percentage of higher education dollars going to institutions (as opposed to students) all have declined5 (see Figures PHE-8A and B). In brief, state support as a percentage of total revenue for public colleges and universities is down, and these institutions are adapting by restructuring costs and looking elsewhere (for example, to tuition) for financial support (see Figures PHE-9A and B).
At the federal level, spending for higher education appears on the surface to be strong. Spending on the Pell grant program, for example, increased 60% in real terms from 1999-2000 to 2003-20046 (see Figure PHE-10). However, hiding beneath the overall increases in federal support are important shifts in its distribution. The mix of federal support in 2003-2004 was 34% grants, 55% loans, and 5% tax benefits, the latter two of which have been growing as a percentage of federal support (see Figure PHE-11). Thus, there hasbeen a shift away from grants to other modes of support (for example, subsidized loans, tax credits, and tax-sheltered education accounts) and a shift from need-based to merit-based aid (see Figures PHE-12A, B, and C). Together, these changes have tended to shift subsidies away from students from lower-income families and toward the middle and upper-middle classes.
In addition, while there have been real increases in per student funding under the Pell grant program, they have not been adequate to offset larger increases in college prices. The size of the average grant has increased in real terms in recent years, but average tuition, fees, and room and board at public 4-year colleges and universities increased faster. As a result, the average Pell grant in 2003-2004 covered 23% of the charges at a public 4-year institution compared with 35% in 1980-19817 (see Figure PHE-13). Meanwhile, the Leveraging Education Assistance Partnerships (LEAP) program, which provides matching funds to states for providing need-based grant aid, has declined 31% in real terms over the last decade.8
IMPLICATIONS FOR AFFORDABILITY AND QUALITY
These developments have important implications both for access to higher education and for educational quality. As tuition increases, the array

FIGURE PHE-8A Higher education appropriations share of state expenses, 1977-2002.
SOURCE: T. J. Kane. “The Role of Federal Government in Financing Higher Education.” Presentation to National Academies’ Board on Higher Education and Workforce, March 21, 2005.

FIGURE PHE-8B Higher education appropriations relative to personal income, 1977-2003.
SOURCE: T. J. Kane. “The Role of Federal Government in Financing Higher Education.” Presentation to National Academies’ Board on Higher Education and Workforce, March 21, 2005.

FIGURE PHE-9A Average published tuition and fee charges, enrollment-weighted, by institution type, in constant 2004 dollars, 1976-77 to 2004-05.
SOURCE: S. Baum. “Changes in Funding for Public Higher Education: College Prices and Student Aid.” Presentation to National Academies’ Board on Higher Education and Workforce, April 2005. Data are from College Board. “Trends in Higher Education Series 2004.”
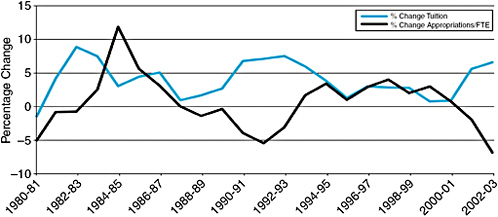
FIGURE PHE-9B Percent change in public 4-year institution tuition and appropriations, 1980-81 to 2002-03.
SOURCE: S. Baum. “Changes in Funding for Public Higher Education: College Prices and Student Aid.” Presentation to National Academies’ Board on Higher Education and Workforce, April 2005. Data are from College Board. “Trends in Higher Education Series 2004.”

FIGURE PHE-10 Pell Grants: Number of recipients and total expenditures, maximum grant, and average grant, in constant 2003 dollars, 1981-1982 to 2003-2004.
SOURCE: S. Baum. “Changes in Funding for Public Higher Education: College Prices and Student Aid.” Presentation to National Academies’ Board on Higher Education and Workforce, April 2005. Data are from College Board. “Trends in Higher Education Series 2004.”
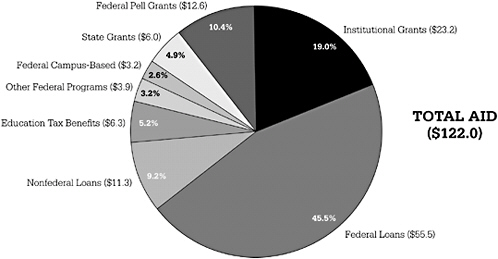
FIGURE PHE-11 Total higher education student aid, by source, in billions of current dollars, academic year 2003-2004.
SOURCE: S. Baum. “Changes in Funding for Public Higher Education: College Prices and Student Aid.” Presentation to National Academies’ Board on Higher Education and Workforce, April 2005. Data are from College Board. “Trends in Higher Education Series 2004.”
of educational choices for students may be constrained unless the availability of financial aid can compensate. Especially for low-income students, the real and perceived cost increases for college education can limit access and lifetime opportunity (see Figures PHE-14A and B).
The second implication is for the quality of teaching and research. Reductions in funding for public education combined with constraints on tuition increases appear to be causing deterioration in the quality of public colleges and universities compared with private institutions.9 Private universities benefit from larger endowments, have constrained enrollment growth to control costs, and have steadily increased tuition to offset inflation and provide new resources for qualitative improvement. Public institutions are less able to use these measures for fiscal control and as a result are falling behind private colleges and universities, in endowments, faculty salaries, student:faculty ratios, student services, and facilities (see Figure PHE-15). Also, to the extent that changes in faculty composition—such as increases in part-time and nontenure-track staff—affect the quality of teaching and mentoring and the availability of tenure-track faculty as role mod-

FIGURE PHE-12A Federal aid awarded to students (expenditures), in millions of constant 2003 dollars, 1993-1994 and 2003-2004.
SOURCE: S. Turner. “Policy Implications of Changing Funding for Public Higher Education.” Presentation to National Academies’ Board on Higher Education and Workforce, April 2005.
els, they may affect undergraduate persistence, graduation rates, and the propensity to continue to graduate school. The consequences include a more stratified, less dynamic society and a more limited workforce available for generating knowledge and innovation in the economy.
Issues of attainment also have come to the fore. With a growing number of postsecondary students starting out at community colleges and intending to transfer, 2- and 4-year institutions need to work to improve transfer and articulation agreements and processes to facilitate smooth transfers.10 Colleges and universities must make a commitment to the stu-

FIGURE PHE-12B Merit and need-based state grant aid per full-time student, by type of grant, 1971-2002.
SOURCE: S. Baum. “Changes in Funding for Public Higher Education: College Prices and Student Aid.” Presentation to National Academies’ Board on Higher Education and Workforce, April 2005. Data are from College Board. “Trends in Higher Education Series 2004.”

FIGURE PHE-12C Higher education loans, in billions of dollars, by type, 1996-1997 to 2003-2004.
SOURCE: S. Turner. “Policy Implications of Changing Funding for Public Higher Education.” Presentation to National Academies’ Board on Higher Education and Workforce, April 2005.

FIGURE PHE-13 Maximum Pell Grant as percentage of cost of attendance at public and private four-year colleges, 1981-82 to 2003-04.
SOURCE: S. Baum. “Changes in Funding for Public Higher Education: College Prices and Student Aid.” Presentation to National Academies’ Board on Higher Education and Workforce, April 2005. Data are from College Board. “Trends in Higher Education Series 2004.”

FIGURE PHE-14A Enrollment by income, 1972, 1981, and 1986.
SOURCE: S. Turner. “Policy Implications of Changing Funding for Public Higher Education.” Presentation to National Academies’ Board on Higher Education and Workforce, April 2005.

FIGURE PHE-14B Net tuition and fee and net cost of attendance as a percentage of family income, by family income quartile and institution type, 1989-1990 and 1999-2000.
SOURCE: S. Baum. “Changes in Funding for Public Higher Education: College Prices and Student Aid.” Presentation to National Academies’ Board on Higher Education and Workforce, April 2005. Data are from College Board. “Trends in Higher Education Series 2004.”
dents they admit by supporting retention efforts so that students do not drop out of college with high debts and no degree.
ENSURING ADEQUATE FUNDING FOR PUBLIC HIGHER EDUCATION
The federal government has a number of options that could help public institutions receive revenues that reflect the true costs of higher education:
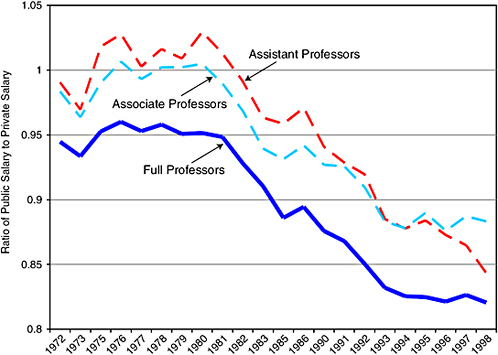
FIGURE PHE-15 Ratio of public institution salary to private institution salary, by faculty rank, 1972-1998.
SOURCE: T. J. Kane. “The Role of Federal Government in Financing Higher Education.” Presentation to National Academies’ Board on Higher Education and Workforce, March 21, 2005.
-
Design or expand federal matching programs that encourage increased state appropriations for higher education. For example, to encourage states to expand means-tested grant aid, the federal government could offer matching funds to states based on their funding of such programs.
-
Reform the Medicaid program to slow the growth of state commitments that crowd out spending on higher education.11
-
Create “Learn Grant Universities” through a federal “Learn Grant Act” as significant as the Morrill Act of 1862 and the GI Bill of 1944.
-
Enact a “Higher Education Millennium Partnership Act” that would integrate technology into the curriculum, create more flexible educational opportunities for part-time and nonresidential students, and develop new partnerships with schools, businesses, and local communities.12
-
Create a “Millennium Education Trust Fund” using the sale of unused communications spectrum over the next few years (with proceeds possibly greater than $18 billion) to provide students with the skills necessary for an age of innovation.
IMPROVING ACCESS TO HIGHER EDUCATION
In addition, the federal government can help the states improve access to higher education for all Americans through several actions:
-
Focus national resources on improving the purchasing power of Pell awards.13
-
Increase flexibility for states to buy more subsidized loan eligibility from the federal government.14
-
Expand and restructure the LEAP program to allow private-sector matches from such organizations as Scholarship America and community foundations.15
-
Institute a voucher program that would give more money to students from low-income homes.16
-
Mandate that both public and private institutions use the average “net price” of attendance instead of the stated “sticker price” in all federal grant and loan programs to determine who qualifies for student-aid awards and how much they should be awarded. Using sticker prices as the official institutional “cost of attendance” misrepresents the actual average cost of attendance in most federal and state student-aid programs.17
-
Consider eliminating the Free Application for Federal Student Aid. Changing laws to permit the use of Internal Revenue Service data to assess qualification for financial aid can simplify processes, save hundreds of millions of dollars, and remove bureaucratic barriers to postsecondary access.18


