
12
Issues in the Assessment of Dose Response
The assessment of dose-response relationships is used to predict the incidence, probability, or magnitude of an adverse health effect in an individual or population for any amount of exposure to a toxicant. Dose-response relationships can also be used to estimate an exposure concentration or range of concentrations likely to correspond to a specific probability or risk of adverse health effects (e.g., dose corresponding to 10-6 excess risk of cancer). These assessments should include quantitative descriptions of the uncertainty of those predictions, such as statistical confidence limits or sensitivity analyses in which assumptions used in the analysis are varied. Sensitivity to assumptions is of particular concern with epidemiologic data because of the potential effects of measurement error and uncontrolled confounding (Lash and Fink 2003). The U.S. Environmental Protection Agency (EPA) draft health risk assessment on trichloroethylene used various approaches to assess dose-response relationships for cancer and noncancer health effects, including point-of-departure methods, linear extrapolation, and nonlinear modeling (EPA 2001b). This chapter discusses those approaches and their application to trichloroethylene.
POINT OF DEPARTURE DETERMINATION
Noncancer Effects
The point of departure is a dose estimate developed from experimental or observational data on cancer or noncancer effects. For noncancer dose-
response data, the point of departure has generally been defined as the no-observed-adverse-effect level (NOAEL), lowest-observed-adverse-effect level (LOAEL), or a modeled dose corresponding to an incremental effect (e.g., the lower 95% limit of the dose or concentration corresponding to a 10% increase in response [LED10 or LEC10]). Use of NOAEL and LOAEL has been criticized because of their dependence on features of the experimental design of the study from which they are derived (e.g., spacing of the dose groups) and their lack of consideration of statistical error or the shape of the dose-response curve (Crump 1984). The NOAEL and LOAEL provide only a single summary statistic and are of limited use in describing the quantitative dose-response relationship. Continuous dose-response models are thus preferred (Faustman and Bartell 1997). However, not all dose-response data sets are suitable for estimating parameters in continuous dose-response models. At least three dose groups are required for continuous dose-response modeling, whereas studies with as few as one or two dose groups can sometimes be used to identify a NOAEL or LOAEL. In its draft risk assessment for trichloroethylene, EPA (2001b) compared a variety of NOAEL, LOAEL, and LED or LEC values calculated from different doseresponse data sets and converted to human-equivalent doses by various approaches. Points of departure for inhalation dosing and for oral dosing were then selected from among the lower NOAEL, LOAEL, and LED10 or LEC10 values for each route of exposure.
The committee found that determining points of departure for noncancer end points in EPA’s draft risk assessment for trichloroethylene was generally consistent with common practice and the dose-response evidence available at the time of the assessment. However, several points should be addressed in the future. First, the criteria used to determine when toxicologic or epidemiologic data are suitable for continuous dose-response modeling should be specified. Second, the rationale for choosing a 10% response level should be provided, and presenting results for several other response levels should be considered. The ability to quantify specific response levels depends on the study design, which often differs in epidemiologic and toxicologic studies. Third, the dose-response model(s) used to estimate LEDs should also be presented. Fourth, the methods used to derive human-equivalent doses from animal data should be described. It is important that the summary statistic used for the conversion (e.g., area under the curve or peak values) be provided and be readily apparent (not placed in footnotes or separate documents). Given the variety of approaches available to derive human-equivalent doses, the results using the different approaches should be presented in tables that allow them to be easily identified and compared. This suggests that multiple dose metrics should be considered for each data set to help inform the selection of the appropriate adjustment methods.
Cancer Effects
For cancer dose-response data, the point of departure is an estimated dose “near the lower end of the observed range without significant extrapolation to lower doses” (EPA 2005a, p. 1-13). Guidance for performing such dose-response assessments is provided in EPA’s new cancer guidelines. These guidelines were finalized after the agency conducted the risk assessment on trichloroethylene, so EPA will need to update the assessment of trichloroethylene to ensure that it is consistent with the new guidelines. For example, with the exception of its consideration of kidney cancer, EPA (2001b) proposed the use of only LED10 values from rodent carcinogenicity studies (adjusted to achieve human-equivalent doses) as points of departure in the trichloroethylene assessment. The new cancer guidelines now suggest that estimated doses corresponding to a 1%, 5%, and 10% increase in response (LED01, LED05, and LED10) should be presented routinely and considered as potential points of departure and that central estimates as well as lower confidence bounds for estimated doses be presented. It has been reported that the LED05 estimate is close to the NOAEL for many conventional bioassays with continuous response variables and that the NOAEL exceeds the LED10 estimate for many bioassays with quantal response variables (Allen et al. 1994a).
It is important to explain and justify the procedure for selecting the particular response level for the point of departure so that the selection does not seem arbitrary. One procedure for choosing from among the 1%, 5%, and 10% response levels could be to select the highest response level exceeded by the lowest observed response level among all exposed dose groups. For example, consider a study with doses of 0, 100, 200, and 300 mg/kg/day and observed excess risk of 0%, 8%, 14%, and 20%, respectively. Using the suggested criterion, 5% excess risk would be selected as the response level for the point of departure, as it is the highest among the two options below 8%. A different approach may be necessary when most exposed individuals have unique doses (common in epidemiologic studies). Categorization of exposure in quartiles or other groupings may be helpful in that situation, but the results may be sensitive to the arbitrary cut points used to distinguish categories, just as NOAELs are sensitive to cut points (Bailer et al. 1997), so an explicit procedure should be specified. This procedure should be objective and transparent and should yield a point of departure near the lower end of the range of tested nonzero doses in accordance with EPA guidelines. Other procedures may also be reasonable, so EPA should establish a clear protocol.
Under the current cancer guidelines, a variety of dose-response models may be used to estimate effective doses (EDs) and LEDs from the data. Although the logit and probit models typically used for these estimates should
provide similar ED values for any given level of response, their LED values may be more divergent. If the establishment of point-of-departure-based dose-response assessment as a default policy model is intended to avoid the difficulties of choosing from among equally reasonable scientific models, it would be sensible to stipulate a default modeling procedure rather than allowing for a variety of approaches.
The effects of selecting different dose metrics for adjustment to equivalent human doses from animal models may be important for both noncancer and cancer dose-response modeling. For example, EPA notes that subchronic dosing studies indicate that cumulative exposure metrics may not be appropriate for predicting the risk of liver cancer (EPA 2001b, p. 420), but it did not evaluate the fit of cumulative exposure metrics for other end points.
LINEAR EXTRAPOLATION FROM THE POINT OF DEPARTURE TO ZERO DOSE
EPA’s cancer guidelines state that “linear extrapolation should be used when there are [mode of action] data to indicate that the dose-response curve is expected to have a linear component below the [point of departure]. Agents that are generally considered to be linear in this range include agents that are DNA-reactive and have direct mutagenic activity, or agents for which human exposures or body burdens are high and near doses associated with key precursor events in the carcinogenic process” (EPA 2005a, p. 3-21). When the mode of action is unclear, EPA suggests that linear extrapolation (or interpolation1) be used as a default approach, as it is thought to overestimate the response level for a given dose. EPA guidelines support the presentation of results from more than one approach when alternative models have “significant biological support” or when multiple modes of action appear to exist. In the draft risk assessment on trichloroethylene, the low dose-response function was estimated by extrapolating between zero dose and the point of departure. The committee found this approach to be consistent with the current cancer guidelines. Because the mode of action for carcinogenicity is unclear and may include multiple pathways (see Chapters
3 and 4), EPA’s presentation of results from both linear and nonlinear model approaches is also appropriate.
The committee recommends that a general study of the implications of linear extrapolation from the point of departure for dose-response assessment be performed in support of all human health risk assessments (not just for trichloroethylene). Such study is warranted because the statistical properties of linear extrapolation between zero dose and the point of departure have never been evaluated, unlike the statistical properties of traditional dose-response modeling techniques such as probit and logit regression (McCullagh and Nelder 1989). Such evaluations typically include mathematical derivations or simulation studies to determine the degree of conservatism compared with hypothetically true dose-response models as well as comparisons among alternative dose-response models using real data sets. If the true shape of the dose-response curve is sigmoidal, the linear extrapolation will likely overestimate the actual risk at a given dose, as suggested by EPA (2005a; p. 3-21), but the validity of that claim and the extent of overestimation are difficult to evaluate without explicitly defining the point-of-departure selection procedure.
Although the linear extrapolation procedure was adopted to avoid the difficulty of choosing from among alternative dose-response models that fit equally well, there appears to be little scientific basis for evaluating its performance. The claim that “the dose-response curve for [trichloroacetic acid] appears linear” (EPA 2001b, p. 4-20) is weak, as it is based on only three data points, two of which appear to fall above the point of departure. The relevant issue is whether the dose-response curve is linear below the point of departure, but there appear to be insufficient data to evaluate this claim for human exposure to trichloroethylene or trichloroacetic acid.
Although linear extrapolation has been advocated as an intentionally conservative approach to protect public health, there are some theoretical reasons to think that sublinear nonthreshold dose-response models may be more relevant for human exposure to toxicants, regardless of the mode of action. One basis for judging that dose-response patterns are not linear is related to how population variability affects the dose-response curve for humans. For example, a possible interpretation of mechanistic data on trichloroethylene for renal cancer is that any individual may have an exposure threshold below which the glutathione conjugation pathway may be less utilized; at an exposure below that threshold, there is possibly no excess risk of an individual developing renal cancer. However, the existence of individual dose-response thresholds does not necessarily imply the existence of a population dose-response threshold below which nobody is at excess risk of renal cancer; in fact, most plausible models for variability in individual dose-response thresholds imply a sigmoidal population dose-response curve even in this case. The flattening and smoothing effects of population
variability on the shape of the population’s dose-response curve have long been recognized for the deterministic model in which each individual has a tolerance to an exposure and the tolerance values have a Gaussian, logit, or other typical distribution (Dobson 1990), but similar results hold for many alternative models. The discussion above does not account for measurement error, which can “linearize” nonlinear dose-response relationships.
To understand this, consider a general function, πi(d), describing the probability of a specific toxic response in an individual, i, given a dose, d. The probability of response in an individual randomly selected from a population of n individuals is then given by Σ πi(d)/n. The classic tolerance model may then be expressed as:
where θi is the tolerance for individual i. Although this model describes a dose-response threshold for any individual, the shape of the dose-response curve for a population of individuals is described by the cumulative distribution of values for θi. For example, it is well known that a Gaussian distribution for θ produces a probit dose-response model for a population, and a logit distribution for θ produces a logistic population dose-response model (Dobson 1990). One might expect these individual tolerances to vary extensively in humans depending on genetics, coincident exposures, nutritional status, and various other susceptibility factors, producing a continuous distribution with one or more modes and relatively narrow tails describing the population extremes. In contrast, a uniform distribution of tolerance values is required to produce a linear dose response under this model. Under realistic assumptions, the dose-response curve is sublinear below the 10% response level, with only approximate linearity at extremely low doses.
Consider a more complicated model that allows for increasing risk with exposure above the individual threshold in an approximately linear fashion, as one might posit for a mode of action that takes effect only at higher doses:
where β represents the effect of exposure about an individual’s threshold. Although this function produces a classic “hockey-stick” dose-response shape for any individual (Figure 12-1), the same model produces a sigmoidal population dose-response curve with no threshold, assuming among the exposed population a Gaussian distribution for θ (Figure 12-2). Although these dose-response models are just two simple examples, a similar phenomenon of translating individual dose-response functions to population dose-response functions should be considered for any human dose-response
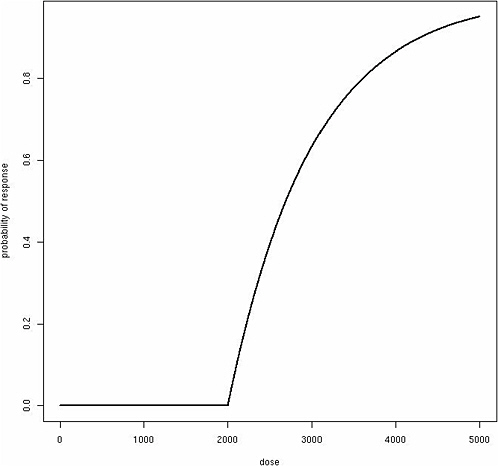
FIGURE 12-1 Classic “hockey-stick” dose-response shape.
assessment. It is important to emphasize that it is the population-based dose-response relationships that are generally observable, not individual dose-response relationships, and population dose-response functions form the basis for public health interventions and regulations. The population dose-response model may take various forms depending on the mode of action and distribution of susceptibility factors among individuals, but both linear dose-response relationships and population thresholds are difficult to derive without resorting to uniform distributions of individual susceptibility factors such as θ.
There is epidemiologic evidence for some toxicants (other than trichloroethylene) suggesting a linear or even a supralinear dose response at low doses in humans (Stayner et al. 2003). Although these data may simply reflect unusual mechanisms or heavy-tailed population distributions of
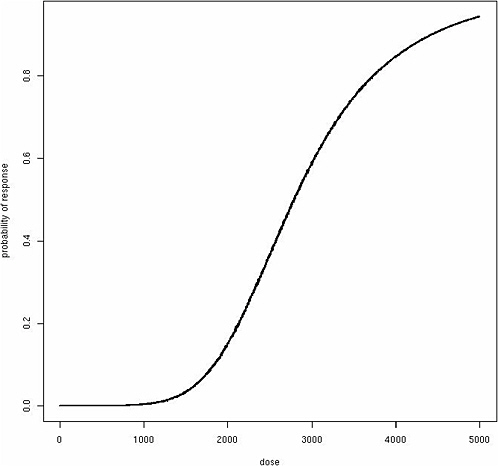
FIGURE 12-2 Sigmoidal population dose-response curve with no threshold.
susceptibility, the effects of exposure measurement error can distort the apparent shape of an observed dose-response curve. This is an important difference between epidemiologic and toxicologic studies; the latter tend to have relatively little exposure measurement error because of intentionally administered doses are used. An additional issue that can affect the shape of an agent’s dose response curve is background effect from spontaneous occurrence or exposure to other chemicals acting by the same mode of action. If background effects can be assumed to be additive in a mechanistic manner, it would shift the dose-response curve so that response to any additional exposure is linear (Peto 1978; Hoel 1980; Crump et al. 1976; Lutz 1990; Clewell and Crump 2005).
This discussion illustrates an important fact: population variability is an inherent feature of the dose-response curve. Moreover, variability in
one parameter could affect the shape of the dose-response curve differently than variability in another parameter (e.g., θ versus β), depending on the underlying probability function πi(d) as well as the shape and location of each population distribution. Therefore, it is difficult to draw conclusions about the shape of the dose-response model from the mode of action alone, without any information on response variability among humans. In fact, any monotonic dose-response model, including the linearized multistage model, can be defined solely in terms of a tolerance distribution without resorting to mechanistic arguments. These considerations suggest that one must consider both the role of mode of action and the role of response variability among humans in determining the likely shape of the dose-response function.
From a scientific perspective, one approach to characterizing doseresponse relationships is to develop models that explain the variability in the available data and, when possible, incorporate known mechanisms of toxicity. Population variability can be directly incorporated within these models by using hierarchical model structures (Allen et al. 1994b; Leroux et al. 1996; Gelman et al. 2004; Longnecker et al. 2005) instead of arbitrary uncertainty factors. Although direct measurements of population variation in human susceptibility are rarely available, the relevant parameter(s) could be statistically estimated along with any other parameters in the dose-response model. Alternatively, a surrogate such as variation of rates in a key toxicodynamic step could be used to estimate population variation in susceptibility. Formal Bayesian methods similar to those applied for physiologically based pharmacokinetic modeling of trichloroethylene offer a natural unified framework for addressing population variability and uncertainty in dose-response assessment and for incorporating information from multiple sources (see Chapter 11). Explicit modeling approaches eventually might replace post hoc applications of uncertainty factors for both cancer and noncancer dose-response assessment.
From a public health perspective, the optimal dose-response model for any toxicant is often unclear, requiring the judicious use of plausible models that adequately protect health. Moreover, typical toxicologic and epidemiologic data rarely provide confirmation for potentially susceptible subpopulations, such as children, the infirm, and other subgroups, suggesting that, in the face of uncertainty, appropriate correction factors should be applied to protect the population from unnecessary risks.
ALTERNATIVE DOSE-RESPONSE FUNCTIONS
A number of alternatives to point-of-departure-based approaches are also presented for cancer end points in EPA’s draft health risk assessment for trichloroethylene, including mechanistic models and linear models for several epidemiologic data sets. The linear models are cursory and in some
cases could be improved with more realistic dose-response models, given the original study data. However, exposure ascertainment is weak in many of the epidemiologic studies, as discussed in Chapter 2 and in the EPA assessment, so it may not be worthwhile to conduct more detailed dose-response modeling for many of these data sets.
The committee endorses the general use of epidemiologic data in dose-response assessment but notes that the exposure assessments in most studies may not be of sufficient quality to use for these purposes. Committee members agree that epidemiologic data for trichloroethylene should be evaluated and described more fully than was done in the EPA (2001b) draft risk assessment, giving more weight to data sets of higher quality in the overall evaluation (see Chapter 2). The relative merits and modeling assumptions used in each epidemiologic dose-response assessment should also be clearly delineated; in some cases, it was difficult for committee members to understand how particular epidemiologic data sets were used for dose-response modeling of trichloroethylene.
The committee also endorses EPA’s exploration of hypothetical mechanism-based models such as the two-stage cancer model. However, for current pharmacokinetic models for trichloroethylene, the two-stage model is not well validated and should be viewed only as a plausible alternative to other nonlinear dose-response models. Parameterization of mechanistic models is often difficult, and it is important to fully describe the details of the model.
OTHER ISSUES
Definitions of empirical dose-response models, benchmark dose models, and mechanism-based dose-response models given in the EPA draft risk assessment (p. 4-01) are oversimplified. The report groups empirical dose-response models with benchmark dose models and draws too fine a distinction between those models and mechanism-based dose-response models. Although this may seem to be a minor point, it suggests that little or no consideration was given to approaches that combine mechanism-based model structures with empirical estimation. Any dose-response model can be used to estimate a benchmark dose, even if it is mechanism based. Moreover, mechanism-based models can be parameterized with experimental measurements of individual parameters, “curve-fitting” (that is, statistical estimation using empirical dose-response data), Bayesian analysis synthesizing experimental measurements and dose-response data, or by a combination of these approaches (Leroux et al. 1996; Sherman and Portier 1997; Dunson et al. 2004). Finally, even the parameters for simple logit and probit dose-response models used for curve fitting have biological interpretations, albeit limited ones. It may be best to view dose-response model structures as a continuum
from less detailed to more detailed biological information and estimation of parameters in models of dose-response relationships as a separate issue that can be tackled through direct measurement of individual parameters, statistical curve fitting, or Bayesian combination of the two approaches.
UNCERTAINTY ANALYSIS
Uncertainty analysis is the process of providing a description of uncertainty surrounding quantitative estimates of risk. The simplest form of uncertainty analysis is to provide a qualitative description of the sources of uncertainty and their potential effects on the risk estimates. Quantitative assessments of uncertainty can be provided by techniques such as interval analysis and probabilistic analysis. These techniques attempt to predict a range and likelihood of plausible risk estimates rather than a single estimate of the magnitude of risk. In January 2006, the Office of Management and Budget (OMB 2006) released a proposed risk assessment bulletin that states that
When a quantitative characterization of risk is made available, this should include a range of plausible risk estimates, including central estimates. A “central estimate” of risk is the mean or average of the distribution; or a number which contains multiple estimates of risk based on different assumptions, weighted by their relative plausibility; or any estimate judged to be most representative of the distribution. The central estimate should neither understate nor overstate the risk, but rather, should provide the risk manager and the public with the expected risk.
Although formal quantitative uncertainty analysis techniques are commonly applied in the exposure assessment and pharmacokinetic modeling portions of environmental risk assessment, they are not yet widely used for doseresponse modeling (Presidential/Congressional Commission on Risk Assessment and Risk Management 1997). Such applications are substantially different than traditional regulatory approaches such as the application of safety/uncertainty factors and intentionally conservative assumptions such as upper bound dose-response estimates. The proposed OMB bulletin suggests that formal quantitative approaches will be applied routinely in future EPA’s risk assessments, including revisions to EPA’s trichloroethylene assessment. Below the committee uses the review by Bartell (2005) to summarize some of the quantitative techniques for performing uncertainty analyses.
Interval Analysis
Interval analysis involves estimating the risk twice, using best-case and worst-case scenarios to identify a range (Alefeld and Herzberger 1983; Fer-
son 1996). While this is a straightforward and easily understood approach, it does not provide information about the relative plausibility of individual risk estimates within the interval. For example, it does not indicate whether each point in the interval is equally likely or whether estimates near the center of the interval are more likely than the estimates near the ends of the interval. Furthermore, single points for base-case and worst-case scenarios may be difficult to define.
Statistical confidence intervals and prediction intervals are another type of interval analysis. These intervals are based on frequentist or Bayesian statistical methods, and attempt to capture the true risk estimate with a fixed confidence level (e.g., 95%) (DeGroot 1989). When traditional frequentist methods are applied, model parameters are usually divided into what is known and unknown, and parameters that are partially understood or for which educated guess may be made are not considered. As an alternative, Bayesian methods offer the advantage of being able to handle such complexities (Greenland 2001).
Probabilistic Analysis
Probabilistic analyses are used to describe risk using one or more probability distributions to indicate the plausibility of an entire range of risk estimates. The most common method is to use Monte Carlo simulation after the initial quantitative risk assessment. The approach involves selecting probability distributions to represent uncertainty in the model parameters. Parameters that are dependent on one another may be specified by such techniques as multivariate distributions, conditional distributions, and rank correlations. Using the specified probability distributions and correlation structure, plausible sets of parameter values are randomly and repeatedly selected. The risk estimates calculated for each set of parameters (tens of thousands or hundreds of thousands) approximate the distribution of uncertainty regarding the risk. Thus, the Monte Carlo distribution is thought to present the range and relative plausibility of various risk estimates. However, cautions have been raised about whether the relative plausibility of an entire range of risk estimates can ever be determined reliably and the possibility of misleading risk managers (Ferson 1996). Errors in uncertainty propagation can be introduced when correlations between parameters are inadequately characterized or are overlooked.
FINDINGS AND RECOMMENDATIONS
The key scientific issues related to the dose-response assessment for trichloroethylene include selection of the data to be used, selection of the point of departure for low-dose extrapolation, methods for modeling from
the point of departure to zero dose, and characterization of uncertainty and variability in estimates of cancer and noncancer risk.
Although it is preferable to use continuous dose-response models to identify a point of departure for noncancer risks, the committee recognizes that suitable data on trichloroethylene were not always available for such modeling. Therefore, a NOAEL or LOAEL may be used when a continuous dose-response model cannot be developed to determine LEDs. The selection of NOAELs and LOAELs is relatively straightforward, but modeled estimates require more explanation and justification.
For dose-response assessment for risks of cancer, EPA’s guidelines call for selecting a point of departure from among modeled doses near the lower end of the observed range. A number of response levels and dose metrics are available for performing such assessments, and it is important that all relevant ones are considered and that a clear rationale is provided for selecting the point of departure.
Recommendations:
-
Several points of departure should be considered and compared when performing point-of-departure-based dose-response assessments for cancer and noncancer end points.
-
When modeled estimates are used as points of departure in cancer and noncancer risk assessments, it is important that (1) criteria are established for determining what data sets are suitable for modeling, (2) the selected response level (e.g., 10%) is justified or multiple response levels are modeled and compared, (3) dose-response models are clearly described, (4) different dose metrics are considered and compared to assess whether the choice of metric substantially affects the dose-response assessment, and (5) the methods for estimating human-equivalent doses are specified when animal data are modeled.
There are several approaches to extrapolating from the point of departure to zero, including linear and nonlinear methods. Much emphasis has been given to incorporating mode-of-action information on the carcinogenicity of trichloroethylene into such extrapolations. The committee recommends that information on both the mode of action and on response variability among humans be used to clarify the shape of the low dose-response curve. The mode of action for trichloroethylene as a kidney carcinogen remains unclear and likely involves multiple pathways.
Recommendations:
There appear to be insufficient epidemiologic data to support quantitative dose-response modeling for trichloroethylene and
cancer. The committee recommends that toxicologic data be used to fit the primary dose-response model(s) and that the available epidemiologic data be used only for validation. The committee does not believe that the available information is sufficient to determine the best dose-response model for trichloroethylene. The default linear extrapolation procedure suggested in the EPA cancer risk assessment guidance can be applied but should first be explicitly defined.


