
11
Do Americans Have Higher Mortality Than Europeans at All Levels of the Education Distribution?: A Comparison of the United States and 14 European Countries
Mauricio Avendano, Renske Kok, Maria Glymour, Lisa Berkman, Ichiro Kawachi, Anton Kunst, and Johan Mackenbach with support from members of the Eurothine Consortium
INTRODUCTION
Among industrialized countries, the United States ranks near the bottom on life expectancy at birth. In 2006, the average American man and woman could expect to live 75 and 80 years, respectively, while the average Western European man and woman could expect to live 77 and 83 years, respectively (World Health Organization, 2009; World Health Organization Regional Office for Europe, 2010). Although the extent to which this is attributable to differences in the health care system is unknown, the United States spends two to three times more than other industrialized countries on medical care (Anderson and Hussey, 2001; Organisation for Economic Co-operation and Development, 2006). This suggests that at least part of the causes of the U.S. disadvantage might lie elsewhere.
A plausible hypothesis is that disparities in mortality in the United States are larger than in other high-income countries, particularly in Western Europe. This implies that U.S. excess mortality might be attributable to higher excess mortality in those with low levels of education, while mortality levels for those with secondary or higher education might be comparable in Europe and the United States. Population composition is more diverse in the United States in terms of geography, race, and ethnicity, which may translate into larger health disparities than in Europe. Health care and social policies also differ dramatically between Europe and the United States. Most noticeably, while access to health care is nearly universal in Western Europe, about 41 million Americans remain uninsured (Adams, Dey, and
Vickerie, 2007). In addition, compared with European countries, the United States has lower provision of social transfers (e.g., social retirement benefits, unemployment compensation, sick pay) and fewer redistributive policies, resulting in substantially larger income and wealth inequalities (Organisation for Economic Co-operation and Development, 2008; Wolf, 1996). Whether the less generous U.S. policies translate into larger mortality inequalities has not yet been established.
The overall excess mortality in the United States compared with Western Europe is well documented (Organisation for Economic Co-operation and Development, 2006; World Health Organization, 2009). However, whether Americans of all education levels have higher mortality than comparable Europeans is yet unknown. Earlier mortality studies have focused only on the strength of education effects, yielding mixed results (Dahl et al., 2006; Kunst and Mackenbach, 1994; Mackenbach et al., 1999). Two recent studies suggest that although older Americans of all education, wealth, and income levels report poorer health than equivalent Europeans, the U.S. health disadvantage is largest among the poor and less educated (Avendano et al., 2009; Banks et al., 2006). Although based on cross-sectional and self-reported data, these findings support the hypothesis that larger health disparities in the United States partly explain the overall U.S. health disadvantage. A competing hypothesis is that Americans of all education levels experience higher mortality than equivalent Europeans. If true, one would expect U.S. residents of all education levels to have higher mortality rates than comparable Europeans.
In this study, we examined cross-national differences in mortality by education level in the United States and 14 European countries in the 1990s and compared the magnitude of the disparities in mortality by education among these populations.
DATA AND METHODS
European Data
We obtained data on mortality according to age, sex, education level, and cause of death from mortality registries. In most countries, data were collected in a longitudinal design, by linking mortality data to 1990s census data in a follow-up period using personal identifiers. However, for some Eastern European and Baltic countries, only cross-sectional data were available around the 2000 census. The data comprise entire national populations, except for the United Kingdom, with data for England and Wales only. For countries with a follow-up period of 10 years or longer, the baseline was ages 30-74. For countries with follow-up shorter than 10 years, the baseline age comprised a broader age group to avoid bias due to variations
in age at the end of follow-up. For populations with a follow-up period of 5 years or shorter (Belgium and Denmark), the baseline was ages 30-79, and for populations with cross-sectional data (Eastern European and Baltic countries), the baseline was ages 35-79. Table 11-1 shows details of the European data sets. Further details on these data can be found elsewhere (Eurothine Group, 2007; Mackenbach et al., 2008).
U.S. Data
We used the mortality follow-up of the five waves (1989-1993) of the National Health Interview Survey (NHIS). The NHIS is a continuous household survey based on a nationally representative sample of the U.S. civilian noninstitutionalized population, covering around 80,000 individuals each year (Massey et al., 1989). In 2004, the National Center for Health Statistics (NCHS) completed a mortality follow-up for the 1986-2000 NHIS cohorts through December 31, 2002, based on linkage with the National Death Index (NDI) (Massey et al., 1989). From this linked data file, we selected respondents who had been interviewed in 1989 through 1993 and used their mortality follow-up data through 2002. The final sample comprised 286,759 individuals.
Analyses by the NCHS have shown that survival rates as observed in the NHIS mortality follow-up data are similar to the survival rates in the general U.S. population. Mortality tends to be slightly lower in the NHIS sample mainly due to the exclusion of the institutionalized population (Ingram, Lochner, and Cox, 2008). Although in most cases differences are not statistically significant, we estimated that overall underestimation might be around 9 percent for white men, negligible for white women, 14 percent for black men, and 11 percent for black women (Ingram, Lochner, and Cox, 2008). In sensitivity analyses, we found that accounting for this underestimation using weights had only marginal effects on our results.
Analyses were conducted separately for whites and blacks, using appropriate sampling weights and adjusting standard errors for sample clustering (Massey et al., 1989).
Education Level
Information on education for Europe came from each national or regional census, while for the United States it came from the NHIS interview survey. In Europe, this classification corresponded approximately to the International Standard Classification of Education (ISCED) levels 0-2 (lower secondary or lower), 3 (upper secondary), and 4-6 (postsecondary). In the United States, corresponding levels were obtained based on years of schooling: ≤ 11 years (lower secondary or lower), upper secondary (12-15
TABLE 11-1 Overview of European and U.S. Data Sets on Socioeconomic Status and Mortality, 1990-2003
|
Country |
Baseline |
Follow-Up |
Person-Years |
Deaths |
Type of Study |
|
United States of America (NHIS) |
1989-2003 |
2002 |
3,109,161 |
33,587 |
National, longitudinal, mortality study for a representative sample of the population |
|
Finland |
1990 |
2000 |
25,874,201 |
270,130 |
National, longitudinal, census-linked mortality study |
|
Sweden |
1991 |
2000 |
43,042,216 |
393,038 |
National, longitudinal, census-linked mortality study |
|
Norway |
1990 |
2000 |
19,956,768 |
213,022 |
National, longitudinal, census-linked mortality study |
|
Denmark |
1996 |
2000 |
14,619,326 |
183,281 |
National, longitudinal, census-linked mortality study |
|
England and Wales |
1991 |
1999 |
2,295,029 |
21,234 |
National, longitudinal, census-linked mortality study for a representative sample of 1 percent of the population of England and Wales |
|
Belgium |
1991 |
1995 |
24,860,995 |
283,325 |
National, longitudinal, census-linked mortality study |
|
Switzerlanda |
1990 |
2000 |
27,910,587 |
255,270 |
National, longitudinal, census-linked mortality study |
|
Franceb |
1990 |
1999 |
2,478,782 |
20,215 |
National, longitudinal, census-linked mortality study for a representative sample of 1 percent of population |
|
Slovenia |
1991 |
2000 |
9,647,452 |
101,557 |
National, longitudinal, census-linked mortality study |
|
Hungary |
1999 |
2002 |
21,031,348 |
363,508 |
National, unlinked, cross-national mortality study |
|
Czech Republic |
1999 |
2003 |
25,759,210 |
344,973 |
National, unlinked, cross-national mortality study |
|
Poland |
2001 |
2003 |
54,883,245 |
717,743 |
National, unlinked, cross-national mortality study |
|
Lithuania |
2000 |
2002 |
5,156,703 |
78,399 |
National, unlinked, cross-national mortality study |
|
Estonia |
1998 |
2002 |
3,435,255 |
60,794 |
National, unlinked, cross-national mortality study |
|
aNon-Swiss nationals are excluded. bResidents of overseas territories, members of the military, and students are excluded. |
|||||
years), and postsecondary (≥ 16 years). In the United States and some European countries, the lowest education category could be further divided into primary education or less (≤ 8 years of U.S. schooling) and lower secondary education (9-11 years of U.S. schooling). In these countries, supplementary analyses were performed to examine whether results based on four categories would lead to results equivalent to those based on three categories only.
Levels of education were comparable across all populations except England and Wales. For this population, census data did not appropriately distinguish individuals with lower secondary education from those with upper secondary education. Therefore, although we present data for England and Wales, rates by education level cannot be directly compared between this population and the other countries included in our study. We therefore refrain from discussing findings for England and Wales in detail in this chapter.
Statistical Analysis
All analyses were stratified by sex and education level. Age-adjusted mortality rates were first calculated based on a Poisson regression model, using the 1995 U.S. census population as a standard. While this provided an overview of mortality rates by education, directly comparing these rates is problematic because the distribution of education varies considerably across countries. Therefore, we calculated two additional measures to compare mortality related to education level across countries:
-
The population attributable fraction (PAF): this measure assumes a causal effect of education on mortality and is equivalent to the proportion of all deaths that would be avoided if exposure to a lower education level is eliminated. The size of the PAF depends on what is defined as exposure and nonexposure. For this analysis, we defined those with tertiary or higher education as the unexposed group. Thus, the PAF reflects mortality attributable to exposure to an upper secondary or lower level of education.
-
We summarized education-related disparities in mortality using the relative index of inequality (RII), a relative measure of inequality (Mackenbach and Kunst, 1997). The RII is a regression-based measure that accounts for differences in the distribution of education among countries. This measure regresses mortality on an education ranking, defined as the midpoint of the range of the cumulative distribution of education in each country (Mackenbach and Kunst, 1997). The RII can be interpreted as the ratio of mortality between
-
rank 1 (the lowest point of the education distribution) and rank 0 (the top end of the education distribution).
RESULTS
The Distribution of Education
The distribution of education differed dramatically across countries. Men and women in the United States reached higher levels of education than men and women in Europe (see Tables 11-2 and 11-3). While in the United States and Switzerland only 20 percent of men had lower secondary education or less (the lowest education level), the corresponding proportion was 30-50 percent in the Scandinavian countries, the Baltic countries, France,
TABLE 11-2 Mortality Ratesa Per 100,000 Person-Years According to Education Level and Population Attributable Fraction (PAF) for Men Ages 30 to 74 in 14 European Countries and the United States
|
|
Lower Secondary or Less |
Upper Secondary |
Tertiary or Higher |
Total |
||||
|
|
Rate |
% |
Rate |
% |
Rate |
% |
Rate |
PAFb |
|
USA, all |
1,840 |
20 |
1,339 |
54 |
885 |
26 |
1,379 |
39 |
|
USA, whites |
1,779 |
19 |
1,316 |
54 |
876 |
27 |
1,334 |
38 |
|
USA, blacks |
2,264 |
32 |
1,658 |
55 |
1,198 |
14 |
1,903 |
39 |
|
Finland |
1,700 |
49 |
1,410 |
30 |
942 |
22 |
1,528 |
41 |
|
Sweden |
1,151 |
40 |
953 |
43 |
706 |
16 |
1,026 |
33 |
|
Norway |
1,498 |
30 |
1,194 |
48 |
873 |
22 |
1,272 |
33 |
|
Denmark |
1,659 |
43 |
1,400 |
38 |
982 |
19 |
1,508 |
37 |
|
England/Walesc |
1,128 |
83 |
786 |
7 |
652 |
10 |
1,074 |
39 |
|
Belgium |
1,590 |
61 |
1,264 |
22 |
999 |
17 |
1,480 |
32 |
|
Switzerland |
1,477 |
20 |
1,123 |
56 |
831 |
24 |
1,165 |
30 |
|
France |
1,285 |
50 |
955 |
37 |
624 |
13 |
1,132 |
51 |
|
Slovenia |
1,977 |
37 |
1,421 |
50 |
930 |
12 |
1,616 |
51 |
|
Hungary |
2,614 |
65 |
1,471 |
21 |
1,029 |
14 |
2,195 |
58 |
|
Czech Republic |
2,088 |
63 |
1,115 |
24 |
732 |
14 |
1,699 |
65 |
|
Poland |
2,217 |
61 |
1,213 |
28 |
838 |
11 |
1,834 |
61 |
|
Lithuania |
2,718 |
31 |
1,892 |
53 |
1,054 |
16 |
2,184 |
63 |
|
Estonia |
2,974 |
32 |
2,393 |
50 |
1,240 |
17 |
2,480 |
63 |
|
aRates are directly standardized to the U.S. census population of 1995. bPAF = population attributable fraction. PAF calculations in this column define the “tertiary or higher education” group as the unexposed category. cEducation levels for England and Wales do not correspond to the International Standard Classification of Education levels. The “lower secondary or less” category include some individuals with upper secondary education as well. No further distinction was possible through census data. |
||||||||
TABLE 11-3 Mortality Ratesa Per 100,000 Person-Years According to Education Level and Population Attributable Fraction (PAF) for Women Ages 30 to 74 in 14 European Countries and the United States
|
|
Lower Secondary or Less |
Upper Secondary |
Tertiary or Higher |
Total |
||||
|
Rate |
% |
Rate |
% |
Rate |
% |
Rate |
PAFb |
|
|
USA, all |
1,142 |
20 |
839 |
61 |
588 |
19 |
888 |
36 |
|
USA, whites |
1,099 |
18 |
818 |
62 |
583 |
20 |
856 |
34 |
|
USA, blacks |
1,399 |
30 |
1,091 |
57 |
765 |
13 |
1,197 |
39 |
|
Finland |
794 |
51 |
631 |
29 |
528 |
20 |
735 |
26 |
|
Sweden |
657 |
41 |
534 |
40 |
402 |
19 |
589 |
32 |
|
Norway |
801 |
36 |
616 |
47 |
484 |
17 |
697 |
31 |
|
Denmark |
1,037 |
53 |
814 |
28 |
664 |
19 |
960 |
29 |
|
England/Walesc |
670 |
87 |
472 |
8 |
394 |
5 |
652 |
40 |
|
Belgium |
801 |
67 |
628 |
19 |
582 |
14 |
766 |
22 |
|
Switzerland |
657 |
40 |
523 |
53 |
472 |
7 |
591 |
19 |
|
France |
530 |
62 |
387 |
28 |
334 |
10 |
492 |
31 |
|
Slovenia |
832 |
56 |
665 |
35 |
526 |
9 |
776 |
33 |
|
Hungary |
1,169 |
64 |
742 |
26 |
651 |
11 |
1,061 |
37 |
|
Czech Republic |
956 |
64 |
684 |
28 |
428 |
8 |
886 |
59 |
|
Poland |
952 |
54 |
642 |
36 |
457 |
11 |
842 |
49 |
|
Lithuania |
1,129 |
32 |
709 |
51 |
462 |
17 |
899 |
53 |
|
Estonia |
1,220 |
29 |
1,000 |
53 |
592 |
18 |
1,050 |
50 |
|
aRates are directly standardized to the U.S. census population of 1995. bPAF = population attributable fraction. PAF calculations in this column define the “tertiary or higher education” group as the unexposed category. cEducation levels for England and Wales do not correspond to the International Standard Classification of Education levels. The “lower secondary or less” category includes some individuals with upper secondary education as well. No further distinction was possible through census data. |
||||||||
and Slovenia and 60-70 percent in Belgium, Hungary, the Czech Republic, and Poland. Accordingly, while 26 percent of U.S. men and 19 percent of U.S. women completed tertiary or higher education, in Europe this range was between 10 percent (England) and 24 percent (Switzerland) among men and from 5 percent (England) to 20 percent (Finland) among women. Rather than reflecting measurement problems, this variation simply reflects cross-national differences in education systems and in the overall level of educational achievements in the population. Some countries, for example the United States and Switzerland, achieved early very high levels of basic educational attainment that influenced the cohorts included in our study, while cohorts in such populations as Belgium and Hungary lagged behind in overall educational achievements in the population as a whole.
Mortality by Education Level in the United States and Europe
Among men, total mortality among U.S. black men was similar to that in Eastern European countries, which had the highest mortality rates in Europe (see Table 11-2). U.S. white men had lower rates than Eastern European countries and rates comparable to Belgium, Denmark, and Finland, which had the highest rates in Western Europe. Mortality was higher for U.S. black women than for women in any European country. U.S. white women had higher mortality rates than women in all Western European countries but Denmark, while their mortality rate was comparable to that in Eastern European countries, which had the highest rates in Europe (see Table 11-3).
Lower education level was associated with higher mortality rates in all countries. Among men and women with only primary education or less, mortality for U.S. blacks and whites was higher than in any Western European country, and comparable to mortality in Eastern European countries. Among men with tertiary education or higher, the pattern differed for whites and blacks: highly educated U.S. white men had similar rates as highly educated men in Norway or Switzerland, while highly educated U.S. black men had higher rates than any European country except Estonia. Among highly educated women, mortality in the United States was higher than in any Western European country and comparable to mortality of highly educated women in Eastern Europe. Highly educated U.S. black women had higher mortality rates than comparable women in any European country.
The proportion of mortality (PAF) attributable to exposure to an upper secondary or lower level of education is summarized in Tables 11-2 and 11-3. The PAF was 38 percent for U.S. white men and 39 percent for U.S. black men, which was comparable to that in Denmark (37 percent) or Finland (41 percent) but smaller than that in Eastern European countries, such as Estonia (63 percent) and the Czech Republic (65 percent). A similar pattern was observed for women.
Relative Index of Inequality (RII)
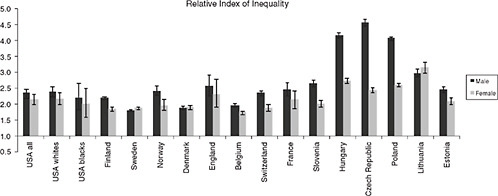
Figure 11-1 shows that a lower education rank was associated with a higher mortality rate in both the United States and Europe. Black and white U.S. men had intermediate levels of inequality in mortality compared with European countries. For example, the RII for U.S. white men was 2.4 (95% CI 2.2, 2.6), which was comparable to that in Norway, Switzerland, and France. Swedish men had the smallest inequalities, while men in Eastern Europe had the largest ones. U.S. white women had somewhat larger inequalities in mortality (2.2, 2.0, 2.4) than many Western European countries, but inequalities similar to Norway and France. The RII for U.S. black women (2.0, 1.6, 2.5) was similar to that in Norway or France. Women in Poland, Hungary, and Lithuania had the largest inequalities.
Total Mortality Rates Versus Disparities in Mortality
Figure 11-2 plots total mortality rates against the RII in each country. Although we had a limited number of observations and correlations were not significant, results generally suggest that populations with large mortality rates tend to have large relative disparities in mortality by education. Correlations were strongly driven by Eastern European countries, which had high mortality rates and large mortality disparities by education.
DISCUSSION
Previous research indicates that the United States has substantially lower life expectancy than most Western European countries. Our results partly support the hypotheses that U.S. excess mortality is to some extent attributable to larger excess mortality at lower education levels. Among women and in some cases for men, however, U.S. excess mortality is pervasive and extends across the entire education distribution. We found that inequalities in the United States are comparable to inequalities in several European countries, such as Norway and France, but smaller than inequalities in Eastern European countries.
Limitations of This Study
Some limitations of our study should be acknowledged. Despite our efforts at harmonization, comparability of data on mortality by education is imperfect. Measurement error might be larger in European countries with less well-established statistics systems, downwardly biasing associations between education and mortality. Data for most countries are longitudinal and nationally representative. However, data for some Eastern European countries are cross-sectional. Although our data mirrored previously reported international mortality patterns (World Health Organization, 2009) and comprised the best available data stratified by education, cross-national differences in mortality disparities might be partly attributable to differences in methodology and measurement error.
Data for the United States differed somewhat from data for Europe in terms of baseline measurement period, mortality follow-up, and covariate measurement. Most importantly, while European data comprised entire national census populations, data for the United States were restricted to the noninstitutionalized population. Previous reports indicate that the NHIS somewhat underestimates U.S. mortality rates, particularly for black men, and to a lesser extent for white men (Ingram, Lochner, and Cox, 2008). As indicated in the methods section, we estimated the overall underestimation of mortality in the United States to range from 9 to 14 percent. In sensitivity analyses, we found that using weights to account for this did not alter our
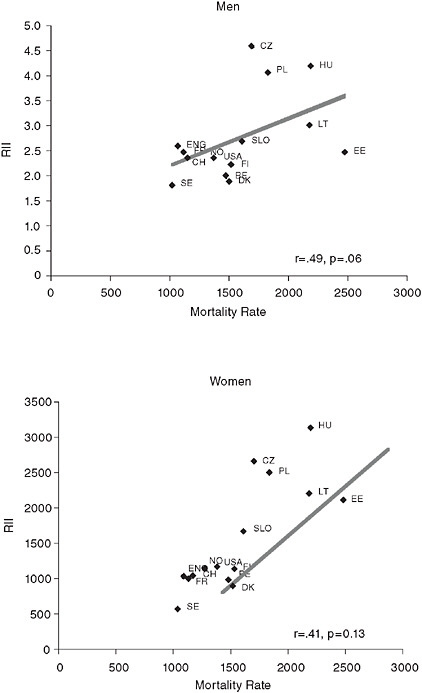
FIGURE 11-2 Pearson correlation of total mortality rates with the relative index of inequality (RII) in men and women at ages 30 to 74 in 14 European countries and the United States.
NOTES: BE = Belgium, CH = Switzerland, CZ = Czech Republic, DK = Denmark, EE = Estonia, ENG = England and Wales, FI = Finland, FR = France, HU = Hungary, LT = Lithuania, NO = Norway, PL = Poland, SE = Sweden, SLO = Slovenia, USA = United States.
overall conclusions. However, we were unable to assess whether mortality underestimation differed by education. Institutionalization rates are higher among less educated people, leading to larger exclusions of frail populations in these groups. As we observed in a previous study for morbidity (Huisman, Kunst, and Mackenbach, 2003), we may have underestimated mortality in the less educated groups in the United States, leading to underestimation of U.S. excess mortality and related disparities by education.
Despite their comprehensiveness, our data included a limited set of covariates. Other than age, our estimates were unadjusted for relevant confounders, such as parental education and early life conditions. Furthermore, our data are observational, and education might be an endogenous variable in our models. For example, personal characteristics unobserved in our study but related to both poor health and lower educational achievements (e.g., personality features, parenting styles, poor childhood nutrition) might account for at least part of the association between education and mortality. Thus, our estimates encompass both causal and noncausal effects of education on mortality. Although we calculated the reduction in mortality that would be achieved if “exposure to lower education” would be eliminated (PAF percentage), estimates are most likely to be an overestimation of the true mortality attributable to the causal effect of education. Future studies should expand our descriptive approach by examining in more detail to what extent total mortality rates are determined by the distribution of mortality by education, taking into account the issues described above.
We calculated the RII to take into account the position of individuals in the education distribution. However, this measure assumes linearity of education effects on mortality. Although there appeared to be a linear association in most countries, this assumption may not be met in all cases. We compared mortality across broad education groups to improve comparability. However, we may have ignored relevant differences, particularly among individuals in the lower end of the education distribution. In sensitivity analyses for countries with more detailed data, we found that dividing the less educated group into up to primary education and lower secondary education did not change the relative position of the United States in terms of disparities. However, it resulted in more extreme excess U.S. mortality in the bottom end of the education distribution compared with European countries (results not shown).
We have used education as a social stratification variable in our study, because it is relatively easy to measure, it is roughly comparable for men and women, and it can be made comparable across countries. In addition, although educational achievement is influenced by childhood health and other early life influences, education is less endogenous to adult health than other social stratification measures, such as income and wealth (Lleras-Muney, 2005). However, education captures only one social stratification
dimension, while such measures as occupational class, income, and wealth may be more relevant social stratification measures at older ages and might be more sensitive to welfare state policies that are fundamentally different between the United States and Europe. Thus, our findings for education do not necessarily apply for effects of income, wealth, and occupation, each of which has a distinct relationship with health and mortality (Smith, 2007).
We recoded country-specific levels of education into internationally comparable education levels based on the ISCED international classification. Therefore, levels of education are in theory comparable in terms of educational achievement. However, education systems differ across countries at least in two ways: First, educational practices, curricula, quality of schooling, and other qualitative aspects of education differ dramatically among the countries included in our study. By focusing only on educational achievement, our analysis assumes that the quality and type of education is homogenous across countries. If this assumption is not met, differential effects of education will partly reflect the impact of different types and quality of education across countries, rather than only the impact of educational achievement on mortality.
Second, the distribution of education differed across countries, which makes comparisons of mortality levels by education cumbersome. Although we calculated the RII to ameliorate this problem, this approach does not fully account for the fact that overall levels of educational achievement are higher in some countries, such as the United States and Switzerland, than in Hungary, Poland, or even the Scandinavian countries. This cross-national variation probably reflects different levels of public investment in education, compulsory schooling laws, and other aspects related to education policy. Because this influences overall educational achievements and the “returns” to education, part of the cross-national differences in mortality associated with education might reflect the different value of education across countries. We did not have data to test these potential differences in the value of education or in the different mechanisms through which education relates to mortality in different countries.
Our analysis of mortality disparities by education rank were based on the RII, a relative measure of inequality. In sensitivity analysis, we calculated the slope index of inequality (SII), an equivalent measure of absolute inequalities. We found that cross-country variations in absolute differences generally mirrored variations in relative differences in mortality by education.
Interpretation
We found that excess mortality in the United States compared with some European countries is generally larger at lower levels of the education distri-
bution. Notwithstanding possible limitations, several explanations for this finding should be considered: behavioral differences, differences in health care systems, differences in social and economic policies that particularly impair the health of Americans, and the extent to which mortality gradients by education reflect causality or selection. Although our data are not comprehensive enough to examine the role of these mechanisms, in this section we draw on evidence from other data sources to discuss the potential role of these explanations. Succinct examination of these issues should be the focus of future research.
Higher excess mortality at the bottom of the education distribution in the United States may stem from larger disparities in behavioral risk factors than in some European countries. In most of Europe and the United States, lower education is associated with higher smoking prevalence (Cavelaars et al., 2000; Zhu et al., 1996). However, the smoking epidemic started earlier and reached a higher pick in the United States (Lopez, Collishaw, and Piha, 1994), particularly among women. We used data from the Health and Retirement Survey (HRS) (Heeringa and Connor, 1995) and the Survey of Health, Ageing and Retirement in Europe (SHARE) (Borsch-Supan et al., 2005) to examine smoking prevalence across the education distribution. At ages 50-74, ever-smoking prevalence in men with lower secondary education or less was 75 percent in the United States, while in Western Europe it ranged from 51 percent in Austria to 79 percent in the Netherlands. Eversmoking prevalence among women with lower secondary or less education was 53 percent in the United States, while in Western Europe it ranged from 13 percent in Spain to 68 percent in Denmark. These differences reflect a longer smoking history among Americans compared with most Europeans, particularly for men at the bottom of the education distribution and for women of all education levels. A similar smoking history may also explain why Danes and Americans share similar excess mortality compared with other European countries. However, some countries, such as the Netherlands and Sweden, have similar smoking prevalence but lower mortality rates than the United States, suggesting that smoking might not be the only explanation for the U.S. excess mortality.
The obesity epidemic is more advanced in the United States, where prevalence is higher than in most European countries (Avendano et al., 2009; Silventoinen et al., 2004). Lower education might be associated with more extreme levels of obesity in the United States. Data from the HRS (Heeringa and Connor, 1995) and SHARE (Borsch-Supan et al., 2005) for 2004 suggests that, at ages 50-74, prevalence of obesity among less educated men was 32 percent in the United States, while in Western Europe it ranged from 15 percent (Sweden and Switzerland) to 23 percent (Spain and Belgium). Obesity prevalence among less educated women in the United States was 36 percent, while in Europe it ranged from 16 percent (Switzerland) to
28 percent (Austria). These differences stem across the entire education distribution, suggesting that obesity might contribute to U.S. excess mortality at all levels of education. The prevalence and social patterning of excessive alcohol consumption, physical inactivity, and poor diet might also be more extreme in the United States than in some European countries, but we did not have comparable data sources to formally examine distributions across countries.
A key finding of our study is that among women and in some cases among men, U.S. excess mortality is not limited to the low end of the education distribution, but even highly educated Americans experience higher mortality than comparable Western Europeans. Smoking and obesity are more prevalent in the U.S. population as a whole and may contribute to disparities across the entire education distribution. However, particularly for women, our findings point also at specific U.S. policies that might impair the health of Americans in all education levels. Women in the United States entered the labor market earlier (Jaumotte, 2003/2) and may have been more exposed to work-related hazards than women in many European countries. U.S. work policies are also less comprehensive and less targeted to the needs of female workers compared with European policies. For example, the United States has less accessible programs of maternity benefits and related income replacement programs than most European countries. Although less educated American women are most vulnerable, the health of women of all education levels may have also been influenced by the lack of comprehensive policies.
The United States has larger income and wealth inequalities, partly as a result of lower provision of social transfers and less redistributive policies than most European countries (Organisation for Economic Co-operation and Development, 2008; Wolff, 1996). It has been hypothesized that these policies might contribute to the U.S. health disadvantage. Particularly noticeable is the large number of uninsured Americans (Adams et al., 2007; Decker and Remler, 2004; Ross and Mirowsky, 2000), which contrasts with national coverage programs in most of Western Europe. However, although disparities in the United States were larger than disparities in Sweden, they were similar to disparities in Norway and Finland. These countries have universal access to care and higher levels of welfare state intervention, social transfers, and income redistribution policies than the United States (Dahl et al., 2006; Wolff, 1996). Norway and Finland share with the United States a strong social gradient in behavioral risk factors, such as smoking and alcohol consumption. Thus, although the longer Swedish welfare state may have contributed to smaller health disparities, welfare state policies may not always counteract autonomous social behavioral patterns underlying health disparities.
Our study suggests that part of the U.S. health disadvantage is attrib-
utable to higher excess mortality among black Americans of all education levels. We did not have data on ethnicity and race for Europe, so we were unable to compare black Americans with black or other ethnic minorities in Europe. However, blacks are a larger share of the U.S. population and have a documented history of disproportionate exposure to poor socioeconomic circumstances, high prevalence of risk factors, and social exclusion. Addressing the fundamental causes of racial disparities in the United States may thus contribute to reducing overall excess mortality.
We observed much higher mortality rates and disparities in mortality by education in Eastern European countries than in Western Europe. Particularly among men, Eastern European countries have high levels of excessive alcohol consumption, which contribute strongly to the health gap between Western, Central, and Eastern Europe (Rehm et al., 2007, 2009). Eastern European countries have experienced substantial economic, social, and policy transitions during the last decades, which may have caused increased excessive alcohol consumption (Stickley et al., 2007) and mortality levels during the 1990s (Stuckler, King, and McKee, 2009). It is interesting to note that despite having much higher levels of stability and economic prosperity, women and less educated men in the United States had mortality rates comparable to their counterparts in several Eastern European countries. This suggests that improving overall economic prosperity may not be sufficient to achieve population health gains in all segments of the population.
An important finding of our study is that despite somewhat steeper gradients in the United States than in several Western European countries, the proportion of U.S. mortality attributable to exposure to low education (PAF) was comparable to that in Denmark and Sweden. This is due to the fact that the proportion of Americans with low education was much lower than in Europe, which reflects a century of aggressive U.S. government investment in education. If effects of education on mortality are causal (Lleras-Muney, 2005), we could argue that this reflects important health returns of education investment in the United States. Had a higher proportion of Americans been in the lowest education categories, mortality attributable to education would have been even larger.
The mechanisms discussed above as possible explanations of the education gradient in mortality rely on the assumption that associations observed are primarily the result of causality running from education to mortality. However, associations may also result from selection: healthier individuals (or individuals with characteristics associated with better health) are more likely to be selected into the highest education groups, while unhealthy individuals (or those with characteristics associated with poor health) are more likely to be selected into the lower education groups, generating a correlation between education and health. The role of selection in generating associations between education and health is likely to differ across
countries, which may partly explain the differential effects of education on mortality.
For example, the United States and Switzerland have achieved very high overall levels of schooling in the population, so that only a relatively small proportion of individuals are being “left behind” in the lowest education categories. These individuals probably represent a selection of the weakest, resulting in a marked health disadvantage associated with low education. In contrast, selection may be less dramatic in some countries, such as Belgium, where overall educational achievements have been more modest than in the United States, so that more than half of the population is classified in the lowest education categories. In this case, selection effects would be weaker, resulting in a weaker association between education and health. Thus, differences in the effect of education in mortality observed in our study may reflect the differential role of selection mechanisms, even if education has the same causal effect on mortality in all countries. Distinguishing causation from selection mechanisms is crucial to understand our findings and should be the focus of future studies.
Implications
This chapter is a first attempt to understand U.S. excess mortality by taking into account different social groupings within countries, but further confirmation of our findings is required. If confirmed in future studies, our findings imply that efforts and policies to improve the health of socially disadvantaged populations—particularly those with low education—might moderately contribute to reduce U.S. excess mortality. However, our results also show that the U.S. health disadvantage is pervasive across all education levels, particularly among women. Therefore, policies that address the broader causes of high mortality among all Americans are essential to address the U.S. health disadvantage. Future studies should focus on studying the causes of these mortality differentials.
ACKNOWLEDGMENTS
The work on this chapter by Mauricio Avendano was supported by a grant from the Netherlands Organisation for Scientific Research (NWO, grant no. 451-07-001), a fellowship from the Erasmus University, and a David E. Bell fellowship from the Harvard Center for Population and Development Studies. The European data were collected in the Eurothine study, funded by the Public Health Program of the European Commission (grant no. 2003125).
Members of the Eurothine consortium contributed to this chapter; their comments on a previous version of this paper are gratefully acknowl-
edged: P. Martikainen, Department of Sociology, University of Helsinki; O. Lundberg, Center for Health Equity Studies Stockholm, Stockholm University; B.H. Strand, Division of Epidemiology, Norwegian Institute of Public Health, Oslo; O. Andersen, National Institute of Public Health, Copenhagen; M. Glickman, Office of National Statistics, Newport, United Kingdom; P. Deboosere, Center of Sociology, Vrije Universiteit Brussel, Brussels; G. Desplanques, Institut National de la Statistique et des Études Économiques, Paris; B. Artnik, Department of Public Health, Faculty of Medicine, Ljubljana, Slovenia; K. Kovacs, Demographic Research Institute, Hungarian Central Statistical Office, Budapest; J. Rychtarikova, Department of Demography and Geography, Faculty of Science, Charles University, Prague; B. Wojtyniak, Department of Medical Statistics, National Institute of Hygiene, Warsaw; R. Kalediene, Kaunas University of Medicine, Kaunas, Lithuania; Department of Epidemiology and Biostatistics, National Institute for Health Development, Tallinn, Estonia.
REFERENCES
Adams, P.F., Dey, A.N., and Vickerie, J.L. (2007). Summary health statistics for the U.S. population: National Health Interview Survey, 2005. Vital Health Statistics, 10(233), 1-104.
Anderson, G., and Hussey, P.S. (2001). Comparing health system performance in OECD countries. Health Affairs (Millwood), 20(3), 219-232.
Avendano, M., Glymour, M.M., Banks, J., and Mackenbach, J.P. (2009). Health disadvantage in U.S. adults aged 50 to 74 years: A comparison of the health of rich and poor Americans with that of Europeans. American Journal of Public Health, 99(3), 540-548.
Banks, J., Marmot, M., Oldfield, Z., and Smith, J.P. (2006). Disease and disadvantage in the United States and in England. Journal of the American Medical Association, 295(17), 2037-2045.
Borsch-Supan, A., Brugiavini, A., Jürges, H., Mackenbach, J., Siegrist, J., and Weber, G. (2005). Health, Ageing and Retirement in Europe. Morlenbach, Germany: Strauss GmbH.
Cavelaars, A.E., Kunst, A.E., Geurts, J.J., Crialesi, R., Grotvedt, L., Helmert, U., et al. (2000). Educational differences in smoking: International comparison. British Medical Journal, 320(7242), 1102-1107.
Dahl, E., Fritzell, J., Lahelma, E., Martikainen, P., Kunst, A., and Mackenbach, J.P. (2006). Welfare state regimes and health inequalities. In J. Siegrist and M. Marmot (Eds.), Social Inequalities in Health: New Evidence and Policy Implications. London, England: Oxford University Press.
Decker, S.L., and Remler, D.K. (2004). How much might universal health insurance reduce socioeconomic disparities in health?: A comparison of the United States and Canada. Applied Health Economics and Health Policy, 3(4), 205-216.
Eurothine Group. (2007). Tackling Health Inequalities in Europe: An Integrated Approach Eurothine. Rotterdam, The Netherlands: Erasmus MC.
Heeringa, S., and Connor, J. (1995). Technical Description of the Health and Retirement Study Sample Design. Ann Arbor: Survey Research Center, University of Michigan.
Huisman, M., Kunst, A.E., and Mackenbach, J.P. (2003). Socioeconomic inequalities in morbidity among the elderly: A European overview. Social Science & Medicine, 57(5), 861-873.
Ingram, D., Lochner, K., and Cox, C. (2008). Mortality experience of the 1986-2000 National Health Interview Survey linked mortality files participants. National Center for Health Statistics. Vital Health Statistics, 2(147).
Jaumotte, F. (2003/2). Labour force participation of women: Empirical evidence on the role of policy and other determinants in OECD countries. OECD Economic Studies, 37, 51-107.
Kunst, A.E., and Mackenbach, J.P. (1994). The size of mortality differences associated with educational level in nine industrialized countries. American Journal of Public Health, 84(6), 932-937.
Lleras-Muney, A. (2005). The relationship between education and adult mortality in the United States. Review of Economic Studies, 72(1), 189-221.
Lopez, A.D., Collishaw, N., and Piha, T. (1994). A descriptive model of the cigarette epidemic in developed countries. Tobacco Control, 3, 242-247.
Mackenbach, J.P., and Kunst, A.E. (1997). Measuring the magnitude of socio-economic inequalities in health: An overview of available measures illustrated with two examples from Europe. Social Science & Medicine, 44(6), 757-771.
Mackenbach, J.P., Kunst, A.E., Groenhof, F., Borgan, J.K., Costa, G., Faggiano, F., et al. (1999). Socioeconomic inequalities in mortality among women and among men: An international study. American Journal of Public Health, 89(12), 1800-1806.
Mackenbach, J.P., Stirbu, I., Roskam, A.J., Schaap, M.M., Menvielle, G., Leinsalu, M., et al. (2008). Socioeconomic inequalities in health in 22 European countries. New England Journal of Medicine, 358(23), 2468-2481.
Massey, J.T. (1996). Analytic and Reporting Guidelines: The Third National Health and Nutrition Examination Survey, NHANES III (1988-1994). National Center for Health Statistics. Hyattsville, MD: U.S. Department of Health and Human Services.
Massey, J.T., Moore, T.F., Parsons, V.L., and Tadros, W. (1989). National Health Interview Survey, 1985-1994: Design and estimation. National Center for Health Statistics. Vital Health Statistics, 9(110).
Organisation for Economic Co-operation and Development. (2006). Health Data 2006. Paris: Author.
Organisation for Economic Co-operation and Development. (2008). Growing Unequal? Income Distribution and Poverty in OECD Countries. Paris: Author.
Rehm, J., Mathers, C., Popova, S., Thavorncharoensap, M., Teerawattananon, Y., and Patra, J. (2009). Global burden of disease and injury and economic cost attributable to alcohol use and alcohol-use disorders. Lancet, 373(9682), 2223-2233.
Rehm, J., Sulkowska, U., Manczuk, M., Boffetta, P., Powles, J., Popova, S., et al. (2007). Alcohol accounts for a high proportion of premature mortality in Central and Eastern Europe. International Journal of Epidemiology, 36(2), 458-467.
Ross, C.E., and Mirowsky, J. (2000). Does medical insurance contribute to socioeconomic differentials in health? Milbank Quarterly, 78(2), 291-321.
Silventoinen, K., Sans, S., Tolonen, H., Monterde, D., Kuulasmaa, K., Kesteloot, H., et al. (2004). Trends in obesity and energy supply in the WHO MONICA Project. International Journal of Obesity and Related Metabolic Disorders, 28(5), 710-718.
Smith, J.P. (2007). The impact of socioeconomic status on health over the life-course. Journal of Human Resources, 42(4), 739-764.
Stickley, A., Leinsalu, M., Andreev, E., Razvodovsky, Y., Vagero, D., and McKee, M. (2007). Alcohol poisoning in Russia and the countries in the European part of the former Soviet Union, 1970-2002. European Journal of Public Health, 17(5), 444-449.
Stuckler, D., King, L., and McKee, M. (2009). Mass privatisation and the post-Communist mortality crisis: A cross-national analysis. Lancet, 373(9661), 399-407.
Wolff, E.N. (1996). International comparisons of wealth inequalities. Review of Income and Wealth, 42(4), 433-451.
World Health Organization. (2009). WHO Statistical Information System. Geneva, Switzerland: Author. Available: http://apps.who.int/whosis/data/ [accessed August 2009].
World Health Organization Regional Office for Europe. (2010). European Health for All Database (HFA-DB). Geneva, Switzerland: Author. Available: http://data.euro.who.int/hfadb/[accessed February 2010].
Zhu, B.P., Giovino, G.A., Mowery, P.D., and Eriksen, M.P. (1996). The relationship between cigarette smoking and education revisited: Implications for categorizing persons’ educational status. American Journal of Public Health, 86(11), 1582-1589.


