
2
Markets for Drugs
This chapter uses the idea of a drug market as an analytical concept with which to consider how market-level demand and supply forces affect prices and drug use. Other social science research, such as ethnographic studies, provides much richer descriptions and other insights about how actual illegal drug markets function on a day-to-day basis, and our discussion of the distinctive features of drug markets incorporates insights from this type of research. Further developing the economic approach to capture more of the features of real-world drug markets across the world is an important on-going research topic.
This chapter provides a summary of what is known about major illegal drug markets. It first lays out the basic demand-and-supply analysis framework and explores the strengths and limitations of the basic models, and then considers three distinctive features of illegal drug markets:
-
the role of imperfect information: the fact that sellers and buyers are uncertain about the quality and quantity of drugs in a transaction;
-
epidemics and contagion: the sudden speed with which drug use can increase and the fact that it spreads through social contact; and
-
the role of enforcement in affecting the price of drugs and the manner in which they are distributed.
FRAMEWORK: SUPPLY-AND-DEMAND MODEL
The supply-and-demand model provides the basic economic framework for drug policy. Efforts to provide economic models of illegal markets go back at least four decades (e.g., Becker, 1968), but the standard economic model has key limitations in understanding illegal drug markets. The implicit features of many legal markets in modern economies—for example, quality certification and available legal mechanisms to guard against fraud—are typically absent from illegal drug markets. Moreover, many key variables are difficult to observe. Illegal drug markets are also characterized by complex features, such as addiction (which means responses to increases and decreases in prices may differ) and high search costs (so that consumers must invest time in finding information about the product) that are sometimes found in legal markets but that are difficult to incorporate in simple models.
Despite these limitations, the basic supply-and-demand model provides a specific language to explore causal pathways of proposed public policies. It provides a framework to interpret available data on observed prices and quantities of illegal substances in particular markets. It focuses attention on basic parameters—the sensitivity of supply and demand to prevailing prices, production technologies, and costs—that are influenced by public policy. Finally, these simple models provide points of departure for richer theoretical and empirical investigations of particular markets. Figure 2-1 presents a very basic model to illustrate the impact of a supply-side law enforcement intervention.
The market demand curve D1 slopes downward: at higher prices, users in the aggregate purchase a lower quantity of the drug in question. The market demand curve reflects two types of responses to higher prices: some drug users cut back on their consumption, while others may drop out of the market and become nonusers (at least of the drug in question). As is discussed below, addiction raises the possibility of asymmetry in that lower prices may increase participation; higher prices may not reduce participation in the short run.
The market supply curve S1 slopes upward: at higher prices, the supply network is willing to provide more drugs to the market. The market supply curve again reflects two types of responses to higher prices: some current suppliers expand the size of their drug-dealing business, and there may also be new entrants who provide new sources of supply.
A supply-side intervention—such as increased border interdiction or more intensive police actions against street dealers—causes the market supply curve to shift up, or alternatively to the left, to curve S2. The vertical distance between S1 and S2 may be interpreted as the increase in unit production and distribution costs induced by supply-side interventions.
This shift captures the idea that to compensate for the extra risks and
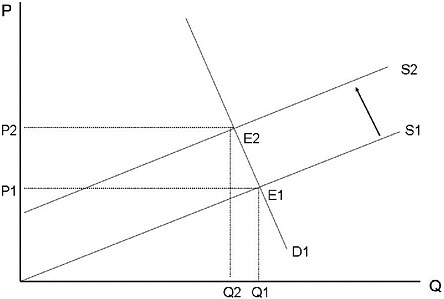
FIGURE 2-1 Impact of a supply-side enforcement with a steep demand curve.
costs created by the policy intervention, suppliers require a higher price to bring any given quantity of drugs to the market. How much the supply curve shifts depends on the effectiveness of the enforcement efforts and suppliers’ ability to respond to those efforts. Suppose, for example, that police increase arrests of street-level dealers. How much this raises unit production costs reflects how much drug-selling organizations have to raise wages to compensate dealers for the additional risk, on the assumption that the dealers can estimate that rise. It also reflects how effectively these organizations can shift their production and distribution systems in response to these enforcement shifts. If sellers can shift sales activities indoors or otherwise avoid the increased enforcement, the shift from S1 to S2 will be small.
The standard model assumes that the market price adjusts until an equilibrium is reached at which the quantity demanded equals the quantity supplied. The original equilibrium in Figure 2-1 is E1: Q1, P1. After the supply-side intervention, a new equilibrium is reached, E2: Q2, P2. This new equilibrium reflects an interaction of both supply and demand factors. The relative slopes of these curves determine the extent that increased production costs are borne by consumers in the form of higher prices. The supply-and-demand model yields the fundamental insight that a supply-side intervention on the model of the “war on drugs”
should produce higher drug prices. At the new drug market equilibrium E2, the market price of the drug is higher (P2 > P1), and the quantity of drugs purchased and consumed is lower (Q2 < Q1).
Even when this model is not explicitly used, this fundamental insight of the supply-and-demand model is commonly recognized. For example, when drug prices have remained constant or have fallen during a period of increased antidrug efforts, many observers conclude that the war on drugs has failed (e.g., Walsh, 2008). In essence, these observers view the market price of a drug as a sufficient statistic for, or at least a useful indicator of, conditions in the drug market. Although it cannot be interpreted as a performance measure without other indicators, it does have substantial information.
However, the information contained in the market price must be interpreted carefully. The first insight is illustrated by the difference between Figures 2-1 and 2-2. That comparison shows that the magnitudes of the effects of the same supply-side intervention depend on the steepness of the demand curve for drugs.
In Figure 2-2 with a relatively flat demand curve (i.e., one that is very responsive to price changes), the supply-side intervention causes a relatively small increase in the market price to P2’. Under this hypothetical situation, the war on drugs has worked quite well by sharply reducing the quantity of drugs consumed to Q2’. However, precisely because drug demand is so responsive to the higher prices caused by the intervention, the price does not have to increase much to restore equilibrium. In contrast, the sharp increase in price seen in Figure 2-1 is accompanied by a smaller reduction in the quantity of drugs consumed—the war on drugs did not work that well. The comparison of Figures 2-1 and 2-2 shows that it is important not to confuse the indicator—the market price—with the policy objective (reducing drug use).
Which figure is a more realistic description of the drug market depends on the price elasticity of demand (discussed in more detail below). In this situation elasticity denotes the percentage change in the quantity of drug demanded given a 1 percent increase in the price. In similar fashion, the price elasticity of supply denotes the percentage change in the quantity of drug supplied given a 1 percent increase in the price.1
One might assume, based on the commonsense notion of addiction, that drug demand is relatively inelastic or unresponsive to prices, which is the assumption behind Figure 2-1. However, as we discuss in more detail below, the price elasticity of demand varies across drugs (heroin, cocaine, marijuana), types of users (heavy, occasional), and time (with
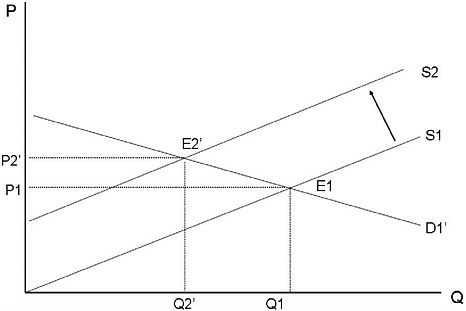
FIGURE 2-2 Impact of a supply-side enforcement with a flat demand curve.
consumers being more sensitive to price over the long term). In fact, demand for heavily addictive substances is consistent with a wide range of price elasticities. Suppose, for example, that an individual spends every cent of her monthly income on crack cocaine. If crack cocaine prices rise by 1 percent with no accompanying change in her economic circumstances, she will spend the same amount and thus purchase 1 percent less crack than she did before. This implies a price elasticity of demand of –1. Luksetich and White (1983) suggest, based on early ethnographic work, that heroin addicts may have a fixed budget for all items other than heroin, representing the minimum that is needed for shelter, food, and clothes; if so, there would be unitary price elasticity. In contrast, more affluent users of marijuana, for whom the drug accounts for a small share of their total incomes, may change their total consumption very little in response to price increases.
A second insight is that many market factors other than price can cause drug demand to shift. The analytical emphasis of the supply-and-demand model is on prices and quantities, but this analytical emphasis does not mean that price is the most important empirical demand influence. The demand curve shows the relationship between quantity demanded and price if all other influences are constant. When one or more of these other influences change, the entire demand curve shifts: at each given price, the quantity of the drug demanded has shifted.
Potential demand shifters include demand-side public policies, such as antidrug media campaigns or treatment programs; law enforcement measures that target users; demographic factors; changing attitudes toward intoxication and self-control; and economic factors, such as income and employment opportunities. Under the conventional view that drug demand is relatively price inelastic, changes in these other influences are likely to be important explanations for observed variation in drug markets over time and across geographic units, particularly since some of them, especially tastes, can change rapidly.
Demand-side policies seek to shift the demand curve down (left). All else being equal, such policies shift the equilibrium down the supply curve, resulting in a lower equilibrium price and a lower quantity of drugs consumed. If social harms associated with illegal drug use are positively related to the dollars spent on these substances (since these are criminal incomes), demand-side interventions are especially attractive because they induce favorable price and quantity effects, while supply-side interventions generate only favorable quantity effects.
Demand shifts can also obscure the impact of supply-side interventions. Figure 2-3 shows a hypothetical situation in which a supply-side
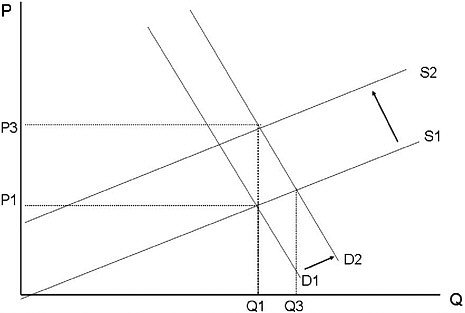
FIGURE 2-3 Drug supply and demand with simultaneous shifts in demand and supply curves.
intervention was launched about the same time as a nonprice influence shifted the demand curve out (up and to the right). An example of such a demand influence is an increase in the population cohort size of adolescents and young adults. Jacobson (2004) found that marijuana prevalence was strongly and positively correlated with the number of 15- to 19-year-olds in the U.S. population, perhaps reflecting what is referred to as the “Easterlin hypothesis”—that behavior is affected by competition within a cohort (see, e.g., Easterlin, 1978). At the new equilibrium, the quantity of drug use has not changed much because of the offsetting effects of the supply-side intervention and the demand shift. However, the supply-side intervention succeeded in preventing drug use from increasing to Q3, which would have been the result if the demand had shifted in the absence of the intervention. In this case, the price increase from P1 to P3 is a valid indicator of the success of the supply-side intervention, even though success is not apparent in changes in the quantity used.
BEYOND THE BASIC MODEL: DISTINCTIVE FEATURES OF DRUG MARKETS
The discussion so far has used the basic model of supply and demand as described in any introductory economics textbook (e.g., Frank and Bernanke, 2004). The textbook model is about an ideal market with many rational and well-informed consumers and producers who buy and sell units of a homogenous commodity. The markets for an agricultural product like wheat might approach this ideal. Yet in many respects, conditions in the markets for illegal drugs seem to dramatically depart from the textbook model.
These departures do not invalidate insights from the basic model of supply and demand, but they once again call for careful interpretation. Many legitimate markets also diverge, in their particulars, from the basic supply-and-demand model. The phenomenon of unemployment suggests excess supply of workers (at a given wage) within the labor market. Such economic models as efficiency wage theory seek to explain why wages persist above the market-clearing level (Akerlof and Yellen, 1986).
Product Quality
Illegal drug consumers cannot directly verify product quality prior to purchase. Yet the same might be said of the cross-country traveler who stops at a roadside diner or the life insurance company that is forbidden by law from performing certain informative medical tests. Prior to the founding of eBay and related websites, search costs and quality differences were dominant factors in the markets for collectibles and antiques.
Yet even when compared with those market factors, unknown quality variation is likely greater for illegal drugs. One reason is that, even after consumption, the quality of cocaine or heroin can be rated only imperfectly; given substantial variation over time for a given individual in the experience provided by a given quantity of cocaine, heroin, or other substances. For example, the intensity of a drug experience is influenced by the time since last use, the expectations of the user, and circumstances of use, summarized in the phrase, “drug, set, and setting” (Zinberg, 1984).
Intermingling of Supply and Demand
Another distinctive element of illegal drug markets is the intermingling of the supply and demand sides. Many heavy users of illegal drugs engage in some drug selling, with the proportion of seller-users differing by substance (see National Institute of Justice, 2003). Frequent users may account for a large share of the drug-selling workforce and sellers may account for a large share of total consumption; selling is a highly opportunistic activity, so that most dealers do it only on an occasional basis (e.g., Reuter et al., 1990).
Users are also important in the supply side of heroin and cocaine markets for another reason. Facing limited opportunities in legal labor markets and already in contact with drug-selling networks, users provide a ready low-wage labor pool for illegal markets. Thus, demand-side measures, such as expanded treatment, may raise distribution costs for drugs because it takes users out of the drug-selling labor force. Users play an important, if casual, role in the marijuana market; in an analysis of data from the 2001 National Household Survey on Drug Abuse (NHSDA), Caulkins and Pacula (2006) found that 89 percent of marijuana users most recently acquired the substance from a friend or relative, typically in small amounts.
Addiction is also an important and distinctive feature of the illegal drug market, though it is also important for the markets for tobacco, alcohol, and caffeine. A sophisticated literature exists to explore the supply and demand sides of these markets for addictive legal products. In many analyses, researchers examined variations across the states in tobacco and beer excise taxes to explore supply-demand models (see, e.g., Cook and Moore, 1993; Grossman, 2004). Given evidence that producers pass almost the entire excise tax burden to consumers, these analyses provide reasonable estimates of consumers’ demand response to increased prices.
Role of Rationality and Efficiency
Important lines of theoretical and empirical research in economics show that the notion of rational drug consumers is not as far-fetched as it
initially seems. In a seminal work, Becker and Murphy (1988) developed a model with rational consumers that demonstrates how many of the phenomena of addiction can be analyzed in an economic model. Orphanides and Zervos (1995) extended the rational addiction model to incorporate learning and regret.
Significant criticisms are made of rational addiction and related models. (e.g., Auld and Grootendorst, 2004). Such models may presume a high level of foresight and market knowledge among consumers—a combination that rests uneasily with the high discount rates observed in empirical research (Becker et al., 1994; Chaloupka, 1991).
More recent work in behavioral economics addresses these difficulties. These analyses incorporate insights from psychological studies, including certain departures from rationality, into economic models. Gruber and Koszegi (2001) reformulated the rational model to incorporate time-inconsistent preferences.
Most recently, Bernheim and Rangel (2004) developed an economic model of cue-triggered addiction. In this framework, a consumer is assumed to operate in two modes. In the “cold” mode, the consumer’s decision processes are properly functioning and lead to selection of most preferred alternatives. In the “hot” mode, decision processes are dysfunctional, possibly resulting in drug use even when that is not (rationally) preferred. Because addicts know they make bad decisions while in the hot mode, they can make life-style changes to reduce the probability of that mode.
Notably, the different theoretical economic models of addiction yield the same prediction: drug users will respond to higher prices, so the market demand curve slopes downward. Many of these models also suggest that users (and potential users) are more responsive to long-standing or permanent price changes than they are to recent or transient changes in price.
Empirical studies of the price responsiveness of drug demand are discussed in more detail below. Although it has been hard to pin down the magnitude of the price responsiveness (as summarized by the price elasticity of demand), there is general empirical support for the proposition that drug demand curves slope downward.
Analyses of legal addictive substances provide two broad insights that likely apply to illegal substances. First, the demand curves of new and low-income consumers are more price elastic than other consumers. Second, as noted above, consumers respond more aggressively to permanent price changes than they do to transient fluctuations. Elasticity shows up in a related analytic literature that examines the efficiency consequences of drug control policies. For example, Becker and colleagues (2006) show that the social costs of enforcement policies decline with
supply and demand elasticities. The more there is inelasticity in either supply or demand, the higher are the social costs, construed narrowly, from constraining the quantity consumed.
As noted above, it is impossible to assess policies aimed at the demand side of a market without some basic understanding of the supply side. A comparatively small economic literature examines points of similarity and departure between the supply side of the illegal drug market and standard economic accounts (for a useful review, see Rhodes et al., 2007). Superficially, the decentralized network of dealers, producers, and the various intermediaries between them seems to bear little resemblance to an organized supply chain. Nevertheless, basic economic concepts provide an organizing framework to understand the actors on the supply side and how they react to supply-side interventions.
Scope of Individual Operations
Levitt and Venkatesh (2000) provide a uniquely detailed organizational analysis of one drug-selling operation. Drawing on internal financial data, the authors describe the franchise nature of Chicago drug selling, in which gangs and their subunits control specific areas where illegal transactions can occur. They suggest that this is in effect a tournament compensation system, in which low-level dealers earn relatively low wages in return for the prospect of advancement. The authors also document the high rates of injury and death among street-level dealers, far higher than those of most civilian occupations (even policing).
There are some troubling aspects to the Levitt and Venkatesh data. We mention just three ways in which their data are inconsistent with other data on drug markets. The best estimate of total sales volume in the cocaine market is $30 billion for 1995 (Office of National Drug Control Policy, 2001). We assume, conservatively, that one-quarter of that was accounted for by crack, giving total crack revenues of $7.5 billion. Levitt and Venkatesh estimate annual sales per participant of $6,000, implying that there are over 1 million sellers of crack, which is a far larger number than estimated in other studies (e.g., Caulkins and Reuter, 1998). They also estimated a 4 percent annualized risk of a homicide death for the gang. However, the FBI has never estimated more than 2,000 drug-related homicides annually, almost certainly too low a figure given the results of individual city studies (e.g., Goldstein et al., 1992) and the limits of police knowledge of the motives for specific homicides. But for crack alone, it is unlikely to be as high as 2,500 (of a total of 20,000 homicides from all causes), which, with a mortality rate of 4 percent, suggests only 62,500 sellers.
The enterprise seems too small in some dimension. If purchases were
made in units of 100 milligrams of pure cocaine, then this gang made only 1,000 transactions per month. With 30 street dealers, this would total about two sales per dealer per day, assuming that individuals sell only about half the days of the year. This is a very low volume. In the most closely comparable study, involving street-level dealers on cocaine and heroin in Washington, DC, in 1988 based on interviews with dealers as they entered probation, Reuter and colleagues (1990) reported about 12 sales transactions for a 4-hour selling session, as well as substantially higher annual revenues per dealer. The Chicago gang records are consistent with very occasional selling on the part of participants, but that can not be reconciled with the authors’ estimate that the street dealers average 20 hours a week selling (Levitt and Venkatesh, 2000, p. 10). Although this study provides important insights about the dynamics of drug-selling careers, the actual numbers should be treated with caution.
Some Cost and Price Factors
Caulkins and Reuter (1998) provide a useful breakdown of the magnitude of the components of costs of cocaine. They estimate that the wholesale price of cocaine in Colombia accounts for about 1 percent of the retail price of the drug on the street in the United States.2 Piecing together several data sources, the authors estimate that the extra profits required to compensate drug dealers for the risks of incarceration and the risks of being killed or injured while dealing account for a little more than 50 percent of the retail price. This study relied heavily on the Washington, DC, study noted above (Reuter et al., 1990), which found that compensation for the risks of deaths, injury, and incarceration accounted for approximately $21,000 per dealer annually.
Supply-side intervention can thus increase retail drug prices by increasing the risk of incarceration and by increasing several other components of costs, such as seizures of drugs and assets. Kuziemko and Levitt (2004) estimate that increases in the certainty and severity of incarceration between 1985 and 2000 raised cocaine prices by 5-15 percent. The implied elasticity of price with respect to incarceration rates was low. During that 10-year period, incarceration for drug law violations increased from 82,000 to 376,000, about two-thirds of which were cocaine offenders (roughly 200,000). Thus, to achieve the modest increase in cocaine prices, it cost an extra $6 billion a year just for incarceration (assuming a cost of $30,000 per year to house an inmate), not including the costs of apprehension and prosecution. This analysis, though just for one period and with
limited data—for example, on actual time served by drug dealers—raises questions about the cost-effectiveness of tough enforcement.
Another important complexity arises because the transactions between drug users and drug sellers differ sharply from the textbook model. In that model, consumers pay an agreed-upon price for a certain quantity of a good of known quality, such as a gallon of gasoline of a specified octane. In contrast, retail drug markets are characterized by conventional pricing, where consumers pay $5 or $10 for “nickel” and “dime” bags (Caulkins, 2007) and avoid any haggling about price or making change. This conventional pricing has obvious advantages for illegal transactions, but it can result in poorly informed consumers since the weight and purity of the contents of the nickel and dime bags are not standardized.
To interpret data on drug prices, researchers commonly adjust the price for weight and purity. The resulting price per pure gram of drug corresponds to the notion of price in the textbook model, but it does not correspond to actual transaction prices. Drug users, and even drug dealers, do not know the exact number of grams of pure drug in the dime bags they exchange. As a result, there is great dispersion in the drug prices paid. For example, the System to Retrieve Information from Drug Evidence (STRIDE) data show that in 2002 the interquartile range of price for heroin (for less than one gram raw weight) was $280 to $428 at the retail level. In other words, a buyer had a one-quarter probability of paying less than $280 and an equal probability of paying more than $428 (Office of National Drug Control Policy, 2004).
This uncertainty by both consumers and sellers about the real price and purity of drugs may have important implications for the behavior of the market. Reuter and Caulkins (2004), using a model of the market for “lemons” (products whose quality is difficult for the buyer to determine [Akerlof, 1970]), present a set of conjectures as to the sources and consequences of this uncertainty. For example, it encourages customers to purchase regularly from more than one seller in order to obtain information about the relative quality-adjusted price of their principal source. For sellers, it allows limited strategic manipulation of these prices. For a formal model that attempts to incorporate these aspects of the market, see Galenianos and colleagues (2009).
The process of consumer search plays a key role and can have complex implications. For example, enhanced law enforcement efforts may hinder consumer efforts to switch suppliers or compare prices. If consumers are targeted (e.g., through sell-and-bust operations), it enhances the bargaining power of sellers and hence may lead to higher prices or the equivalent in terms of reduced quality.
Although several theoretically plausible accounts exist of consumer demand for addictive substances, existing research rarely provides suffi-
cient information to distinguish among them. Drug markets include many interconnected or unobservable components that complicate economic analysis.
For analytical purposes, one key question is whether conventional pricing (the use of a standardized price, with variable and unknown quantity) changes the predictions of the supply-and-demand model, such as the prediction that a supply-side intervention will reduce quantity and increase price. Instead of raising the price of a dime bag, dealers are assumed to react to a supply-side intervention by cutting the weight or purity of the bag. If users consume the same number of dime bags per day, the reduction in weight or purity means that they are consuming a reduced quantity of pure drug and paying a higher price, adjusted for weight and purity. Users may react to the cut in weight or purity by purchasing more dime bags. However there may be a “quality illusion,” in which the variability that users come to expect leads them to at least be slow to adjust, if they adjust at all, to any decline in purity.
DRUG SUPPLY AND ELASTICITIES
Surveys provide greater information about drug demand than they do about drug supply. As noted above, changes in observed prices reflect the relative slopes (the relative elasticities) of both supply-and-demand curves. In legal markets with good data on prices and quantities, estimating demand-and-supply curves is a straight-forward, although often challenging, econometric exercise. The covert nature of illegal drug markets means that prices and quantities are not easily observed, if at all, but some guidance can be found in studies of legal markets. In competitive markets that display constant returns to scale, supply curves tend to be more elastic than demand curves. These assumptions have been explicitly addressed in tobacco and alcohol markets, which find highly elastic supply (Chaloupka et al., 2002). There are no comparably sound studies about illegal drug markets.
Most studies of illegal drug markets implicitly or explicitly assume very high elasticities. For example, Rhodes and colleagues (2002) assume very elastic cocaine supply on the grounds that the agricultural production technology is simple and inexpensive. To the extent that scarce resources are required—for example, access to constrained smuggling routes or specific marketing channel to street users—some upward slope may be found.
One recent paper scrutinizes cross-state variation in the sanctions imposed on marijuana users to examine the elasticity of marijuana supply (Pacula et al., 2010). With lower user sanctions, the market demand curve for marijuana increases (shifts up). The authors found that in response
to this demand shift, there is a short-term increase in marijuana prices. This effect implies that the marijuana supply curve slopes upward (is not perfectly elastic) in this market over the short run; in order to meet the new demand spurred by lower user sanctions, suppliers require more compensation in the form of higher prices.
A second analysis scrutinizes demographic changes to examine marijuana markets (Jacobson, 2004). This paper demonstrates that youth cohort size is positively related to marijuana use prevalence and negatively related to street marijuana prices. The author concludes: “Larger youth cohorts yield thicker drug markets that, through lower sales arrest risk and informational economies, generate cost-savings in drug distribution” (p. 1481). This is an instance in which illegality leads to a tighter connection between changes in the demand side and supply elements.
There is a substantial noneconomic literature about the supply side of drug markets, particularly at the retail level. For New York City in particular, there is a long tradition of ethnographic studies of the subject (e.g., Johnson et al., 1985; Preble and Casey, 1969) that has produced rich descriptions of individual markets. For example, Bourgois spent 3 years in a Hispanic section of Harlem observing the activities and lives of a small group of dealers (Bourgois, 1996). A report of the National Research Council (2001) made extensive reference to work by Curtis and Wendel (2000). As summarized by Johnson and colleagues (2000), the New York drug market had been through several transformations between 1960 and 2000 with varying degrees of organization. For other cities, there are just occasional studies such as those about in Milwaukee (Hagedorn, 1998), Chicago (National Drug Intelligence Center, 2007a), and Los Angeles (National Drug Intelligence Center, 2007b).
Except for temporary and quite local situations, there is rarely mention of market power by any group of drug retailers or of very large retailing organizations. At the importing and wholesale level there may indeed be large organizations, with hundreds of employees and sales volumes in the tens of millions. An excellent and undercited study is that by Fuentes (1998) describing Colombian-run importing organizations in the early 1990s.
There does not appear to be any systematic synthesis of these studies that would allow general statements about the factors that influence, for example, the extent to which a market is dominated by youth gangs involved in other criminal activities or the share of revenues that go to retail sellers or to higher-level participants. Both this line of research and the economics literature would be enhanced by more collaborative work.
Three overlapping reviews explore price elasticies of demand for illegal substances. Before briefly summarizing their findings, it is useful
to distinguish between different forms of demand elasticities in common use.
Participation elasticity denotes the percentage change in the number of individuals who report any substance use that corresponds to a unit percentage change in price. If Γ(P) is the proportion of individuals who report any substance use at some price P, the participation elasticity is then
Participation elasticities are especially important when the goal is to minimize the number of individuals who report any substance use.
Conditional elasticity is the percentage change in consumption that corresponds to a unit percent change in price among individuals who consume a positive quantity of the drug. If Q is the means quantity consumed between active users,
Total price elasticity of demand represents the percentage change in total consumption corresponding to a unit percentage change in price. Since the total amount consumed is (ΓQ),

As defined above, the total price elasticity of demand is the sum of the conditional elasticity and the participation elasticity. Currently, the drug research offers more analyses on participation elasticities than on the other two quantities.
A second important distinction concerns long-run and short-run demand elasticities. Economic theory predicts that consumers should be more sensitive to long-term price changes than transient ones. This pattern holds true for most goods, but particularly for addictive ones. Under a rational addiction framework, long-run price increases raise the cost of initiating use. Under a variety of other frameworks, such as those which require adjustment costs, consumers may have some lag in responding to price changes.
Grossman (2004) provides a useful policy discussion of the role of
price mechanisms to regulate substance use. Using Monitoring the Future (MTF) Survey data collected from high school seniors, he finds a participation elasticity of –0.46 for marijuana use. This point estimate is very similar to that reported by Pacula and colleagues (2001), who reported that the elasticity is between –0.69 and –0.30.
Rhodes and colleagues (2002) estimated a series of demand equations, linking NHSDA data on drug use behaviors to STRIDE data (from undercover purchases) on the price of street drugs. The authors examined demand behaviors among more chronic users by examining drug use forecasting data from the National Institute of Justice, which provide information from arrestees. Using 1988-1996 data, the authors find a conditional price elasticity of approximately –0.33 for marijuana, with greater price sensitivity for weekly users (a conditional price elasticity of –0.50) and a lesser price sensitivity for more occasional users (a conditional price elasticity of –0.25).
In the case of cocaine, several studies indicate a participation price elasticity of demand for cocaine participation in the past year between –0.41 and –1.00 (see, e.g., Grossman et al., 2002). These studies indicate the highest participation elasticities for youth and young adults. Surveys such as MTF, NHSDA, and the National Survey on Drug Use and Health appear more limited in their ability to scrutinize heavy use.
One strand of studies links price series to the receipt of drug-related emergency medical services. This approach provides an independent measure of the extent of use, since it will rise with the amount consumed (other things being unchanged). There is accumulating evidence that heavy cocaine and heroin use are especially price sensitive, perhaps because heavy users face more binding budget constraints on their ability to finance a high level of drug consumption (Caulkins, 2001). A second strand of literature explores self-reported or chemically detected substance use among arrestees (see Rhodes et al., 2002)
Unfortunately, the strong correlation over time and space in drug prices hinders efforts to obtain definitive elasticity estimates. The results reported by Grossman (2004) illustrate the underlying problem. In this analysis, Grossman examines the relationship between drug prices and drug-related emergency department visits. He estimates two reasonable specifications, one that controls for a linear time trend and one that controls for linear, quadratic, and cubic time trends. As shown below in Table 2-1, elasticity estimates are markedly different and the pattern is inconsistent across drugs and methods. The inconsistent estimates in Table 2-1 demonstrate that in many cases, econometric analysis of aggregate data will not yield useful information about the price elasticity of the demand for illegal drugs.
TABLE 2-1 Participation Elasticities, According to Statistical Assumptions
In the most recent analyses in this literature, Dave (2006) examined cocaine and heroin-related emergency department admissions in 21 large metropolitan areas. The author found an elasticity of the probability of a cocaine mention with respect to cocaine prices was –0.27; the corresponding elasticity in the case of heroin was –0.15. The author also found evidence that heroin and cocaine act as complements in consumption. In addition, he found negative lagged price effects, a pattern consistent with either an addiction model or a cumulative insult model of individual vulnerability to drug-related health concerns.
In another study, Dave (2004) reported on illegal drug use (as detected by urinalysis) among arrestees. The author found short-term participation elasticities of approximately –0.17 for cocaine and –0.09 for heroin, with long-term elasticities approximately twice as large. The most striking aspects of these papers are the low-point estimates of participation elasticity compared with prior work.
CONCLUSION
The basic supply-and-demand approach from economics provides a useful analytical framework to understand markets for illegal drugs. On the conceptual side, we draw two main lessons. First, the economic approach is flexible enough to capture many of the special features of illegal drug markets and provides important insights. The second lesson, however, is that much remains to be done to more fully incorporate insights from richly detailed descriptions of illegal drug markets into the economic approach. On the empirical side, the main lesson to be drawn is the difficulty of estimating basic relationships between illegal drug prices and the behavior of users and suppliers. This difficulty does not mean the enterprise should be abandoned, but the current empirical understanding should be viewed as very much a work in progress.
REFERENCES
Akerlof, G. (1970). The market for “lemons”: Quality uncertainty and the market mechanism. Quarterly Journal of Economics, 84(3), 488-500.
Akerlof, G.A., and L.J. Yellen. (1986). Efficiency Wage Models of the Labor Market. Cambridge, UK: Cambridge University Press.
Auld, M.C., and P. Grootendorst. (2004). An empirical analysis of milk addiction. Journal of Health Economics, 23(6), 1,117-1,133.
Becker, G. (1968). Crime and punishment: An economic approach. Journal of Political Economy, 76(2), 169-217.
Becker, G.S., and K.M. Murphy. (1988). A theory of rational addiction. Journal of Political Economy, 96, 675-700.
Becker, G.S., M. Grossman, and K.M. Murphy. (1994). An empirical model of cigarette addiction. American Economic Review, 84(3), 396-418.
Becker, G.S., K.M. Murphy, and M. Grossman. (2006). The market for illegal goods: The case of drugs. Journal of Political Economy, 114(1), 38-60.
Bernheim, B.D., and A. Rangel. (2004). Addiction and cue-triggered decision processes. American Economic Review, 94(5), 1,558-1,590.
Bourgois, P. (1996). In Search of Respect: Selling Crack in El Barrio. New York: Cambridge University Press.
Caulkins, J. (2001). Drug prices and emergency department mentions for cocaine and heroin. American Journal of Public Health, 91(9), 1,446-1,448.
Caulkins, J. (2007). Price and purity analysis for illicit drug: data and conceptual issues. Drug and Alcohol Dependence, 90(Supplement), S61-S68.
Caulkins, J.P., and R.L. Pacula. (2006). Marijuana markets: Inferences from reports by the household population. Journal of Drug Issues, 36(1), 173-200.
Caulkins, J.P., and P. Reuter. (1998).What price data tell us about drug markets. Journal of Drug Issues, 28(3), 593-612.
Chaloupka, F. (1991). Rational addictive behavior and cigarette smoking. Journal of Political Economy, 99(4), 722-742.
Chaloupka, F.J., K.M. Cummings, C.P. Morley, and J.K. Horan. (2002). Tax, price and cigarette smoking: Evidence from the tobacco documents and implications for tobacco company marketing strategies. Tobacco Control, 11, I62-I72.
Cook, P.J., and M.J. Moore. (1993). Drinking and schooling. Journal of Health Economics, 12(4), 411-430.
Curtis, R., and T. Wendel. (2000). Toward the development of a typology of illegal drug markets. Crime Prevention Studies, 11, 121-152.
Dave, D. (2004). Illicit Drug Use Among Arrestees and Drug Prices. Cambridge, MA: National Bureau of Economic Research.
Dave, D. (2006). The effects of cocaine and heroin price on drug-related emergency department visits. Journal of Health Economics, 25(2), 311-333.
Easterlin, R. (1978). What will 1984 be like? Socioeconomic implications of recent twists in age structure. Demography, XV, 397-421.
Frank, R.H., and B.S. Bernanke. (2004). Principles of Microeconomics, 2nd edition. New York: McGraw-Hill.
Fuentes, J.R. (1998). Life of a Cell: Managerial Practice and Strategy in Colombian Cocaine Distribution in the United States. PhD dissertation. New York: City University of New York.
Galenianos, M., N. Persico, and R. Pacula. (2009). A Search-Theoretic Model for the Retail Market for Illicit Drugs. NBER Working Paper 14980. Cambridge, MA: National Bureau of Economic Research.
Goldstein, P., H. Brownstein, and P. Ryan. (1992). Drug-related homicide in New York: 1984 and 1988. Crime and Delinquency, 38(4), 459-476.
Grossman, M. (2004). Individual Behaviors and Substance Use: The Role of Price. NBER Working Paper. Cambridge, MA: National Bureau of Economic Research.
Grossman, M., F.J. Chaloupka, and K. Shim. (2002). Illegal drug use and public policy. Health Affairs, 21(2), 134-145.
Gruber, J., and B. Koszegi. (2001). Is addiction “rational”? Theory and evidence. Quarterly Journal of Economics, 116(4), 1,261-1,303.
Hagedorn, J. (1998). The business of drug dealing in Milwaukee. Wisconsin Policy Research Institute, 11(5).
Jacobson, M. (2004). Baby booms and drug busts: trends in youth drug use in the United States, 1975-2000. Quarterly Journal of Economics, 119(4), 1,481-1,512.
Johnson, B., P. Goldstein, E. Preble, J. Schmeidler, D. Lipton, B. Spunt, and T. Miller. (1985). Taking Care of Business: The Economics of Crime by Heroin Abusers. Lexington, MA: D.C. Heath.
Johnson, B., A. Golub, and E. Dunlap. (2000). The rise and decline of hard drugs, drug markets, and violence in inner-city New York. In A. Blumstein and J. Wallmen (Eds.), The Crime Drop in America (pp. 164-206). New York: Cambridge University Press.
Kilmer, B., and P. Reuter. (2009). Prime numbers: Doped. Foreign Policy, November/December, 34-35. Available: http://www.foreignpolicy.com/articles/2009/10/19/prime_numbers_doped [accessed August 2010].
Kuziemko, I., and S.D. Levitt. (2004). An empirical analysis of imprisoning drug offenders. Journal of Public Economics, 88(9-10), 2,043-2,066.
Levitt, S.D., and S.A. Venkatesh. (2000). An economic analysis of a drug-selling gang’s finances. Quarterly Journal of Economics, 115(3), 755-789.
Luksetich, W., and M. White. (1983). Heroin: Price elasticity and enforcement strategies. Economic Inquiry, 21, 557-564.
National Drug Intelligence Center. (2007a). Chicago High Intensity Drug Trafficking Area Drug Market Analysis. Available: http://www.justice.gov/ndic/pubs23/23482/23482p.pdf [accessed July 2010]
National Drug Intelligence Center. (2007b). Los Angeles High Intensity Drug Trafficking Area Drug Market Analysis. Available: http://www.justice.gov/ndic/pubs23/23937/distro.htm [accessed July 2010].
National Institute of Justice. (2003). 2000 Arrestee Drug Abuse Monitoring: Annual Report. Washington, DC: U.S. Department of Justice.
National Research Council. (2001). Informing America’s Policy on Illegal Drugs: What We Don’t Know Keeps Hurting Us. Committee on Data and Research for Policy on Illegal Drugs, C.F. Manski, J.V. Pepper, and C.V. Petrie (Eds.). Committee on Law and Justice and Committee on National Statistics, Commission on Behavioral and Social Sciences and Education. Washington, DC: National Academy Press.
Office of National Drug Control Policy. (2001). What America’s Users Spend on Illegal Drugs: 1988-2000. Washington, DC: Executive Office of the President.
Office of National Drug Control Policy. (2004). The Price and Purity of Illicit Drugs: 1981 Through the Second Quarter of 2003. Washington, DC: Executive Office of the President.
Orphanides, A., and D. Zervos. (1995). Rational addiction with learning and regret. Journal of Political Economy, 103(4), 739-758.
Pacula, R.L., M. Grossman, F.J. Chalupka, P.M. O’Malley, L.D. Johnston, and M.C. Farrelly. (2001). Marijuana and youth. In J. Guber (Ed.), Risky Behavior Among Youths: An Economic Analysis (pp. 271-326). Chicago, IL: University of Chicago Press.
Pacula, R.L., B. Kilmer, M. Grossman, and F. Chaloupka. (2010). Risks and prices: The role of user sanctions in marijuana markets. The B.E. Journal of Economic Analysis and Policy, 10(1), Art. 11.
Preble, E., and J.J. Casey. (1969). Taking care of business—The heroin user’s life on the street. Substance Use and Misuse, 4(1), 1-24.
Reuter, P., and J.P. Caulkins. (2004). Illegal “lemons”: Price dispersion in cocaine and heroin markets. Bulletin on Narcotics, 56, 141-165.
Reuter, P., R. MacCoun, and P. Murphy. (1990). Money from Crime: A Study of the Economics of Drug Dealing in Washington, DC. Santa Monica, CA: RAND.
Rhodes, W., P. Johnston, S. Han, Q. McMullen, and L. Hozik. (2002). Illicit Drugs: Price Elasticity of Demand and Supply. Cambridge, MA: Abt Associates.
Rhodes, W., D. Hunt, M. Chapman, R. Kling, D. Fuller, and C. Dvous. (2007). Using ADAM Data to Investigate the Effectiveness of Drug Enforcement. Cambridge, MA: Abt Associates.
Walsh, J. (2008). U.S. Drug Policy: At What Cost? Moving Beyond the Self-Defeating Supply Control Fixation. Statement before the Joint Economic Committee of the U.S. Congress, June 19.
Zinberg, N. (1984). Drug, Set, and Setting: The Basis for Controlled Intoxicant Use. New Haven, CT: Yale University Press.


