3
Furan1
Acute Exposure Guideline Levels
PREFACE
Under the authority of the Federal Advisory Committee Act (FACA) P.L. 92-463 of 1972, the National Advisory Committee for Acute Exposure Guideline Levels for Hazardous Substances (NAC/AEGL Committee) has been established to identify, review, and interpret relevant toxicologic and other scientific data and develop AEGLs for high-priority, acutely toxic chemicals.
AEGLs represent threshold exposure limits for the general public and are applicable to emergency exposure periods ranging from 10 minutes (min) to 8 hours (h). Three levels—AEGL-1, AEGL-2, and AEGL-3—are developed for each of five exposure periods (10 and 30 min and 1, 4, and 8 h) and are distinguished by varying degrees of severity of toxic effects. The three AEGLs have been defined as follows:
AEGL-1 is the airborne concentration (expressed as parts per million [ppm] or milligrams per cubic meter [mg/m3]) of a substance above which it is predicted that the general population, including susceptible individuals, could experience notable discomfort, irritation, or certain asymptomatic, nonsensory
effects. However, the effects are not disabling and are transient and reversible upon cessation of exposure.
AEGL-2 is the airborne concentration (expressed as ppm or mg/m3) of a substance above which it is predicted that the general population, including susceptible individuals, could experience irreversible or other serious, long-lasting adverse health effects, or an impaired ability to escape.
AEGL-3 is the airborne concentration (expressed as ppm or mg/m3) of a substance above which it is predicted that the general population, including susceptible individuals, could experience life-threatening health effects or death.
Airborne concentrations below the AEGL-1 represent exposure levels that could produce mild and progressively increasing but transient and nondisabling odor, taste, and sensory irritation or certain asymptomatic, nonsensory effects. With increasing airborne concentrations above each AEGL, there is a progressive increase in the likelihood of occurrence and the severity of effects described for each corresponding AEGL. Although the AEGLs represent threshold levels for the general public, including susceptible subpopulations, such as infants, children, the elderly, persons with asthma, and those with other illnesses, it is recognized that individuals, subject to idiosyncratic responses, could experience the effects described at concentrations below the corresponding AEGL.
SUMMARY
Furan is a colorless, highly flammable liquid with a strong, ethereal odor. It is used primarily as an industrial intermediate. Occupational exposure to furan is limited because it is handled in closed containers and is used in a closed system in industrial processes. The general public is typically exposed to furan on a daily basis. The chemical has been detected in cooked foods, the gas-phase component of cigarette smoke, wood smoke, exhaust gas from diesel and gasoline engines, and oils obtained by distilling rosin-containing pine wood. If furan is released, it is predicted to exist almost entirely in the vapor phase in the atmosphere because of its relatively high vapor pressure.
Quantitative toxicology data on effects after inhalation exposure to furan were limited to one study in rats. Oral administration of furan resulted in hepatocarcinogenicity and toxicity, and a number of studies determined that a reactive metabolite was responsible for most of the hepatic effects furan induced. In particular, metabolism studies indicate that furan is bioactivated in the liver to a reactive metabolite, cis-2-butene-1,4-dial, by cytochrome P-450 2E1. On the basis of a chronic oral carcinogenicity study in which clear evidence of carcinogenicity was noted in male and female rats and mice, the National Toxicology Program (NTP) classifies furan as “reasonably anticipated to be a human carcinogen” and the International Agency for Research on Cancer (IARC) lists furan as a Group 2B carcinogen (possibly carcinogenic to humans). The U.S. En-
vironmental Protection Agency (EPA) has not classified furan according to its carcinogenicity.
AEGL-1 values were not derived for furan. No human or animal data relevant to the derivation of any AEGL-1 for furan were located.
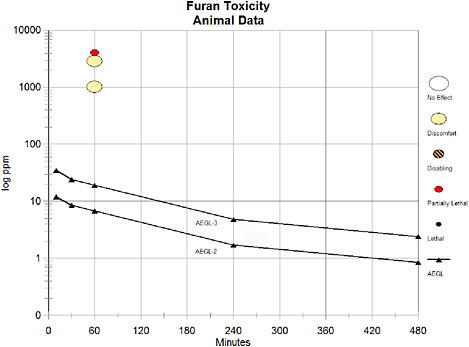
The Terrill et al. (1989) study was used as the basis for the AEGL-2 and -3 derivations. Groups of five male and five female Sprague-Dawley rats were exposed to furan for 1 h at analytic concentrations of 1,014, 2,851, or 4,049 ppm in a dynamic inhalation chamber. The rats were observed for 14 days, at which time a gross necropsy was conducted on the surviving animals. Signs of furan intoxication during exposure included respiratory distress, increased secretory response, and death. The degrees of respiratory distress and increased secretory response at each concentration (or chemical) were not provided. Body weight (b.w.) declined in the mid- and high-concentration groups (actual b.w. not provided). No treatment-related lesions were observed in surviving animals. Mortality was not observed at the low or middle concentrations, but all males and four of five females died at the high concentration. A general statement was made that “in many instances, deaths were delayed until the end of the first week and the beginning of the second week.”
The AEGL-2 derivation is based on the threshold for adverse effects in male and female rats at a concentration of 1,014 ppm for 1 h (Terrill et al. 1989). Although the severity of the clinical signs (respiratory distress, increased secretory response) was not reported, this lowest exposure group did not exhibit a decrease in b.w. as did the rats exposed to 2,851 or 4,049 ppm.
The AEGL-3 derivation is based on the highest nonlethal concentration in male and female rats of 2,851 ppm for 1 h (Terrill et al. 1989). Rats exposed to 1,014, 2,851, or 4049 ppm exhibited clinical signs, including respiratory distress and increased secretory response: however, the degree of the symptoms at each concentration was not provided. Death occurred in the highest exposure group.
For the AEGL-2 and -3 derivations, an uncertainty factor of 10 was applied for species-to-species extrapolation because there are inadequate data to properly assess interspecies variability. Terrill et al. (1989) was the only published furan toxicity study that investigated the toxicity of inhaled furan, and it evaluated only one species (rat). Therefore, insufficient empirical data were available to examine species differences in response to inhaled furan. A physiologically based pharmacokinetic (PBPK) simulation of inhalation exposure to furan predicted that the absorbed dose of furan in mice and rats would be ~10-and 3.5-fold higher, respectively, than that in humans, whereas the integrated liver exposure to furan metabolites would be ~6- and 3-fold higher, respectively, than that in humans. However, oral toxicity data indicate that rats are more sensitive than mice despite PBPK modeling predictions that mice would have a 3-fold higher absorbed dose and 2-fold higher integrated liver exposure to furan metabolites than rats. Therefore, there are too many uncertainties about the response to furan of the rat, mouse, and human liver to base an uncertainty factor on PBPK modeling predictions.
An intraspecies uncertainty factor of 3 was applied for the following reasons:
-
Assuming death was the result of a progression of the toxicity present at the lower concentrations, the steep dose-response curve for lethality indicates there is not much variability in the response (0/10 rats died at 1,014 and 2,851 ppm, whereas 9/10 rats died at 4,049 ppm). The delayed deaths in the high-concentration group suggest that hepatotoxicity was the cause of death.
-
If no hepatotoxicity is present, the clinical signs are likely due to a direct contact effect, which is not expected to vary much among individuals.
-
If hepatotoxicity is present, it is due to the reactive metabolite produced in the liver. PBPK modeling data indicate that production of the metabolite is blood flow limited. Therefore, variations in cytochrome P-450 2E1 levels are not likely to be a significant factor (Kedderis and Held 1996). Using hepatocytes as the basis, PBPK modeling indicates that when adults and children (ages 6, 10, and 14 years) are exposed to the same furan concentrations, the blood concentration of furan is likely to be greater in children than in adults by a factor of only 1.5 (at steady state), and the maximum factor of adult-child differences in liver concentration of furan metabolite is about 1.25 (Price et al. 2003).
A modifying factor of 5 was applied to account for a limited data set (only one data set addressing furan toxicity after inhalation exposure was available; this study was not repeated, and there was no information on furan toxicity in other species). Therefore, a total uncertainty factor and modifying factor of 150 was applied to the AEGL-2 and -3 values.
The experimentally derived exposure values were scaled to AEGL time-frames using the concentration-time relationship given by the equation Cn × t = k, where C = concentration, t = time, k is a constant, and n generally ranges from 0.8 to 3.5 (ten Berge et al. 1986). The value of n was not empirically derived because of insufficient data; therefore, the default value of n = 1 was used for extrapolating from shorter to longer exposure periods and a value of n = 3 was used to extrapolate from longer to shorter exposure periods.
The derived AEGL values are listed in Table 3-1.
1.
INTRODUCTION
Furan is a colorless, highly flammable liquid with a strong, ethereal odor. An odor threshold value for furan could not be located in the available literature. Furan is miscible with most organic solvents but is only slightly soluble in water. It has low boiling and flash points and is often stabilized with butylated hydroxytoluene to inhibit the formation of explosion-prone peroxides upon exposure to air (EPA 1987). Furan is produced by decarbonylation of furfural (Kottke 1991). The industrial uses of furan are predominantly as an intermediate
TABLE 3-1 Summary of AEGL Values for Furan
|
Classification |
10 min |
30 min |
1 h |
4 h |
8 h |
End Point (Reference) |
|
AEGL-1 (Nondisabling) |
NRa |
NR |
NR |
NR |
NR |
Not applicable |
|
AEGL-2 (Disabling) |
12 ppm (33 mg/m3) |
8.5 ppm (24 mg/m3) |
6.8 ppm (19 mg/m3) |
1.7 ppm (4.7 mg/m3) |
0.85 ppm (2.4 mg/m3) |
1,014 ppm for 1 h: threshold for adverse effects in rats; clinical signs: although the severity of respiratory distress and increased secretory response not reported, no decrease in body weight occurred (Terrill et al. 1989) |
|
AEGL-3 (Lethality) |
35 ppm (97 mg/m3) |
24 ppm (67 mg/m3) |
19 ppm (53 mg/m3) |
4.8 ppm (13 mg/m3) |
2.4 ppm (6.7 mg/m3) |
2,851 ppm for 1 h: threshold for lethality in rats (Terrill et al. 1989) |
|
aNR: not recommended. Numeric values for AEGL-1 are not recommended because of the lack of available data. Absence of an AEGL-1 does not imply that exposure below the AEGL-2 is without adverse effects. |
||||||
in the production of tetrahydrofuran, pyrrole, and thiophene; in the formation of lacquers and solvents for resins; in the production of pharmaceuticals; in agricultural chemicals; and in stabilizers (IARC 1995). Furan is an EPA high-production-volume chemical (revised Sept. 6, 2001), with production exceeding 1 million pounds annually. Occupational exposure to furan is predicted to be minimal as it is handled in closed containers because of its volatility, and industrial processes that use furan are conducted in closed systems (NTP 1993).
The general public is typically exposed to furan on a daily basis. The chemical has been detected in the gas-phase component of cigarette smoke, wood smoke, exhaust gas from diesel and gasoline engines, and oils obtained by distilling rosin-containing pine wood (Budavari et al. 1989; IARC 1995). Furan is also present in cooked foods: analysis of approximately 300 food samples found furan levels ranging from nondetectable (below the limits of detection of the method) to 175 parts per billion (FDA 2009). Food and Drug Administration (FDA) calculations found that mean daily furan exposure ranged from 0.26 μg/kg of b.w. per day for adults to 0.41 μg/kg/day for infants consuming baby food and 0.9 μg/kg/day for those consuming infant formula (FDA 2007). Common sources of exposure in adults include coffee, juices, snack foods, nutritional drinks, and gravies; common sources in infants (up to 1 year old) are jarred baby foods and canned infant formulas (Becalski et al. 2005; FDA 2007; Zoller et al. 2007). FDA has posted these furan data on the agency’s Web site at http://www.cfsan.fda.gov/~lrd/pestadd.html#furan. It is postulated that the primary source of furans in food is from thermal degradation and rearrangement of organic compounds, especially carbohydrates (69 CFR 25911[2004]).
If it is released, furan is predicted to exist almost entirely in the vapor phase in the atmosphere because of its relatively high vapor pressure. The primary removal mechanism during daylight is predicted to be the reaction with photochemically generated hydroxyl radicals, with an estimated half-life of 2 to 6 h (EPA 1987) or 9.5 h (Atkinson 1989). Reaction with nitrate radicals is predicted to be the primary removal mechanism during night hours (approximate half-life of 2 h) (EPA 1987).
Although furan is present in cigarette smoke (Newsome et al. 1965), no human data were available regarding acute nonlethal toxicity of this compound. The NTP report (1993) summarized possible human exposure data. While it was reported that approximately 35 employees were potentially exposed to furan at 14 plants, no further details, such as health effects, were provided.
The physicochemical data on furan are presented in Table 3-2.
TABLE 3-2 Chemical and Physical Data for Furan
|
Parameter |
Value |
Reference |
|
Synonyms |
Furfuran, oxole, tetrole, divinylene oxide, 1,4-epoxy-1,3-butadiene, oxacyclopentadiene |
Budavari et al. 1989 |
|
CAS registry number |
110-00-9 |
|
|
Chemical formula |
C4H4O |
Budavari et al. 1989 |
|
Molecular weight |
68.07 |
Budavari et al. 1989 |
|
Physical state |
Liquid |
Budavari et al. 1989 |
|
Color |
Colorless, turns brown upon standing |
Garcia and James 2000 |
|
Melting point |
−86ºC |
Garcia and James 2000 |
|
Boiling point |
31.36ºC at 760 mmHg 32ºC at 758 mmHg |
Budavari et al. 1989 |
|
Liquid density (water = 1) |
0.9371 at 19.4/4ºC |
Budavari et al. 1989 |
|
Vapor density (air = 1) |
2.36 |
Kottke 1991 |
|
Solubility |
Freely soluble in alcohol and ether; solubility in water: 1% at 25ºC |
Budavari et al. 1989 Kottke 1991 |
|
Vapor pressure |
658 mmHg at 20ºC 600 mmHg at 20ºC |
Kottke 1991 HSDB 2003 |
|
Conversion factors |
1 ppm = 2.78 mg/m3 1 mg/m3 = 0.359 ppm Calculated: ppm × molecular weight = mg/m3 at 24.45 ºC |
Garcia and James 2000 |
2.
HUMAN TOXICITY DATA
2.1.
Acute Lethality
No data were available regarding the acute lethality of furan in humans.
2.2.
Nonlethal Toxicity
No human inhalation toxicity data for furan were available.
2.3.
Developmental and Reproductive Effects
No human developmental and reproductive toxicity data concerning furan were found in the available literature.
2.4.
Genotoxicity
No human genotoxicity data on furan were found in the available literature.
2.5.
Carcinogenicity
No human data were found in the available literature regarding the carcinogenic potential of inhaled furan.
2.6.
Summary
No data were found in the available literature regarding lethal and nonlethal toxicity, developmental and reproductive toxicity, genotoxicity, and carcinogenicity of inhaled furan in humans. Although it was reported that approximately 35 employees were potentially exposed to furan at 14 plants, no further details, such as health effects, were provided.
3.
ANIMAL TOXICITY DATA
3.1.
Acute Lethality
3.1.1.
Dogs
A 10-kg dog (sex, age, and strain unspecified) was anesthetized with ether and then injected with 0.2 cubic centimeters (cm3) of furan (Koch and Cahan 1925). Blood pressure immediately decreased, followed by an increase in the amplitude of the heartbeat and a rapid recovery of blood pressure to slightly higher than the initial reading. Three more injections gave similar results. It was
concluded that furan stimulated the vagus mechanism because intravenous administration of furan after injection of 3 cm3 of 1% atropine resulted in a decrease in blood pressure but no increase in the amplitude of the heartbeat. Furan was then substituted for ether (concentration of furan and protocol for furan inhalation were not provided). Blood pressure rapidly decreased, followed by an increased amplitude of the heartbeat. Respiration then ceased, followed by cardiac arrest. Necropsy revealed marked dilation of the blood vessels in the viscera; blood that was a bright, cherry red; and hyperemic lungs. The authors concluded that the immediate cause of death was asphyxia resulting from paralysis of the medulla.
3.1.2.
Rats
Groups of five male and five female Sprague-Dawley rats were exposed for 1 h to furan vapor at analytic concentrations of 1,014, 2,851, and 4,049 ppm (Terrill et al. 1989). The vapor was generated with a bubbler, and exposures were conducted in a modified, 1-m3 Hinner’s-type, glass and stainless steel chamber (a Hinner’s-type chamber is a vertical-flow chamber with cubic exposure sections, tangential inlets, and pyramid-shaped upper and lower sections) (McClellan and Henderson 1995). An infrared analyzer was used to monitor the exposure concentrations beginning at 15 min of exposure and continuing every 5 to 15 min thereafter. Animals were observed for 14 days, at which time a gross necropsy was conducted on the surviving animals. Signs of furan intoxication during exposure included respiratory distress, increased secretory response, and death. The degrees of respiratory distress and secretory response at each concentration were not provided. Body weight decreased in the middle- and high-concentration groups (actual b.w. not provided). No exposure-related lesions were observed in surviving animals. The mortality at each concentration was recorded and is presented in Table 3-3. Mortalities were not observed at the low and middle concentrations, but all males and four of five females died at the high concentration. The 1-h LC50 (concentration with 50% lethality) values and 95% confidence intervals were 3,398 ppm (2,683 to 4,303 ppm) for males, 3,550 ppm (2,726 to 4,623 ppm) for females, and 3,464 ppm (2,905 to 4,131 ppm) for both sexes combined.
TABLE 3-3 Mortality in Sprague-Dawley Rats Exposed to Furan
|
Concentration (ppm) |
Mortalitya |
|
|
Male |
Female |
|
|
1,014 ± 36.6 |
0/5 |
0/5 |
|
2,851 ± 246.7 |
0/5 |
0/5 |
|
4,049 ± 227.8 |
5/5 |
4/5 |
|
aNumber dead/number exposed. Source: Terrill et al. 1989. Reprinted with permission; copyright 1989, American Industrial Hygiene Association. |
||
A rat was exposed to furan by inhalation via saturated cotton held over the nose (Koch and Cahan 1925). After a short struggle, the rat collapsed. There was an increase in the rate of respiration and the rat exhibited complete analgesia and relaxation lasting 2 to 3 min. The authors then stated that this experiment was repeated, but it is unclear if they meant both the exposure and the clinical signs or just the exposure. Although the rat appeared normal when replaced in its cage after treatment, it was dead the next morning.
3.1.3.
Mice
Groups of three or four Swiss mice weighing 18 to 21 grams (g) were exposed to furan vapor ranging in concentration from 10.5 to 350 ppm for 1 h (Egle and Gochberg 1979). Information about the sex of the animals, individual vapor concentrations, method of vapor analysis, and period of observation after exposure was not provided. The vapor was generated by passing air through pure furan at room temperature and then transferring it with a 100-cm3 syringe into a 5.2-liter (L) sealed glass desiccator. The 1-h LC50 was calculated to be 42 ppm. Gross necropsy revealed pulmonary inflammation and fluid accumulation, although it was not stated if these findings were limited to decedents or were also seen in survivors. Clinical signs of toxicity in mice that died during the 1-h exposure included hyperactivity for 5 to 15 min, followed by labored breathing and death soon after. As addressed by Garcia and James (2000), it is likely that hypoxia contributed to the toxicity observed in this study. According to their calculations, four mice placed in a closed system for 1 h would breathe 9.6 L of air (4 mice × 40 milliters [mL]/min × 60 min). The desiccator in which the exposure occurred was only a 5.2-L desiccator. The closed system in which the mice were exposed did not provide enough oxygen for the number of mice tested. Therefore, the mortality observed in the mice was most likely confounded by the hypoxic conditions, and the study is considered unacceptable.
3.1.4.
Rabbits
A rabbit was exposed to furan through saturated cotton held over the nose (Koch and Cahan 1925). The rabbit struggled and collapsed. As the animal became sedated, respiration ceased but the heart continued to beat. After artificial respiration, breathing returned. Furan was administered a second time, but this time, respiration could not be restored after cessation. Necropsy revealed marked dilation of the blood vessels in the viscera; blood that was a bright, cherry red; and hyperemic lungs. The authors concluded that the immediate cause of death was asphyxia resulting from paralysis of the medulla.
3.2.
Nonlethal Toxicity
Limited acute nonlethal exposure data were available on rats from furan
kinetic studies (Kedderis et al. 1993). Using a closed recirculating chamber, gas uptake studies were conducted with three male Fischer 344 (F344) rats per group, with initial furan concentrations of 100, 500, 1,050, and 3,850 ppm. From the graph provided, it appears that rats were kept in the chamber up to 6 h. In a later study, 12 male rats per group were exposed for 4 h to furan at 52, 107, or 208 ppm. The liver and blood were sampled after exposure to determine furan concentrations. These studies were designed to develop and validate a PBPK model. Therefore, no data on possible toxicity resulting from the furan exposures were provided. It appears that all rats survived the exposures as there was no mention of mortality. The authors stated that 4-h exposures to concentrations higher than 300 ppm were not simulated by the PBPK model because the exposures would probably be lethal (Kedderis and Held 1996).
3.3.
Developmental and Reproductive Effects
Data addressing the developmental and reproductive effects of furan in animals were not available.
3.4.
Genotoxicity
Furan (up to 10,000 μg per plate) tested negative for genotoxicity in Salmonella typhimurium strains TA100, TA1535, TA1537, and TA98 in the presence and absence of exogenous metabolic activation (Mortelmans et al. 1986; NTP 1993) and in the induction of sex-linked recessive lethal mutations in germ cells from male Drosophila melanogaster when administered by feeding (10,000 ppm) or injection (25,000 ppm) (NTP 1993). Furan tested positive for genotoxicity in a number of in vitro and in vivo mammalian systems: furan induced trifluorothymidine resistance in mouse L5178Y lymphoma cells in the absence of metabolic activation (concentrations of 1,139 to 3,800 μg per plate, equivalent to ~16.5 to 45 micromolars [μM]) (McGregor et al. 1988; NTP 1993); induced chromosome aberrations in Chinese hamster ovary (CHO) cells with metabolic activation at concentrations of 100 to 200 millimolars (mM) (Stich et al. 1981), while another study reported induction of chromosome aberrations and sister chromatid exchanges in CHO cells with and without metabolic activation (NTP 1993); and induced chromosomal aberrations (intraperitoneal [i.p.] concentration of 250 mg/kg) but not sister chromatid exchange (i.p. concentration up to 350 mg/kg) in bone marrow cells after i.p. injections to male B6C3F1 mice (NTP 1993). Kong et al. (1988) reported positive findings in the micronucleus test (species and route of administration not provided) but negative findings in the SOS chromotest and the umu test at furan concentrations of 400 mg/kg.
Furan tested negative for genotoxicity when evaluated in the in vivo hepatocyte DNA repair assay (Wilson et al. 1992). For this assay, unscheduled DNA repair was measured in hepatocytes that were isolated from male F344 rats after
a single gavage administration of furan at 5, 30 or 100 mg/kg or from male B6C3F1 mice after administration of 10, 50, 100, or 200 mg/kg.
3.5.
Chronic Toxicity and Carcinogenicity
No data were available assessing the potential carcinogenicity of inhaled furan. Therefore, the data addressing carcinogenicity after oral exposure are included below.
Furan was administered at doses of 0, 2, 4, or 8 mg/kg in corn oil by gavage to groups of 50 male or 50 female F344/N rats for 5 days/week for 2 years (NTP 1993). All groups of dosed rats exhibited an increased incidence of cholangiocarcinomas (males: 0/50, 43/50, 48/50, and 49/50; females: 0/50, 49/50, 50/50, and 48/50 for the 0, 2, 4, and 8-mg/kg groups, respectively). Cholangiocarcinomas were also present in animals examined at the 9- and 15-month interim evaluation. Male rats had an increased combined incidence of hepatocellular adenomas or carcinomas (1/50, 5/50, 22/50, and 35/50), while female rats had an increased incidence of hepatocellular adenomas (0/50, 2/50, 4/50, and 7/50). Nonneoplastic liver lesions that occurred in both male and female treated rats included biliary tract fibrosis, hyperplasia, chronic inflammation, proliferation and hepatocyte cytomegaly, cytoplasmic vacuolization, degeneration, nodular hyperplasia, and necrosis. An increased incidence of mononuclear cell leukemia was observed in rats treated with furan at 4 or 8 mg/kg (males: 8/50, 11/50, 17/50, and 25/50; females: 8/50, 9/50, 17/50, and 21/50). Nephropathy was observed in all dosed animals; severity increased with the dose. The nephropathy was accompanied by an associated increased incidence of parathyroid hyperplasia (renal secondary hyperparathyroidism). Treated male and female rats exhibited forestomach hyperplasia (males: 1/50, 4/49, 7/50, and 6/50; females: 0/50, 2/50, 5/50, and 5/50), and female rats had an increased incidence of subacute inflammation of the forestomach (0/50, 1/50, 5/50, and 6/50). The NTP concluded that there was clear evidence of carcinogenic activity of furan in male and female F344/N rats based on increased incidences of cholangiocarcinoma and hepatocellular neoplasms of the liver and on increased incidences of mononuclear cell leukemia.
Fifty male F344/N rats were administered furan at 30 mg/kg of b.w. in corn oil by gavage for 13 weeks and then maintained for 2 years without additional furan dosing (NTP 1993). Cholangiocarcinoma was present in all dosed animals, and hepatocellular carcinoma occurred with an overall incidence of 15%.
Groups of 50 male and 50 female B6C3F1 mice were administered furan at 0, 8, or 15 mg/kg in corn oil by gavage for 5 days/week for 2 years (NTP 1993). Treated mice had an increased incidence of hepatocellular adenomas (males: 20/50, 33/50, and 42/50; females: 5/50, 31/50, and 48/50) and carcinomas (males: 7/50, 32/50, and 34/50; females: 2/50, 7/50, and 27/50). A significant number of nonneoplastic hepatocellular lesions were also observed, including
hepatocyte cytomegaly, degeneration, necrosis, multifocal hyperplasia, cytoplasmic vacuolization and biliary tract dilation, fibrosis, hyperplasia, and inflammation. Benign pheochromocytoma and focal hyperplasia of the adrenal medulla were increased in dosed animals (benign pheochromocytoma, males: 1/49, 6/50, and 10/50; females: 2/50, 1/50, and 6/50). Male mice also exhibited an increased incidence of forestomach squamous papilloma (0/49, 1/50, and 3/50), focal inflammation of the forestomach (9/49, 13/50, and 21/50), and papillary hyperplasia of the forestomach (7/49, 14/50, and 22/50). The NTP concluded that there was clear evidence of carcinogenic activity of furan in male and female B6C3F1 mice based on increased incidences of hepatocellular neoplasms of the liver and benign pheochromocytomas of the adrenal gland. On the basis of evidence of cancer in experimental animals, NTP classifies furan as “reasonably anticipated to be a human carcinogen” (NTP 2005).
A group of 100 female B6C3F1 mice was dosed with furan at 0.5 mg/kg/day; a group of 75 mice was dosed with 1.0 mg/kg/day; and groups of 50 mice were dosed with 0, 2, 4, or 8 mg/kg/day (Moser et al. 2009). No significant, dose-related differences were observed in mortality rate or b.w. At gross necropsy, the 4- and 8-mg/kg/day dose groups had increased absolute and relative liver weight (values not given) and an increased incidence of grossly observed liver nodules (60% and 100% affected, respectively, compared with 8% for controls and 17% to 20% in the remaining dose groups). The largest nodules were observed in high-dose mice. Histopathologic examination of liver sections revealed a dose-related increase in hepatic cytotoxicity as assessed by the incidence and severity of hepatic subcapsular inflammation. Statistically significant increases were seen in the incidence of mild hepatic cytotoxicity at doses of 1.0 mg/kg/day and higher, of moderate hepatic cytotoxicity at 4 mg/kg/day and higher, and of marked hepatic cytotoxicity at 8 mg/kg/day (data provided in graph; exact values not provided). A dose-related increase was observed in the incidence of foci of altered hepatocytes, adenomas, carcinomas, and adenomas or carcinomas; the incidences generally attained statistical significance at 4 and 8 mg/kg/day. Two of the carcinomas in the high-dose group metastasized to the lung. In general, there was a dose-related decrease in the latency period or time to first tumor.
IARC (1995) concluded that there is inadequate evidence in humans of the carcinogenicity of furan and sufficient evidence in experimental animals of the carcinogenicity of furan. Therefore, IARC states that furan is possibly carcinogenic to humans (Group 2B). EPA has not classified furan as to carcinogenicity (EPA 2003).
3.6.
Summary
Quantitative inhalation toxicity data were limited to the Terrill et al. (1989) study in rats. A 1-h exposure to 1,014 or 2,851 ppm was not lethal, whereas exposure to 4,049 ppm killed 9/10 animals. Clinical signs during expo-
sure included respiratory distress and increased secretory response; however, the degree of the signs at each concentration was not provided. The study by Egle and Gochberg (1979) in which a 1-h LC50 of 42 ppm was determined in Swiss mice was unacceptable. The closed system in which the mice were exposed did not provide enough oxygen for the number of mice tested. Therefore, the mortality observed in the mice was most likely confounded by the hypoxic conditions. In a qualitative study, signs of inhalation exposure to furan included decreased blood pressure, increased amplitude of the heartbeat, and respiratory and cardiac arrest in a dog; increased respiration rate, complete analgesia, and relaxation with eventual death in a rat; and respiratory arrest in a rabbit (Koch and Cahan 1925). Necropsy of the dog and rabbit revealed visceral hemorrhage; vessel dilation; and bright, cherry red blood. The authors concluded that the animals died due to asphyxia resulting from paralysis of the medulla.
The NTP (1993) concluded that there was clear evidence of carcinogenic activity of furan in male and female F344/N rats after oral exposure based on increased incidences of cholangiocarcinoma and hepatocellular neoplasms of the liver and increased incidences of mononuclear cell leukemia. The NTP also concluded that there was clear evidence of carcinogenic activity of furan in male and female B6C3F1 mice after oral exposure based on increased incidences of hepatocellular neoplasms of the liver and benign pheochromocytomas of the adrenal gland. Therefore, NTP classifies furan as “reasonably anticipated to be a human carcinogen” (NTP 2005). IARC has listed furan as a Group 2B carcinogen (possibly carcinogenic to humans), while the EPA has not classified furan as to carcinogenicity (EPA 2003).
4.
SPECIAL CONSIDERATIONS
4.1.
Metabolism and Disposition
On the basis of indirect evidence, it was proposed that the reactive intermediate formed during oxidation of furan was a reactive aldehyde (Burka et al. 1991; Parmar and Burka 1993). Chen et al. (1995) provided evidence that furan is metabolized to the reactive aldehyde cis-2-butene-1,4-dial, which is a major hepatic, microsomal metabolite of furan. It is likely that the formation of such an intermediate is responsible for the protein binding and cytochrome P-450 inhibition that occurs after treatment with furan (Burka et al. 1991; Parmar and Burka 1993). Using rat liver microsomes from untreated and acetone-pretreated rats and human cytochrome P-450 2E1 supersomes, Peterson et al. (2005) estimated the kinetics of furan oxidation to cis-2-butene-1,4-dial; the Michaelis constants (Km) were 37.6, 18.5, and 65.1 μM, respectively; the maximum velocities (Vmax) were 2.5, 5.9, and 15.4 mmoles/min/mg of protein, respectively; and the Vmax/Km values were 0.066, 0.32, and 0.324, respectively.
Burka et al. (1991) investigated the distribution and metabolism of furan after gavage with [2,5-14C]furan at 8 mg/kg in male F344 rats. Twenty-four
hours after a single dose of [14C]furan, 40% of the radioactivity was recovered in expired air, 20% in the urine, 22% in the feces, and 19% remained in the tissues, primarily in the liver (13%). Of the 40% recovered in the expired air, 16% of the original dose was expired unchanged (11% in the first hour) and 26% was expired as CO2, indicating a ring opening with later oxidation to CO2. Most of the radioactivity remaining in the liver (80%) was associated with protein; none was associated with DNA. High-performance liquid chromatography analysis of urine collected over 24 h after a single dose revealed at least 10 unidentified metabolites.
Egle and Gochberg (1979) investigated the effects of respiratory rate and chemical concentration on respiratory tract retention of furan in dogs. Retention was determined in the total respiratory tract, lower respiratory tract, and upper respiratory tract (above the tracheal bifurcation) in groups of at least five mongrel dogs (mix of males and females weighing between 9 and 23 kg). The dogs were anesthetized with pentobarbital sodium and allowed to breathe spontaneously from a respirometer for the total and lower tract experiments, or they were artificially ventilated for the upper tract experiments. Furan vapor was generated by passing air through pure furan at room temperature, transferring the air to a recording respirometer, and diluting it to the desired concentration. The percentage of furan retained by the respiratory tract was estimated as the difference in the amount inhaled or in contact with the tissue and the amount recovered. Total respiratory tract retention of furan in the concentration range of 140 to 210 ppm varied from 91% to 95%, while lower tract retention varied from 87% to 93%. One-way (air moving to the distal end of the trachea) and two-way (air moving toward the distal end of the trachea and then back through the nose) upper respiratory tract retention values were reported to be identical, ranging between 85% and 90% (the authors did not speculate on the reason for the identical retention values). An inverse relationship between ventilation rate (between 6 and 26 inhalations per min) and retention was observed in all experiments, although the relationship did not always achieve statistical significance. The effect of concentration on total respiratory retention was also investigated, and it was found that retention increased with increasing concentrations (ranging from 80% retention for an average furan concentration of 110 ppm to 93% retention for an exposure concentration of 180 ppm). The authors did not provide a theory for the observation of increasing retention with increasing concentration over this narrow concentration range. Differences in tidal volume did not affect the total respiratory tract retention of furan.
Using freshly isolated hepatocytes from male F344 rats, Carfagna et al. (1993) demonstrated that furan induced time- and concentration-dependent cytolethality (as measured by lactate dehydrogenase leakage) and glutathione depletion at furan suspension concentrations of 4, 8, and 12 mM. When cells were exposed to the cytochrome P-450 inhibitor 1-phenylimidazole before exposure to 12 mM furan, glutathione depletion was delayed for 6 h, but cytolethality was not affected. To more closely mimic the typical in vivo exposure concentrations as predicted by a PBPK model, hepatocytes were then exposed for 1 to 4 h to 2
to 100 μM furan in suspension. Furan exposure produced time- and concentration-dependent cytolethality. Unlike exposure to higher furan concentrations, pretreatment with 1-phenylimidazole prevented both cytolethality and glutathione depletion. Conversely, hepatocytes from rats pretreated with acetone, a cytochrome P-450 2E1 inducer, showed enhanced cytolethality and glutathione depletion after exposure to furan. These results indicate that cytochrome P-450-mediated bioactivation of furan is required for cytolethality and glutathione depletion.
In vivo and in vitro furan kinetics were investigated in male F344 rats (Kedderis et al. 1993). Gas uptake studies were conducted using three rats per group, with initial furan concentrations of 100, 500, 1,050, and 3,850 ppm. Some rats were pretreated (by i.p. injection) with pyrazole, a cytochrome P-450 inhibitor, 30 min before exposure. The results showed a single saturable process following Michaelis-Menten kinetics. A Vmax of 27.0 μmoles/h and Km of 2.0 μM were estimated for a 250-g rat using a PBPK model to fit the kinetic data (the PBPK model assumed that all furan biotransformation took place in the liver and followed Michaelis-Menten kinetics). On the basis of these data, it was stated that furan biotransformation is a high-affinity process. Pretreatment with pyrazole completely inhibited furan biotransformation. To validate the PBPK model, the concentration of furan was measured in the blood and liver of rats after a 4-h inhalation exposure to furan at 52, 107, or 208 ppm (12 rats per group). The predicted levels were similar to the actual levels, with furan uptake from the 4-h inhalation exposure having a VmaxC of 69.2 μmoles/h/kg and a Km of 1.7 μM.
Furan uptake into freshly isolated rat liver hepatocytes was then determined to compare in vitro and in vivo biotransformation (Kedderis et al. 1993). Rat hepatocytes were exposed to an initial furan headspace concentration of 0.8 to 10.8 μM. Gas uptake by rat hepatocytes was also described by a single saturable process, with a Km of 0.4 μM and a Vmax of 0.018 μmoles/h/106 cells. When the kinetic parameters from the in vitro experiment were used in the PBPK model, they accurately predicted the in vivo gas uptake data. The effect of various cytochrome P-450 inhibitors on furan biotransformation was also investigated by adding cytochrome P-450 inhibitors dissolved in media to the hepatocyte suspensions immediately before the addition of furan vapor. Furan biotransformation was inhibited by many of these inhibitors, including 1-phenylimidazole, ethanol, isopropanol, dimethyl sulfoxide, N-methylpyrazole, and aminobenzotriazole, but it was not inhibited by metyrapone or SKF 525A. Furan oxidation was not influenced by pretreating rats with phenobarbital, a cytochrome P-450 2B inducer. However, pretreatment with acetone resulted in a 5-fold increase in oxidation, indicating that cytochrome P-450 2E1 is a major catalyst in the oxidation of furan.
As discussed above, Kedderis et al. (1993) demonstrated that in vitro determination of furan biotransformation kinetics in freshly isolated rat hepatocytes accurately predicted in vivo furan pharmacokinetics. Therefore, hepatocytes from male B6C3F1 mice and from three humans were exposed to various
concentrations of furan vapor to develop species-specific pharmacokinetic models for furan biotransformation (Kedderis and Held 1996). The predicted bioactivation and hepatic dosimetry for each of the three species were then compared. As in the previous rat study, furan metabolism in human hepatocytes and mice hepatocytes was described by a single saturable process following Michaelis-Menten kinetics. The hepatocytes from all three species rapidly metabolized furan with a high affinity, with mice metabolizing it the most rapidly, followed by humans and then rats. Simulations of dosimetry models were then used to predict various parameters after inhalation exposure to 10 ppm for 4 h. The predicted absorbed dose of furan (mg/kg) was greatest in mice (10-fold higher) followed by rats (3.5-fold higher) when compared with humans. This difference in absorbed dose was accounted for by the fact that humans are larger and physiologically slower than mice and rats. The liver exposure to the toxic metabolite of furan followed the same pattern. Steady-state blood concentrations were predicted to be reached approximately 1 h after inhalation exposure to furan at 10 ppm. Humans had a slightly lower predicted steady-state blood concentration than rodents. A comparison of the projected rate of furan liver perfusion with furan oxidation revealed that furan oxidation was much greater than furan delivery to the liver via blood flow in all species (13-, 24-, and 37-fold greater in rats, mice, and humans, respectively). Therefore, hepatic blood flow will be the limiting factor in the biotransformation of furan. The authors state that the initial rate of furan bioactivation is so rapid relative to hepatic blood flow that hepatic cytochrome P-450 2E1 concentrations would have to decrease almost 40-fold before the bioactivation rate would decrease below the blood-flow limitation. This finding implies that interindividual variation in human cytochrome P-450 2E1 levels will not be a factor in the bioactivation of furan.
4.2.
Mechanism of Toxicity
Furan is metabolized to the reactive aldehyde cis-2-butene-1,4-dial, a major hepatic, microsomal metabolite (Burka et al. 1991; Parmar and Burka 1993; Chen et al. 1995). In vitro work with rat hepatocytes demonstrated that furan produces time- and concentration-dependent cytolethality (Carfanga et al. 1993). Through the use of cytochrome P-450 inhibitors and inducers, it was determined that cytochrome P-450-mediated (particularly cytochrome P-450 2E1) oxidation of furan to a reactive intermediate is required for cytolethality (Carfanga et al. 1993; Kedderis et al. 1993).
The liver is the major target organ for furan-induced toxicity after oral exposure, although the kidney and other systems developed toxicity with repeated exposure at concentrations that produce significant hepatotoxicity. Hepatotoxicity was characterized by degenerative and regenerative lesions of hepatocytes and the biliary tract (NTP 1993). Degenerative lesions included cytoplasmic vacuolization, degeneration and necrosis of hepatocytes, and multifocal atrophy of the liver parenchyma (which was secondary to the necrosis of hepatocytes),
while regenerative changes included cytomegaly and multifocal hyperplasia. Biliary tract changes were noted in most of the portal areas, and included hyperplasia of the bile ducts, which was usually accompanied by fibrosis encompassing many of the hyperplastic ducts, and chronic inflammation. Rats developed changes in the biliary tract at much lower concentrations than mice. Other lesions that have been noted in rats at concentrations producing significant hepatotoxicity include nephropathy, parathyroid hyperplasia and cardiomyopathy (secondary to the increased severity of nephropathy), bone marrow hyperplasia and congestion and proliferation of hematopoietic cells in the spleen (considered secondary to the inflammatory liver lesions), and dilation of the medullary sinuses (from an altered flow of lymph fluid secondary to the extensive hepatic damage). In mice, other lesions include focal hyperplasia of the adrenal medulla, focal inflammation and papillary hyperplasia of the forestomach in male mice, and hematopoietic cell proliferation in the spleen (considered secondary to the inflammatory liver lesions).
Although there is no direct evidence that inhaled furan causes hepatotoxicity, available data make it reasonable to expect that the liver would be a target organ. To compare human furan pharmacokinetics with those of rodents, a PBPK model for inhaled furan was developed and validated in rats to predict the absorbed liver dose after inhalation exposure to defined concentrations and durations (Kedderis et al. 1993). After demonstrating that furan biotransformation kinetics determined with freshly isolated rat hepatocytes in vitro accurately predicted furan pharmacokinetics in vivo, freshly isolated mouse or human hepatocytes were used to develop a mouse- or human-specific PBPK model (Kedderis and Held 1996). To compare interspecies differences, a simulation of a 4-h inhalation exposure to furan at 10 ppm was done for mice, rats, and humans. The absorbed dose of furan (inhaled furan minus exhaled furan divided by kg b.w.) in mice and rats would be ~10- and 3.5-fold higher, respectively, than that in humans (4.1, 1.4, and 0.4 mg/kg for mice, rats, and humans, respectively), while the integrated liver exposure to furan metabolites would be ~6- and 3-fold higher, respectively, than that in humans (1,075, 480, and 168 μM for mice, rats, and humans, respectively).
Much discussion has centered on the likelihood that the hepatic carcinogenic potential of furan is not due to genotoxicity but results from cell proliferation secondary to cytotoxicity. NTP (1993) and Garcia and James (2000) are excellent references. As summarized from these references, evidence that furan affects DNA indirectly through a mechanism involving cytotoxicity and not direct interaction includes the following: furan was negative in genotoxicity assays using Salmonella; a single oral bolus administration of radiolabeled furan in rats did not produce metabolites that bound covalently to DNA; single gavage administration of furan did not result in unscheduled DNA synthesis in hepatocytes isolated from rats and mice; administration of a single dose of furan at a concentration that was carcinogenic in a 2-year bioassay resulted in cytotoxicity as measured by clinical chemistry parameters; loss of ATP from uncoupling of oxidative phosphorylation was observed in hepatocytes treated in vitro and in
mitochondria isolated from furan-exposed rats, which results in depletion of energy needed to maintain cellular membrane calcium pumps and leads to activation of cytotoxic enzymes; and administration of furan 6 or 8 h after a partial hepatectomy in rats did not result in initiation of hepatocarcinogenesis when followed by 52 weeks of promotion with oral administration of phenobarbital. The most current evidence is provided by a 2-year oral gavage study in mice by Moser et al. (2009). An association was seen among the furan-induced dose-response curve for hepatotoxicity, cell death, compensatory cell replication, and formation of liver tumors at doses of 4 mg/kg/day and higher; no tumors were produced at 0.5 or 1 mg/kg/day, concentrations that were not significantly hepatotoxic.
In contrast, evidence supporting the idea that furan could act as a direct hepatic carcinogen (genotoxic mechanism) is limited to the different patterns of mutation leading to oncogene activation that were seen in liver tumor cells from furan-exposed rodents compared with unexposed rodents and the positive results seen in some of the in vivo chromosomal aberration tests and eukaryotic cell mutation tests (such as the cultured mouse lymphoma cells, CHO cells, and B6C3F1 mice) (NTP 1993; Garcia and James 2000).
No information was found concerning a potential mechanism for the development of mononuclear cell leukemia seen in male and female rats exposed to furan.
4.3.
Structure-Activity Relationships
Although there are furan derivatives, they vary widely in toxicity, with many having different target organs. Data are insufficient to use structure-activity relationships to derive AEGL values.
4.4.
Concentration-Exposure Duration Relationship
The relationship between concentration and duration of exposure as related to lethality was examined by ten Berge et al. (1986) for approximately 20 irritant or systemically acting vapors and gases. The authors subjected the individual animal data sets to probit analysis with exposure duration and exposure concentration as independent variables. An exponential function Cn × t = k, where the value of n ranged from 0.8 to 3.5 for different chemicals was found to be an accurate quantitative descriptor for the chemicals evaluated. Approximately 90% of the values of n range from 1 to 3. Consequently, these values were selected as the reasonable lower and upper bounds of n. A value of n = 1 is used when extrapolating from shorter to longer time periods because the extrapolated values represent the most conservative approach in the absence of other data. Conversely, a value of n = 3 is used when extrapolating from longer to shorter time periods because the extrapolated values are more conservative in the absence of other data.
4.5.
Other Relevant Information
4.5.1.
Oral Toxicity Data
The LD50 (dose with 50% lethality) of furan in solution after i.p. injection was 6.94 mg/kg for Swiss mice (mix of males and females) and 5.20 mg/kg for male Sprague-Dawley rats (Egle and Gochberg 1979). An oral furan dose of 0.25 cm3 (234 mg/kg) in dogs and rabbits resulted in a copious flow of bloody saliva, vomiting (dogs), hemorrhage, and death (Koch and Cahan 1925). Intravenous furan administration of 1.5 cm3 (1.41 mg/kg) in dogs resulted in convulsions, respiratory and cardiac arrest, visceral hemorrhage, and death (Koch and Cahan 1925). A 200-g rat injected with 0.1 cm3 (94 or 470 mg/kg) of furan had respiratory arrest within 0.5 min. Noted gross effects included hyperemic condition of the liver and intestines; bright, cherry-red blood; and dilation of the blood vessels (Koch and Cahan 1925).
Acute, subchronic, and chronic oral toxicity data were available on rats and mice. The liver was the primary target organ, although the kidney and other systems developed toxicity with chronic exposure at significantly hepatotoxic concentrations. Acute oral exposure generally resulted in transient hepatotoxicity (Wilson et al. 1992). No mortality was seen at doses up to 30 mg/kg/day in rats and 50 mg/kg/day in mice, which were the highest doses tested (Wilson et al. 1992). Subacute exposure resulted in mortality in mice at doses of 40 mg/kg/day and higher and in rats at 80 mg/kg day and higher (NTP 1993). Subchronic exposure produced substantial hepatotoxicity in rats, with cholangiofibrosis and hyperplasia of the biliary tract occurring at the lowest dose tested (4 mg/kg/day). Hepatotoxicity became more severe with concentration, with liver changes including cholangiofibrosis and bile duct hyperplasia, pigmented Kupffer cells, and hepatocyte changes (degeneration, cytomegaly, necrosis, and nodular hyperplasia). Kidney lesions (tubule dilation, necrosis of tubule epithelium), thymic atrophy, and testicular or ovarian atrophy also occurred at the top doses. Similar hepatotoxic lesions were observed in dosed mice, but the lesions generally did not become significant until doses of 30 mg/kg/day and higher. Subchronic exposure to 30 mg/kg/day produced neoplasia in rats. One study reported that rats exposed for 6, 9, 12, or 13 weeks and then followed for an additional 16 months developed hepatic adenocarcinomas (Elmore and Sirica 1993), while another study found that a 13-week exposure produced cholangio-carcinoma in all dosed rats and hepatocellular carcinomas in a few rats by 2 years (NTP 1993).
Chronic oral dosing with furan resulted in neoplasia in rats and mice. At 2 years, almost all dosed rats had developed cholangiocarcinomas (at 2 mg/kg/day and higher), and male rats had an increased combined incidence of hepatocellular adenomas and carcinomas, while female rats had an increased incidence of hepatocellular adenomas (4 mg/kg/day and higher) (NTP 1993). An increased incidence of mononuclear cell leukemia was also observed in rats at 4 mg/kg/day. Nonneoplastic liver lesions included biliary tract fibrosis, hyperpla-
sia, chronic inflammation, and proliferation; hepatocyte cytomegaly, cytoplasmic vacuolization, degeneration, nodular hyperplasia, and necrosis; and pigmentation of Kupffer cells. Nephropathy was observed in all dosed animals; the severity increased with dose. Other findings were generally considered to be a secondary effect of liver or kidney damage. Mice had an increased incidence of hepatocellular adenomas and carcinomas and benign pheochromocytoma at or above 8 mg/kg/day. Nonneoplastic liver lesions included cytoplasmic vacuolization, focal hyperplasia, and mixed cell cellular infiltration; dilation of the bile duct; biliary tract chronic inflammation, fibrosis, and hyperplasia; hepatocyte cytomegaly, degeneration, and necrosis; Kupffer cell pigmentation; and focal atrophy of the liver parenchyma. The incidence of focal hyperplasia of the adrenal medulla was also increased. A dose-related increase in the incidence of hematopoietic cell proliferation in the spleen was considered secondary to the inflammatory liver lesions. In another study, no increases in neoplasia were noted in mice dosed with furan at 0.5 or 1 mg/kg/day for 2 years; a dose-related increase in the incidence of foci of altered hepatocytes, adenomas, carcinomas, and adenomas or carcinomas occurred at 2.0 mg/kg/day and higher (Moser et al. 2009). In general, there was a dose-related decrease in the latency period or time to first tumor.
4.5.2.
Sensitive Populations
Furan-induced hepatotoxicity is caused by the reactive metabolite produced in the liver. PBPK modeling data indicate that production of the metabolite is blood flow limited. Therefore, variations in cytochrome P-450 2E1 levels are not likely to be a significant factor (Kedderis and Held 1996). With hepatocytes used as the basis, PBPK modeling indicates that when adults and children (ages 6, 10, and 14 years) are exposed to the same furan concentrations, the blood concentration of furan is likely to be greater in children than in adults by a factor of only 1.5 (at steady state), and the maximum factor of adult-child differences in liver concentration of furan metabolite is about 1.25 (Price et al. 2003).
4.5.3.
Species Variability
Limited data are available to evaluate interspecies variability. Empirical inhalation toxicity data are limited to only one study, which investigated only one species (rats) (Terrill et al. 1989). A PBPK simulation of a 4-h inhalation exposure to furan at 10 ppm was done for mice, rats, and humans to compare interspecies differences in internal dose (Kedderis and Held 1996). The absorbed dose of furan in mice and rats would be ~10- and 3.5-fold higher, respectively, than that in humans, while the integrated liver exposure to furan metabolites would be ~6- and 3-fold higher, respectively, than that in humans. From these data, it would appear that mice are more sensitive to furan toxicity than rats. However, oral toxicity data indicate that the rat is more sensitive, develop-
ing cholangiofibrosis at the lowest chronic oral gavage dose of furan at 2 mg/kg/day (NTP 1993). In contrast, mice did not develop significant hepatotoxicity until approximately 4.0 mg/kg/day; hepatic effects at 2.0 mg/kg/day did not attain statistical significance (Moser et al. 2009).
5.
DATA ANALYSIS FOR AEGL-1
5.1.
Summary of Human Data Relevant to AEGL-1
No human data relevant to an AEGL-1 derivation were available.
5.2.
Summary of Animal Data Relevant to AEGL-1
No animal data relevant to an AEGL-1 derivation were available in the searched literature.
5.3.
Derivation of AEGL-1
AEGL-1 values were not derived for furan. Although a 40-mL puff of cigarette smoke was reported to contain 8.4 μg of furan (0.21 mg/L; 75 ppm), this value should not be the basis for an AEGL derivation because exposure to the puff of cigarette smoke is for too short a duration to extrapolate to the longer time periods used for AEGLs, and furan is one of many components of cigarette smoke that have the potential to cause adverse health effects. The health effects resulting from exposure to the mix of chemicals in cigarette smoke compared with the effects of exposure to furan alone are not known at this time. Therefore, AEGL-1 values were not recommended because of insufficient data (Table 3-4).
6.
DATA ANALYSIS FOR AEGL-2
6.1.
Summary of Human Data Relevant to AEGL-2
No human data relevant to the derivation of the AEGL-2 values were found in the available literature.
6.2.
Summary of Animal Data Relevant to AEGL-2
Groups of Sprague-Dawley male or female rats exposed for 1 h to furan at 1,014, 2,851, or 4,049 ppm exhibited signs of toxicity, including respiratory distress and increased secretory response; mortality was observed at the highest concentration (Terrill et al. 1989). The severity of the signs at each concentration was not provided. It was stated that b.w. decreased in the middle- and high-concentration groups, but b.w. data were not provided.
TABLE 3-4 AEGL-1 Values for Furan
|
10 min |
30 min |
1 h |
4 h |
8 h |
|
NRa |
NR |
NR |
NR |
NR |
|
aNR: Not recommended. |
||||
The exposure data on rats used to develop a PBPK model are not appropriate for use in AEGL derivations (Kedderis et al. 1993). Data from the gas-uptake studies are not appropriate because furan was introduced into the exposure chamber only at the beginning of the exposure; therefore, the exposure concentrations were not held constant over time. The other exposure data (12 rats per group exposed to furan at up to 208 ppm) are not appropriate for use in an AEGL derivation because the design of the study was not to evaluate toxicity but to validate a PBPK model; therefore, no details were provided about possible toxicity resulting from the exposures.
6.3.
Derivation of AEGL-2
The AEGL-2 derivation is based on an exposure of 1,014 ppm for 1 h in rats (Terrill et al. 1989). Although the severity of the reported clinical signs (respiratory distress, increased secretory response) was not reported, this lowest exposure concentration group did not exhibit a decrease in b.w. as did the rats exposed to 2,851 and 4,049 ppm. An uncertainty factor of 10 was applied for species-to-species extrapolation because there are inadequate data to properly assess interspecies variability. Of the published furan toxicity studies, Terrill et al. (1989) was the only study that investigated the toxicity of inhaled furan, and it evaluated only one species (rat). Therefore, insufficient empirical data were available to examine species differences in response to inhaled furan. A PBPK simulation of inhalation exposure to furan predicted that the absorbed dose of furan in mice and rats would be ~10- and 3.5-fold higher, respectively, than that in humans, while the integrated liver exposure to furan metabolites would be ~6-and 3-fold higher, respectively, than that in humans. However, oral toxicity data indicate that the rat is more sensitive than the mouse despite PBPK modeling predictions that the mouse would have a 3-fold higher absorbed dose and 2-fold higher integrated liver exposure to furan metabolites than the rat. Therefore, there are too many uncertainties about the response of the rat, mouse, and human liver to furan to base an uncertainty factor on the PBPK modeling predictions.
An intraspecies uncertainty factor of 3 was applied for the following reasons:
-
Assuming death was the result of a progression of the toxicity present at the lower concentrations, the steep dose-response curve for lethality indicates there is not much variability in the response (0/10 rats died at 1,014 or 2,851
-
ppm, while 9/10 rats died at 4,049 ppm). The delayed deaths in the high-concentration group suggest that hepatotoxicity was the cause of death.
-
If no hepatotoxicity is present, the clinical signs are likely due to a direct contact effect, which is not expected to vary much among individuals.
-
If the effect is hepatotoxicity, it is due to the reactive metabolite produced in the liver. PBPK modeling data indicate that production of the metabolite is blood flow limited. Therefore, variations in cytochrome P-450 2E1 levels are not likely to be a significant factor (Kedderis and Held 1996). Using hepatocytes as the basis, PBPK modeling indicates that when adults and children (ages 6, 10, and 14 years) are exposed to the same furan concentrations, the blood concentration of furan is likely to be greater in children than in adults by a factor of only 1.5 (at steady state), and the maximum factor of adult-child differences in the liver concentration of furan metabolites is about 1.25 (Price et al. 2003).
A modifying factor of 5 was applied to account for a limited data set (only one data set addressing furan toxicity after inhalation exposure was available); this study was not repeated, and there was no information on furan inhalation toxicity in other species. Therefore, a total uncertainty factor and modifying factor of 150 was applied to the AEGL-2 value.
The experimentally derived exposure values were then scaled to AEGL timeframes by using the concentration-time relationship given by the equation Cn × t = k, where C = concentration, t = time, k is a constant, and n generally ranges from 0.8 to 3.5 (ten Berge et al. 1986). The value of n was not empirically derived because of insufficient data; therefore, a default value of n = 1 was used for extrapolating from shorter to longer exposure periods and a value of n = 3 was used to extrapolate from longer to shorter exposure periods.
AEGL-2 values are presented in Table 3-5.
7.
DATA ANALYSIS FOR AEGL-3
7.1.
Summary of Human Data Relevant to AEGL-3
No human data were available for derivation of AEGL-3 values.
7.2.
Summary of Animal Data Relevant to AEGL-3
Terrill et al. (1989) determined 1-h LC50 values from Sprague-Dawley rats exposed to furan at 1,014, 2,851, and 4,049 ppm. The 1-h LC50 for male rats was 3,398 ppm, for female rats was 3,550 ppm, and for males and females combined was 3,464 ppm. The dose-response curve, however, was such that no deaths occurred at 1,014 or 2,851 ppm, but 9/10 died at 4,049 ppm. Exposed rats exhibited clinical signs, including respiratory distress and increased secretory response as well as decreased b.w.; however, the degree of the signs and actual
TABLE 3-5 AEGL-2 Values for Furan
|
10 min |
30 min |
1 h |
4 h |
8 h |
|
12 ppm (33 mg/m3) |
8.5 ppm (24 mg/m3) |
6.8 ppm (19 mg/m3) |
1.7 ppm (4.7 mg/m3) |
0.85 ppm (2.4 mg/m3) |
b.w. values at each concentration were not provided. The study, which determined a 1-h LC50 value of 42 ppm in Swiss mice, was inappropriate for use in deriving an AEGL because the exposure methods were unacceptable (see Section 3.1.3) (Egle and Gochberg 1979).
The rat exposure data used to develop a PBPK model are not appropriate for use in AEGL derivations (Kedderis et al. 1993). Data from the gas uptake studies are not appropriate because furan was introduced into the exposure chamber only at the beginning of the exposure; therefore, the exposure concentrations were not held constant over time. The other exposure data (12 rats per group exposed to furan at up to 208 ppm) are not appropriate for use in an AEGL derivation because the design of the study was not to evaluate toxicity but rather to validate a PBPK model; therefore, no details were provided about possible toxicity resulting from the exposures.
7.3.
Derivation of AEGL-3
The AEGL-3 derivation is based on the highest nonlethal concentration in male and female rats of 2,851 ppm for 1 h (Terrill et al. 1989). An uncertainty factor of 10 was applied for species-to-species extrapolation because there are inadequate data to properly assess interspecies variability. Of the published furan toxicity studies, Terrill et al. (1989) was the only one that investigated the toxicity of inhaled furan, and it evaluated only one species (rat). Therefore, insufficient empirical data were available to examine species differences in response to inhaled furan. A PBPK simulation of inhalation exposure to furan predicted that the absorbed dose of furan in mice and rats would be ~10- and 3.5-fold higher, respectively, than that in humans, while the integrated liver exposure to furan metabolites would be ~6- and 3-fold higher, respectively, than that in humans. However, oral toxicity data indicate that the rat is more sensitive than the mouse despite PBPK modeling predictions that the mouse would have a 3-fold higher absorbed dose and 2-fold higher integrated liver exposure to furan metabolites than the rat. Therefore, there are too many uncertainties about the response of the rat, mouse, and human liver to furan to base an uncertainty factor on the PBPK modeling predictions.
An intraspecies uncertainty factor of 3 was applied for the following reasons:
-
Assuming death was the result of a progression of the toxicity present at the lower concentrations, the steep dose-response curve for lethality indicates there is not much variability in the response (0/10 rats died at 1,014 and 2,851
-
ppm, while 9/10 rats died at 4,049 ppm). The delayed deaths in the high-concentration group suggest that hepatotoxicity was the cause of death.
-
If no hepatotoxicity is present, the clinical signs are likely due to a direct contact effect and are not expected to vary much among individuals.
-
If the effect is hepatotoxicity, it is due to the reactive metabolite produced in the liver. PBPK modeling data indicate that production of the metabolite is blood flow limited. Therefore, variations in cytochrome P-450 2E1 levels are not likely to be a significant factor (Kedderis and Held 1996). With hepatocytes used as the basis, PBPK modeling indicates that when adults and children (ages 6, 10, and 14 years) are exposed to the same furan concentrations, the blood concentration of furan is likely to be greater in children than in adults by a factor of only 1.5 (at steady state), and the maximum factor of adult-child differences in liver concentration of furan metabolite is about 1.25 (Price et al. 2003).
A modifying factor of 5 was applied to account for a limited data set (only one data set addressing furan toxicity after inhalation exposure was available); this study was not repeated, and there was no information on furan toxicity in other species. Therefore, a total uncertainty factor and modifying factor of 150 was applied to the AEGL-3 value.
The experimentally derived exposure values were then scaled to AEGL timeframes using the concentration-time relationship given by the equation Cn × t = k, where C = concentration, t = time, k is a constant, and n generally ranges from 0.8 to 3.5 (ten Berge et al. 1986). The value of n was not empirically derived because of insufficient data; therefore, a default value of n = 1 was used for extrapolating from shorter to longer exposure periods and a value of n = 3 was used to extrapolate from longer to shorter exposure periods. AEGL-3 values are presented in Table 3-6.
A quantitative carcinogenicity risk assessment for a single exposure to furan was not considered appropriate. Data indicate that furan is a threshold carcinogen dependent on cell proliferation secondary to cytotoxicity at the target site. Therefore, a one-time exposure to furan would not be expected to result in tumor development. This probability is supported by a study in rats and mice administered a single oral gavage dose of 30 or 50 mg/kg/day, respectively, and sacrificed at 12 h or 1, 2, 4, or 8 days postexposure to assess hepatotoxicity (Wilson et al. 1992). Hepatotoxicity (as assessed by increases in liver enzyme activity, hepatocellular proliferation, and histopathology changes) peaked between 1 and 2 days postexposure. By 8 days postexposure, the liver had returned to near normal in the mice and rats, except that rats had some small foci of inflammation and some scarring.
TABLE 3-6 AEGL-3 Values for Furan
|
10 min |
30 min |
1 h |
4 h |
8 h |
|
35 ppm (97 mg/m3) |
24 ppm (67 mg/m3) |
19 ppm (53 mg/m3) |
4.8 ppm (13 mg/m3) |
2.4 ppm (6.7 mg/m3) |
8.
SUMMARY OF AEGLs
8.1.
AEGL Values and Toxicity End Points
A summary of the AEGL values for furan is presented in Table 3-7. AEGL-3 values are derived from the highest nonlethal concentration in rats, AEGL-2 values are based on the threshold for adverse effects in rats, and insufficient data were available to derive AEGL-1 values.
8.2.
Comparisons with Other Standards
No occupational standards currently exist for furan. NTP (1993) postulates that it is because occupational exposure to furan should be minimal as it is used and handled in closed systems and containers (NTP 1993). A workplace environmental exposure level (WEEL) is not recommended by the American Industrial Hygiene Association (AIHA 1993) because of the highly toxic and carcinogenic potencies of furan and the lack of a no-observable-effect level for these effects (AIHA 1993). Instead, the recommended WEEL guide states that “worker exposure by all routes should be minimized to the fullest extent possible”. The 1-h AEGL-2 value of 6.8 ppm is slightly higher than the 1-h spacecraft maximum allowable concentration (SMAC) of 4 ppm, which is based on an estimated no-observed-adverse-effect level (NOAEL) for hepatoxicity in rats (Garcia and James 2000). Calculation of the SMAC value is as follows: the 1-h LC50 of 3,500 ppm (9,700 mg/m3) calculated by Terrill et al. (1989) was used as the basis for deriving an acceptable concentration for hepatoxicity. This value was extrapolated to a nonhepatotoxic concentration by adjusting with the minute volume for rats and the respiratory retention estimated from dogs and comparing with the oral NOAEL. This value was then adjusted by a total factor of 900 (30 for extrapolation from an LC50 to a NOAEL, 3 for interspecies extrapolation, and 10 to account for inadequate database).
TABLE 3-7 Summary of AEGL Values for Furan
|
Classification |
10 min |
30 min |
1 h |
4 h |
8 h |
|
AEGL-1 (Nondisabling) |
NRa |
NR |
NR |
NR |
NR |
|
AEGL-2 (Disabling) |
12 ppm (33 mg/m3) |
8.5 ppm (24 mg/m3) |
6.8 ppm (19 mg/m3) |
1.7 ppm (4.7 mg/m3) |
0.85 ppm (2.4 mg/m3) |
|
AEGL-3 (Lethal) |
35 ppm (97 mg/m3) |
24 ppm (67 mg/m3) |
19 ppm (53 mg/m3) |
4.8 ppm (13 mg/m3) |
2.4 ppm (6.7 mg/m3) |
|
aNR, not recommended. Numeric values for AEGL-1 are not recommended because of the lack of available data. Absence of an AEGL-1 does not imply that exposure below the AEGL-2 is without adverse effects. |
|||||
8.3.
Data Adequacy and Research Needs
Quantitative inhalation toxicology data in animals were limited to one study in rats. Much of the literature on furan focused on metabolism and disposition. Research needs are many and include acute inhalation toxicity studies including gross and microscopic examination of exposed animals, inhalation data on multiple species, inhalation developmental and reproductive toxicity studies, and carcinogenicity evaluations after inhalation of furan. Detailed inhalation studies would elucidate whether the target organ is primarily the liver (as it is after oral or i.p. administration) or if other organs are also affected. The studies would also determine whether inhalation exposure to furan produces a direct contact effect, such as irritation.
9.
REFERENCES
AIHA (American Industrial Hygiene Association). 1993. Workplace Environmental Exposure Level Guide: Furan. Fairfax, VA: AIHA Press.
Atkinson, R. 1989. Kinetics and Mechanisms of the Gas-Phase Reactions of the Hydroxyl Radical with Organic Compounds. Journal of Physical and Chemical Reference Data Monograph No. 1 [online]. Available: http://www.nist.gov/srd/PDFfiles/jpcrdM1.pdf [accessed Mar. 25, 2010].
Becalski, A., D. Forsyth, V. Casey, B.P. Lau, K. Pepper, and S. Seaman. 2005. Development and validation of a headspace method for determination of furan in food. Food Addit. Contam. 22(6):535-540.
Budavari, S., M.J. O'Neil, A. Smith, and P.E. Heckelman, eds. 1989. Furan. P. 672 in The Merck Index: An Encyclopedia of Chemicals, Drugs, and Biologicals, 11th Ed. Rahway, NJ: Merck.
Burka, L.T., K.D. Washburn, and R.D. Irwin. 1991. Disposition of [14C]furan in the male F344 rat. J. Toxicol. Environ. Health 34(2):245-257.
Carfagna, M.A., S.D. Held, and G.L. Kedderis. 1993. Furan-induced cytolethality in isolated rat hepatocytes: Correspondence with in vivo dosimetry. Toxicol. Appl. Pharmacol. 123(2): 265-273.
Chen, L.J., S.S. Hecht, and L.A. Peterson. 1995. Identification of cis-2-butene-1,4-dial as a microsomal metabolite of furan. Chem. Res. Toxicol. 8(7):903-906.
Egle, J.L., and B.J. Gochberg. 1979. Respiratory retention and acute toxicity of furan. Am. Ind. Hyg. Assoc. J. 40(4):310-314.
Elmore, L.W., and A.E. Sirica. 1993. “Intestinal-type” of adenocarcinoma preferentially induced in right/caudate liver lobes of rats treated with furan. Cancer Res. 53(2):254-259.
EPA (U.S. Environmental Protection Agency). 1987. Health and Environmental Effects Document for Furan. ECAO-CIN-G020. Environmental Criteria and Assessment Office, Office of Health and Environmental Assessment, U.S. Environmental Protection Agency, Cincinnati, OH.
EPA (U.S. Environmental Protection Agency). 2003. Furan (CASRN 110-00-9). Integrated Risk Information System, U.S. Environmental Protection Agency [online]. Available: http://www.epa.gov/IRIS/subst/0056.htm [accessed Mar. 30, 2010].
FDA (U.S. Food and Drug Administration). 2007. An Updated Exposure Assessment for Furan from the Consumption of Adult and Baby Foods, April 18, 2007. U.S. Department of Health and Human Services, Food and Drug Administration [online]. Available: http://www.fda.gov/Food/FoodSafety/FoodContaminantsAdulteration/ChemicalCo ntaminants/Furan/ucm110770.htm [accessed Mar. 25, 2010].
FDA (U.S. Food and Drug Administration). 2009. Exploratory Data on Furan in Food: Individual Food Products. U.S. Department of Health and Human Services, Food and Drug Administration [online]. Available: http://www.fda.gov/Food/FoodSafe ty/FoodContaminantsAdulteration/ChemicalContaminants/Furan/UCM078439 [accessed mar. 25, 2010].
Garcia, H.D., and J.T. James. 2000. Furan. Pp. 307-329 in Spacecraft Maximum Allowable Concentrations for Selected Airborne Contaminants, Vol. 4. Washington, DC: National Academy Press.
HSDB (Hazardous Substances Data Bank). 2003. Furan (CAS No 110-00-9). TOXNET, Specialized Information Services, U.S. National Library of Medicine, Bethesda, MD [online]. Available: http://toxnet.nlm.nih.gov/cgi-bin/sis/htmlgen?HSDB [accessed Mar. 25, 2010].
IARC (International Agency for Research on Cancer). 1995. Pp. 393-407 in Dry Cleaning, Some Chlorinated Solvents, and Other Industrial Chemicals, IARC Monographs on the Evaluation of Carcinogenic Risks to Humans Vol. 63. Lyon, France: International Agency for Research on Cancer.
Kedderis, G.L., and S.D. Held. 1996. Prediction of furan pharmacokinetics from hepatocyte studies: Comparison of bioactivation and hepatic dosimetry in rats, mice, and humans. Toxicol. Appl. Pharmacol. 140(1):124-130.
Kedderis, G.L., M.A. Carfagna, S.D. Held, R. Batra, J.E. Murphy, and M.L. Gargas. 1993. Kinetic analysis of furan biotransformation by F-344 rats in vivo and in vitro. Toxicol. Appl. Pharmacol. 123(2):274-282.
Koch, E.M., and M.H. Cahan. 1925. Physiologic action of furane. J. Pharmacol. Exp. Ther. 26(4):281-285.
Kong, Z.L., M. Mitsuiki, M. Nonaka, and H. Omura. 1988. Mutagenic activities of furfurals and the effects of Cu2+ [abstract]. Mutat. Res. 203:376.
Kottke, R.H. 1991. Furan derivatives. Pp. 155-183 in Kirk-Othmer Encyclopedia of Chemical Technology, 4th Ed., Vol. 23. New York: John Wiley and Sons.
McClellan, R.O., and R.F. Henderson, eds. 1995. Pp. 33-36 in Concepts in Inhalation Toxicology, 2nd Ed. Washington, DC: Taylor and Francis.
McGregor, D.B., A. Brown, P. Cattanach, I. Edwards, D. McBride, C. Riach, and W.J. Caspary. 1988. Responses of the L5178Y tk+/tk- mouse lymphoma cell forward mutation assay: III. 72 coded chemicals. Environ. Mol. Mutagen. 12(1):85-154.
Mortelmans, K., S. Haworth, T. Lawlor, W. Speck, B. Tainer, and E. Zeiger. 1986. Salmonella mutagenicity tests: II. Results from the testing of 270 chemicals. Environ. Mutagen. 8(Suppl. 7):1-119.
Moser, G.J., J. Foley, M. Burnett, T.L. Goldsworthy, and R. Maronpot. 2009. Furan-induced dose-response relationships for liver cytotoxicity, cell proliferation, and tumorigenicity (furan-induced liver tumorigenicity). Exp. Toxicol. Pathol. 61(2): 101-111.
Newsome, J.R., V. Norman, and C.H. Keith. 1965. Vapor phase analysis of tobacco smoke. Tobacco Sci. 9:102-110.
NRC (National Research Council). 1993. Guidelines for Developing Community Emergency Exposure Levels for Hazardous Substances. Washington, DC: National Academy Press.
NRC (National Research Council). 2001. Standing Operating Procedures for Developing Acute Exposure Guideline Levels for Hazardous Chemicals. Washington, DC: National Academy Press.
NTP (National Toxicology Program). 1993. Toxicology and Carcinogenesis Studies of Furan (CAS No. 110-00-9) in F344/N Rats and B6C3F1 Mice (Gavage Studies). NTP TR 402. NIH 93-2857. U.S. Department of Health and Human Services, Public Health Service, National Institute of Health, National Toxicology Program, Research Triangle Park, NC.
NTP (National Toxicology Program). 2005. Furan in Report on Carcinogens, 11th Ed. U.S. Department of Health and Human Services, Public Health Service, National Toxicology Program [online]. Available: http://ntp.niehs.nih.gov/ntp/roc/eleventh/profiles/s090fura.pdf [accessed Mar. 25, 2010].
Parmar, D., and L.T. Burka. 1993. Studies on the interaction of furan with hepatic cytochrome P-450. J. Biochem. Toxicol. 8(1):1-9.
Peterson, L.A., M.E. Cummings, C.C. Vu, and B.A. Matter. 2005. Glutathione trapping to measure microsomal oxidation of furan to cis-2-butene-1, 4-dial. Drug Metab. Dispos. 33(10):1453-1458.
Price, K., S. Haddad, and K. Krishnan. 2003. Physiological modeling of age-specific changes in the pharmacokinetics of organic chemicals in children. J. Toxicol. Environ. Health A 66(5):417-433.
Stich, H.F., M.P. Rosin, C.H. Wu, and W.D. Powrie. 1981. Clastogenicity of furans found in food. Cancer Lett. 13(2):89-95.
ten Berge, W.F., A. Zwart, and L.M. Appelman. 1986. Concentration-time mortality response relationship of irritant and systemically acting vapours and gases. J. Hazard. Mater. 13(3): 301-309.
Terrill, J.B., W.E. Van Horn, D. Robinson, and D.L. Thomas. 1989. Acute inhalation toxicity of furan, 2-methylfuran, furfuryl alcohol, and furfural in the rat. Am. Ind. Hyg. Assoc. J. 50(5):A359-A361.
Wilson, D.M., T.L. Goldsworthy, J.A. Popp, and B.E. Butterworth. 1992. Evaluation of genotoxicity, pathological lesions, and cell proliferation in livers of rats and mice treated with furan. Environ. Mol. Mutagen. 19(3):209-222.
Zoller, O., F. Sager, and H. Reinhard. 2007. Furan in food: Headspace method and product survey. Food Addit. Contam. 24(Suppl. 1):91-107.
APPENDIX A
DERIVATION OF AEGL VALUES FOR FURAN
Derivation of AEGL-1
|
10-min AEGL-1: |
Not recommended based on insufficient data |
|
30-min AEGL-1: |
Not recommended based on insufficient data |
|
1-h AEGL-1: |
Not recommended based on insufficient data |
|
4-h AEGL-1: |
Not recommended based on insufficient data |
|
8-h AEGL-1: |
Not recommended based on insufficient data |
Derivation of AEGL-2
|
Key study: |
Terrill et al. 1989 |
|
Toxicity end point: |
Exposure concentration of 1,014 ppm for 1 h in rats (Terrill et al. 1989). Although the severity of the reported clinical signs (respiratory distress, increased secretory response) was not reported, this lowest exposure concentration group did not exhibit a decrease in b.w. like the rats exposed to 2,851 or 4,049 ppm. |
|
Time-scaling: |
Cn × t = k (this document; default of n = 1 for shorter to longer exposure periods and n = 3 for longer to shorter exposure periods) |
|
Uncertainty factors: |
10 for interspecies variability 3 for intraspecies variability |
|
Modifying factor: |
5 for limited data set |
|
Total uncertainty factors and modifying factor: |
150 |
|
Calculations: |
C/uncertainty factors)n × t = k (1,014 ppm/150)1 × 1 h = 6.76 ppm-h (1,014 ppm/150)3 × 1 h = 308.9 ppm-h |
|
10-min AEGL-2: |
C3 × 0.167 h = 308.9 ppm-h C3 = 1,849.7 ppm C = 12.3 ppm = 12 ppm |
|
30-min AEGL-2: |
C3 × 0.5 h = 308.9 ppm-h C3 = 617.8 ppm C = 8.5 ppm |
|
1-h AEGL-2: |
C × 1 h = 6.76 ppm-h C = 6.76 ppm C = 6.8 ppm |
|
4-h AEGL-2: |
C1 × 4 h = 6.76 ppm-h C1 = 1.69 ppm C = 1.7 ppm |
|
8-h AEGL-2: |
C1 × 8 h = 6.76 ppm-h C1 = 0.845 ppm C = 0.85 ppm |
Derivation of AEGL-3
|
Key study: |
Terrill et al. 1989 |
|
Toxicity end point: |
Highest nonlethal exposure concentration in rats of 2,851 ppm for 1 h |
|
Time-scaling: |
Cn × t = k (this document; default of n = 1 for shorter to longer exposure periods and n = 3 for longer to shorter exposure periods) |
|
Uncertainty factors: |
10 for interspecies variability 3 for intraspecies variability |
|
Modifying factor: |
5 for limited data set |
|
Combined uncertainty factors and modifying factor: |
150 |
|
Calculations: |
(C/uncertainty factors)n × t = k [(2,851 ppm)/150]1 × 1 h = 19.01 ppm-h [(2,851 ppm)/150]3 × 1 h = 6866.2 ppm-h |
|
10-min AEGL-3: |
C3 × 0.167 h = 6866.2 ppm-h C3 = 41,114.97 ppm C = 34.5 ppm = 35 ppm |
|
30-min AEGL-3: |
C3 × 0.5 h = 6866.2 ppm-h C3 = 13,732.4 ppm C = 23.9 ppm = 24 ppm |
|
1-h AEGL-3: |
C × 1 h = 19.01 ppm-h C = 19.01 ppm C = 19 ppm |
|
4-h AEGL-3: |
C1 × 4 h = 19.01 ppm-h C1 = 4.75 ppm C = 4.8 ppm C1 × 8 h = 19.01 ppm-h C1 = 2.376 ppm C = 2.4 ppm |
APPENDIX B
ACUTE EXPOSURE GUIDELINE LEVELS FOR FURAN
Derivation Summary for Furan
AEGL-1 VALUES
|
10 min |
30 min |
1 h |
4 h |
8 h |
|
Not recommended |
Not recommended |
Not recommended |
Not recommended |
Not recommended |
|
Reference: Not applicable |
||||
|
Test Species/Strain/Number: Not applicable |
||||
|
Exposure Route/Concentrations/Durations: Not applicable |
||||
|
Effects: Not applicable |
||||
|
End Point/Concentration/Rationale: Not applicable |
||||
|
Uncertainty Factors/Rationale: Not applicable |
||||
|
Modifying Factor: Not applicable |
||||
|
Animal to Human Dosimetric Adjustment: Not applicable |
||||
|
Time-scaling: Not applicable |
||||
|
Data Adequacy: Insufficient data to propose AEGL values |
||||
AEGL-2 VALUES
|
10 min |
30 min |
1 h |
4 h |
8 h |
|
12 ppm |
8.5 ppm |
6.8 ppm |
1.7 ppm |
0.85 ppm |
|
Reference: Terrill, J.B., W.E. Van Horn, D. Robinson, and D.L. Thomas. 1989. Acute inhalation toxicity of furan, 2 methylfuran, furfuryl alcohol, and furfural in the rat. Am. Ind. Hyg. Assoc. J. 50(5):A359-A361. |
||||
|
Test Species/Strain/Number: Sprague-Dawley rats, 5/sex/exposure group |
||||
|
Exposure Route/Concentrations/Durations: 1,014, 2,851, and 4,049 ppm for 1 h |
||||
|
Effects: Signs of toxicity during exposure included respiratory distress, increased secretory response (severity at each concentration not provided). 1,014 ppm: 0/10 died, no changes in b.w. 2,851 ppm: 0/10 died, decreased b.w. 4,049 ppm: 9/10 died, decreased b.w. |
||||
|
End Point/Concentration/Rationale: Exposure concentration of 1,014 ppm for 1 h in rats. Although the severity of the reported clinical signs (respiratory distress, increased secretory response) was not reported, this lowest exposure concentration group did not exhibit a decrease in b.w. like the rats exposed to 2,851 and 4,049 ppm. |
||||
|
Total Uncertainty Factor and Modifying Factor = 150 |
||||
|
10 min |
30 min |
1 h |
4 h |
8 h |
|
12 ppm |
8.5 ppm |
6.8 ppm |
1.7 ppm |
0.85 ppm |
|
Uncertainty Factors and Rationale: |
||||
|
Interspecies: 10; applied because there are inadequate data to properly assess interspecies variability. Terrill et al. (1989) was the only published furan toxicity study that investigated the toxicity of inhaled furan, and it evaluated only one species (rat). Therefore, insufficient empirical data were available to examine species differences in response to inhaled furan. A PBPK simulation of inhalation exposure to furan predicted that the absorbed dose of furan in mice and rats would be ~10- and 3.5-fold higher, respectively, than that in humans, while the integrated liver exposure to furan metabolites would be ~6- and 3-fold higher, respectively, than that in humans. However, oral toxicity data indicate that the rat is more sensitive than the mouse despite PBPK modeling predictions that the mouse would have a 3-fold higher absorbed dose and 2-fold higher integrated liver exposure to furan metabolites than the rat. Therefore, there are too many uncertainties about the response of the rat, mouse, and human liver to furan to base an uncertainty factor on the PBPK modeling predictions. Intraspecies: 3; applied for the following reasons:
|
||||
|
Modifying Factor: 5; applied to account for a limited data set (only one data set addressing furan toxicity after inhalation exposure was available). This study was not repeated, and there was no information on furan toxicity in other species. |
||||
|
Animal to Human Dosimetric Adjustment: Not applicable |
||||
|
Time-scaling: Cn × t = k, where the default value of n = 1 was used for extrapolating from shorter to longer exposure periods and a value of n = 3 was used to extrapolate from longer to shorter exposure periods. |
||||
|
Data Adequacy: Only limited data were available to assess the inhalation toxicity of furan. |
||||
AEGL-3 VALUES
|
10 min |
30 min |
1 h |
4 h |
8 h |
|
35 ppm |
24 ppm |
19 ppm |
4.8 ppm |
2.4 ppm |
|
Reference: Terrill, J.B., W.E. Van Horn, D. Robinson, and D.L. Thomas. 1989. Acute inhalation toxicity of furan, 2 methylfuran, furfuryl alcohol, and furfural in the rat. Am. Ind. Hyg. Assoc. J. 50(5):A359-A361. |
||||
|
Test Species/Strain/Number: Sprague-Dawley rats, 5/sex/exposure group |
||||
|
Exposure Route/Concentrations/Durations: 1,014, 2,851, and 4,049 ppm for 1 h |
||||
|
Effects: Signs of toxicity during exposure included respiratory distress, increased secretory response (severity at each concentration not provided). |
||||
|
1,014 ppm: 0/10 died 2,851 ppm: 0/10 died 4,049 ppm: 9/10 died |
||||
|
End Point/Concentration/Rationale: Highest nonlethal concentration in rats |
||||
|
Total Uncertainty Factor and Modifying Factor = 150 |
||||
|
Uncertainty Factors and Rationale: |
||||
|
Interspecies: 10; applied because there are inadequate data to properly assess interspecies variability. Terrill et al. (1989) was the only published furan toxicity study that investigated the toxicity of inhaled furan, and it evaluated only one species (rat). Therefore, insufficient empirical data were available to examine species differences in response to inhaled furan. A PBPK simulation of inhalation exposure to furan predicted that the absorbed dose of furan in mice and rats would be ~10- and 3.5-fold higher, respectively, than that in humans, while the integrated liver exposure to furan metabolites would be ~6- and 3-fold higher, respectively, than that in humans. However, oral toxicity data indicate that the rat is more sensitive than the mouse despite PBPK modeling predictions that the mouse would have a 3-fold higher absorbed dose and 2-fold higher integrated liver exposure to furan metabolites than the rat. Therefore, there are too many uncertainties about the response of the rat, mouse, and human liver to furan to base an uncertainty factor on the PBPK modeling predictions. Intraspecies: 3; applied for the following reasons:
|
||||
|
10 min |
30 min |
1 h |
4 h |
8 h |
|
35 ppm |
24 ppm |
19 ppm |
4.8 ppm |
2.4 ppm |
|
Modifying Factor: 5; applied to account for a limited data set (only one data set addressing furan toxicity after inhalation exposure was available; this study was not repeated; there was no information on furan toxicity in other species. |
||||
|
Animal to Human Dosimetric Adjustment: Not applicable |
||||
|
Time-scaling: Cn × t = k, where the default value of n = 1 was used for extrapolating from shorter to longer exposure periods and a value of n = 3 was used to extrapolate from longer to shorter exposure periods. |
||||
|
Data Adequacy: Only limited data were available to assess the inhalation toxicity of furan. |
||||