
Hydraulic Fracture Microseismic Monitoring
During a hydraulic fracture operation, very small earthquakes (M -4 to 0) (microseismic events) are induced from the high-pressure injection of fluids into the subsurface. These “microearthquakes” are thought to be caused by the increase in pore pressure leaking off into rock surrounding the hydraulic fracture. The increased pore pressure causes small natural fractures in the formation to slip, causing microearthquakes. These microearthquakes are thousands of times smaller than a typical earthquake that can be felt by humans. Recording and location analysis of microseismicity requires specialized seismic sensing equipment and processing algorithms. The location and size of the microseismicity are used by oil and gas operators to help determine the geometry of hydraulic fractures in the formation. Microseismic mapping is a very useful tool in planning fieldwide well development programs, such as horizontal well direction and the spacing between wells, as well as aiding the design of hydraulic fracturing procedures, such as injection rate and fluid volume. Microseismic data are acquired with either an array of seismic instruments (geophones or accelerometers) in one or multiple wellbores, or with a large number (100 to more than 1,000) of geophones near or on the surface (Figure I.1). Specialized data processing techniques are used to precisely locate the microseismic events in time and space and to compute source parameters such as seismic moment, magnitude, and moment tensors, if the data are adequate.
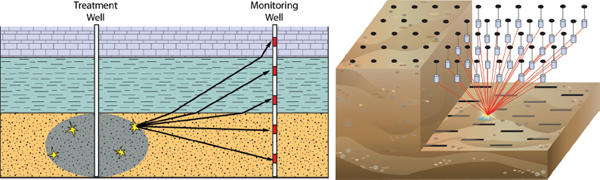
FIGURE 1.1 Diagram demonstrating microseismic monitoring of a hydraulic fracture. The hydraulic fracture induces microearthquakes that are recorded with seismometers in a nearby well bore (left) or a large number of seismometer instruments placed on or near the surface (right). SOURCE: Left, courtesy MEQ Geo Inc.; right, courtesy of MicroSeismic, Inc.
The hydraulic fractures typically propagate parallel to the maximum stress direction in the reservoir. In areas of low stress differences, the hydraulic fracture pattern can be quite complex, as there is no preferential direction for the fracture to grow, in contrast with areas of high stresses, where the hydraulic fracture grows parallel to the maximum stress direction. Figure I.2 shows two examples of microseismic mapping results following hydraulic fracturing procedures in Texas: an example from the Barnett shale gas horizontal well showing a complex fracture geometry (right), and the other from tight gas sands in a vertical well in the Cotton Valley formation, which shows a simple fracture geometry (left).
Microseismic mapping with borehole or surface sensors can be used to distinguish between reactivated natural faulting and hydraulic fracture events, through b value analysis (see Appendix D). Hydraulic fracture wells are often drilled to avoid large natural faults distinguished from three-dimensional surface seismic images, as faults can “steal” fracturing fluid and divert fluids away from the formation targeted for hydraulic fracturing. An example of this issue was discussed by Wessels et al. (2011), where a through-going fault was reactivated during hydraulic fracturing (Figure I.3).
REFERENCES
Maxwell, S.C., J. Rutledge, R. Jones, and M. Fehler. 2010. Petroleum reservoir characterization using downhole microseismic monitoring. Geophysics 75(5):75A129-75A137.
Warpinski, N.R., R.C. Kramm, J.R. Heinze, and C.K. Waltman. 2005. Comparison of single- and dual-array microseismic mapping techniques in the Barnett Shale. Presented at the Society of Petroleum Engineers Annual Technical Conference and Exhibition, Dallas, TX, October 9-12.
Wessels, S.A., A. De La Pena, M. Kratz, S. Williams-Stroud, and T. Jbeili. 2011. Identifying faults and fractures in unconventional reservoirs through microseismic monitoring. First Break 29(7):99-104.

FIGURE I.2 Examples of microseismic borehole monitoring results following hydraulic fracturing procedure. (a) On the left is a map (top) and cross section (bottom) view in the Barnett Shale after a multistage hydraulic fracture treatment in a horizontal well (red line, triangles indicate perforation in wellbore where fluid is injected); the small blue dots show the location of microseismic events mapped from two borehole observation wells shown by red squares; seismic instruments are indicated by green circles. (b) On the right is a map (top) and two cross-section (bottom) views of two vertical hydraulic fractured wells (white circles) drilled in the tight gas sands of the Cotton Valley Formation. The small gray dots show microseismic locations during a gel-based and water-based hydraulic fracturing fluid injection. SOURCE: Left, Warpinski et al. (2005); right, Maxwell et al. (2010).
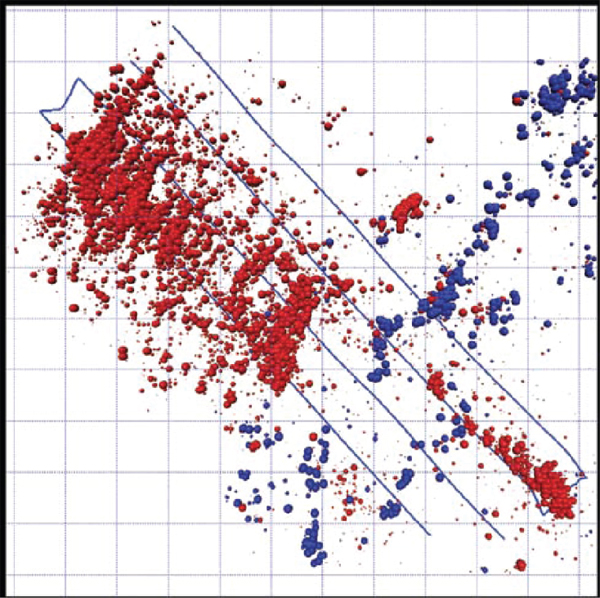
FIGURE I.3 Map view of hydraulic fracture microseismic events during a four-well stimulation (dark blue lines on the map) in the Barnett Shale. Red events are interpreted to be associated with hydraulic fracturing; blue dots indicate microseismicity associated with the reactivation of a strike-slip fault. See Wessels et al. (2011) for details. Some hydraulic fracture stages were not mapped. SOURCE: Wessels et al. (2011).


