
In most countries, statistics on births, deaths, marriages, divorces, and fetal deaths are recorded by means of the government’s civil registration system, which creates a permanent record of each event. The records derived from civil registration systems have two main uses: (1) as personal legal documents available to citizens as proof of facts; and (2) as the data basis of a country’s vital statistics system. Vital statistics are used to derive the fundamental demographic and epidemiological measures needed for national planning across multiple sectors such as education, labor, and health. They are also critical to a wide range of government activities and commercial enterprises. In the health sector, vital statistics are the core of a country’s health information system. Although civil registration records are the best source of vital statistics, such systems are often weak or incomplete in developing countries (WHO and SPHUQ, 2010).
Data Sources for Estimating Mortality in Indonesia
Health Information System and Civil Registration and Vital Statistics System
Indonesia has a health information system (HIS), but it is inadequate for policy formulation and allocation purposes (CDI and MoH, 2007). The civil registration and vital statistics (CRVS) systems in Indonesia are also weak and require substantial improvement in all areas (NIHRD, 2012). HIS is used for yearly budget and resource allocation, including the distribution of drug and health equipment. To the extent that the available information is inadequate or not utilized by health care providers, the health care system cannot be viewed as optimal.
Where the civil registration system is itself inadequate, it is sometimes necessary on an interim basis to use alternative data sources to generate vital statistics. Examples of such sources are population censuses, household sample surveys, demographic surveillance in sentinel sites, and sample registration systems. Information related to maternal and neonatal mortality in Indonesia still relies on alternative sources of data, mostly the sample household surveys.
Facility-Based and Community-Based Data Sources
The availability of measures related to maternal, newborn, and child health (MNCH), such as the maternal mortality ratio (MMRatio), maternal mortality rate (MMRate), neonatal mortality rate (NMR), and infant mortality rate (IMR),1 should ideally be provided by the national health information system. Data for that system can be derived from both facility-based and community-based data sources.
1The MMRatio is the number of maternal deaths per 100,000 live births in a year. The MMRate is the number of maternal deaths per 1,000 women of reproductive age (15-49) in a year. The NMR is defined as the probability of dying within the first month of life. The IMR is calculated as deaths between birth and the exact age of one year, per
Facility-Based Data for MNCH-Related Measures
The inadequate health information system in Indonesia is attributable, at least in part, to the limitations of facility-based data sources. These limitations may arise from the incomplete coverage of the system, the inadequate management of the system, or the uncritical use of limited data sources. Incomplete coverage of mortality related to MNCH as captured by health facilities translates into the lower than expected rates reported by surveys.2 A Maternal Perinatal Audit Program3 and the implementation of PWSKIA4 as a surveillance tool may provide the basic data required to measure maternal and neonatal mortality rates. However, such measures derived from these data sources produce estimates lower than those generated by survey-based data.
Community-Based Data: Household Surveys
When service- or facility-based data are inadequate for policy and allocation purposes, alternative methods are needed to measure maternal and neonatal mortality. Often, data can be derived from sample-based household surveys. Examples of surveys used to obtain measures of mortality and cause of death are the Indonesia Demographic and Health Survey (IDHS), National Socio Economic Survey (NSES or Susenas), Population Census (Statistics Indonesia), National Household Health Survey (NHHS or SKRT), National Health Survey (NHS or Surkesnas), and Basic Health Survey (Riskesdas) by the Ministry of Health (MoH).
The IDHS has been conducted six times—in 1991, 1994, 1997, 2002-2003, 2007, and 2012 (CBS et al., 1992, 1995, 1998; Badan Pusat Statistik and ORC Macro, 2003; CBS and MI, 2008; Badan Pusat Statistik et al., 2012). IDHS data have been used by the government of Indonesia to report information on maternal and neonatal mortality.
Estimates of MNCH-Related Rates
Maternal Mortality Ratio
Officially, the maternal mortality ratio is derived from the IDHS by employing the sibling technique.5 The IDHS provides national estimates of the MMRatio and the MMRate over the five years preceding the survey. The IDHS is unable to provide regional estimates because of the small sample size of the survey and the limitations of the measuring method. The results indicate that the MMRatio declined from 390 deaths per 100,000 live births during 1989-1994 to 230 deaths per 100,000 live births during
1,000 live births and estimates the probability of dying the first year of life. These abbreviations differ from those used in the rest of the report to clarify the difference between rate and ratio.
2For example, the 4,662 maternal deaths reported to the Ministry of Health by district health offices and the 4,017,696 live births recorded in 2010 result in an MMRatio of 116 deaths per 100,000 live births. This measure is much lower than that based on surveys.
3The Maternal Perinatal Audit Program carefully reviews and evaluates the care received by pregnant women, their unborn babies, and their neonates, as well as maternal deaths.
4PWSKIA (Pemantauan Wilayah Setempat Kesehatan Ibu dan Anak) is the local area monitoring system for maternal and child health.
5This approach maximizes use of information on the age of surviving siblings, the age at death of siblings, and the number of years ago the sibling died. It allows the data to be aggregated in order to determine the number of person-years of exposure to a mortality risk and the number of sibling deaths occurring in defined calendar periods. The rate of maternal mortality is obtained by dividing maternal deaths by person-years of exposure. The MMRate can be converted to the maternal mortality ratio and expressed per 100,000 live births by dividing the rate by the general fertility rate (GFR). The approach measures only pregnancy-related mortality (with no realistic possibility for verbal autopsies), is based on a small number of cases and may underestimate overall mortality (and thus pregnancy-related mortality).
2002-2007, for an annual reduction rate (ARR) of about 4.1 percent (see Table 2-1). An average ARR of 5.5 percent is needed to meet the Millennium Development Goal (MDG) 5 target of a 75 percent reduction from 1990 to 2015.
Because IDHS calculations are based on a very small sample of maternal deaths (Table 2-1), the decline in the MMRatio provided by the IDHS should be interpreted with caution, as should the increase reported for 2012. Maternal mortality ratios (derived from the IDHS, 1994, 1997, 2002-2003, 2007, and 2012) are associated with high sampling errors and overlapping confidence intervals, thereby making it impossible to conclude that a decline in the MMRatio has in fact taken place.
Other methods of estimating the MMRatio have been developed by groups established by international organizations. Two groups recently published MMRatio estimates for Indonesia: the Institute for Health Metrics and Evaluation (IHME) and the Maternal Mortality Estimation Interagency Group (MMEIG). The two groups rely on their own methodologies, which include regression models.6 Both groups used similar data sources from each country to estimate the number of maternal deaths. However, they arrived at different estimates and consequently different conclusions (IHME, 2011; MMEIG, 2012).
Table 2-2 contrasts the two maternal measures reported by IHME (see Lozano et al., 2011) and MMEIG for Indonesia. For 2011, IHME imputed an MMRatio of 245 deaths per 100,000 live births, with a range of uncertainty of 189-311 per 100,000, and MMEIG reported an MMRatio of 220 deaths per 100,000 live births, with a range of uncertainty of 130-350 per 100,000. Based on an estimated MMRatio in 1990 of 600 deaths per 100,000 live births, MMEIG (2012) calculated an ARR of -4.9 percent in the MMRatio between 1990 and 2010 and concluded that Indonesia has made progress on maternal health, even though estimates of the MMRatio between 1990 and 2010 had a wide sampling error. By contrast, IHME concluded that it is unlikely, starting from a lower value in 1990 with an ARR of -2.4 percent, that Indonesia will achieve the MDG 5 target (Lozano et al., 2011).
TABLE 2-1 Estimated Maternal Mortality Ratio, Indonesia: IDHS, 1994-2012
| IDHS | MMRatio | Time reference | ARR (%)a | Basis Number of Maternal Deaths for Estimate |
| 1994 | 390 | 1989-1994 | 5.2 | 107 |
| 1997 | 330 | 1993-1997 | 2.6 | Not reported |
| 2002-2003 | 300 | 1997-2002 | 5.3 | 73 |
| 2007 | 230 | 2002-2007 | -8.8 | 62 |
| 2012 | 360 | 2007-2012 | — | 92 |
aCalculation for subsequent surveys.
NOTE: Based on the sibling approach (direct sisterhood method). ARR = annual reduction rate.
SOURCE: Indonesia Demographic and Health Survey (IDHS), 1994, 1997, 2002-2003, 2007, 2012.
6A comparison of the regression models employed by the IHME and MMEIG follows:
|
IHME |
MMEIG |
|
|
Model |
Linear + space time |
Multilevel |
|
Dependent variable |
MMRate (ln) by age group |
Fraction of MM (log), all ages |
|
Treatment of HIV |
Model-based |
Estimated deaths separately |
|
Covariates |
||
|
GDP |
Yes |
Yes |
|
Education |
Yes |
No |
|
Total fertility rate |
Yes |
Yes |
|
HIV |
Yes |
No |
|
Health services |
Neonatal mortality |
Skilled birth attendant |
|
Model validation |
Yes |
No |
|
Uncertainty |
Yes |
Yes |
TABLE 2-2 MMEIG versus IHME Estimates of Maternal Mortality Ratio: Indonesia, 1990-2010
| Approach | Estimated MMRatio | Annual change in MMRatio (%) | MDG target attainment | ||
| 1990 | 2000 | 2010 | 1990-2010 | ||
| MMEIG | 600 | 370 | 220 (130-350) | -4.9 | Making progressa |
| IHME | 404 (365-446) | 333 (299-365) | 245b (189-311) | -2 4c | Nod |
aMDG target may or may not be achieved.
b2011.
c1990-2011.
dUnlikely MDG target will be achieved.
NOTE: MMEIG = Maternal Mortality Estimation Interagency Group; IHME = Institute for Health Metrics and Evaluation; MDG = Millennium Development Goal.
SOURCES: MMEIG; IHME; Lozano et al. (2011).
Indonesia’s population census, last conducted in 2010, also collected information on mortality in each household for the period January 2009-May 2010 (the census date). Information on mortality included gender and age at death of the deceased. If the deceased was a female and over 10 years old at death, further information was collected on whether the death occurred during a pregnancy, birth, or postpartum period. This information made it possible to identify pregnancy-related deaths that occurred over the period January 2009-May 2010.
Information on pregnancy-related deaths provided by the 2010 census can be used to directly estimate maternal mortality measures (MMRatio and MMRate), even though deaths were underreported in the census and should therefore be corrected. Use of the Brass Growth Balance Method (United Nations, 1983) for estimating data completeness revealed that a correction factor of 2.3 was needed to estimate the number of deaths of those aged 15 years and up (Soemantri, 2012). The correction factor of 2.3 was also used to correct the number of pregnancy-related deaths. Incorporating this correction, Table 2-3 provides estimates of the MMRatio and MMRate and the number of maternal deaths for all Indonesia and by region. The national MMRatio is 263 maternal deaths per 100,000 live births, ranging from the low of 222 per 100,000 for Java-Bali to the high, 430 per 100,000, for Sulawesi. The national estimate of the MMRatio using a different approach is a similar figure, 259 deaths per 100,000 live births (Hartanto, 2012). Hartanto also reports a wide variation in MMRatios by province, ranging from a low of 124 deaths per 100,000 live births for Bali and a high of 1,180 deaths per 100,000 live births for West Papua.
As part of their global progress report on MDGs 4 and 5, Lozano et al. (2011) have produced model-based estimates for Indonesia of the MMRatio and number of maternal deaths in 1990, 2000, and 2011, as well as annual reduction rates for the periods 1990-2000, 2000-2011, and 1990-2011 (Table 2-4). The most recent interval estimates (2011) of the MMRatio (189-311 deaths per 100,000 live births) and number of maternal deaths (8,200-13,500) are statistically not different from the corrected estimates based on the 2010 population census: MMRatio, 263 deaths per 100,000 live births; number of maternal deaths, 12,400. The figures of the 2010 population census are within the interval of model-based estimates.
| Maternal Measure | National | Region | ||||
| Sumatra | Java-Bali | Kalimantan | Sulawesi | Eastern Indonesia | ||
| Total deaths | 12,390 | 2,820 | 5,610 | 870 | 1,630 | 1,460 |
| MMRate | 19 | 21 | 14 | 23 | 35 | 36 |
| MMRatio | 263 | 251 | 222 | 290 | 430 | 382 |
SOURCE: Corrected calculation based on underreported pregnancy-related deaths of 2010 population census by S. Soemantri.
| MMRatio | Maternal deaths | ARR (%) | ||||||
| 1990 | 2000 | 2011 | 1990 | 2000 | 2011 | 1990-2000 | 2000-2011 | 1990-2011 |
| 404 (365-446) | 333 (299-365) | 245 (189-311) | 19,300 (17,000-21 300) | 15,200 (13,700-16 700) | 10,600 (8,200-13 500) | 1.9 (0.5-3.4) | 2.9 (0.4-5.3) | 2.4 (1.2-3.7) |
SOURCE: Lozano et al. (2011).
Childhood Mortality Estimates
Maternal deaths are very rare events compared with childhood deaths. The MMRatio derived from the Indonesia Demographic and Health Survey relies on a very limited number of sample cases, thereby yielding a very wide range of estimates. However, childhood mortality estimates from the IDHS may provide a more stable estimate of neonatal, infant, and under-5 deaths. Table 2-5 shows direct estimates of the neonatal mortality rate (NMR), infant mortality rate (IMR), and under-5 mortality rate (U5MR) from the six IDHS surveys, employing the birth history approach. The IDHS provides estimations that refer to three periods: 0-4 years, 5-9 years, and 10-14 years preceding the survey. Table 2-5 also depicts the percentage contribution of the NMR to the IMR and U5MR. Figure 2-1 presents, in ln scale, the neonatal mortality rate, infant mortality rate, and under-5 mortality rate as derived from the six IDHS surveys. Figure 2-2 presents the percentage contribution of neonatal deaths to infant and under-5 deaths.
| Year of IDHS | Time Period (number of years preceding survey) | Time Reference | Direct Estimates of Childhood Mortality (per 1,000 live births) | % Contribution of NMR to | |||
| NMR | IMR | U5MR | IMR | U5MR | |||
| 1991 | 0-4 | 1988.5 | 32 | 68 | 97 | 46.8 | 32.5 |
| 5-9 | 1983.5 | 36 | 80 | 116 | 44.5 | 30.7 | |
| 10-14 | 1978.5 | 41 | 82 | 123 | 50.4 | 33.6 | |
| 1994 | 0-4 | 1991.5 | 30 | 57 | 81 | 53.3 | 37.4 |
| 5-9 | 1986.5 | 34 | 75 | 103 | 45.8 | 33.3 | |
| 10-14 | 1981.5 | 37 | 75 | 110 | 49.5 | 33.9 | |
| 1997 | 0-4 | 1994.5 | 22 | 46 | 58 | 47.7 | 37.5 |
| 5-9 | 1989.5 | 28 | 59 | 83 | 48.4 | 34.3 | |
| 10-14 | 1984.5 | 28 | 65 | 95 | 43.4 | 30.0 | |
| 2002-2003 | 0-4 | 1999.5 | 20 | 35 | 46 | 57.1 | 43.5 |
| 5-9 | 1994.5 | 26 | 51 | 63 | 51.0 | 41.3 | |
| 10-14 | 1989.5 | 29 | 59 | 79 | 49.2 | 36.7 | |
| 2007 | 0-4 | 2004.5 | 19 | 34 | 44 | 55.9 | 43.2 |
| 5-9 | 1999.5 | 23 | 44 | 58 | 52.3 | 39.7 | |
| 10-14 | 1994.5 | 28 | 53 | 69 | 52.8 | 40.6 | |
| 0-4 | 2009.5 | 19 | 32 | 40 | 59.4 | 47.5 | |
| 2012 | 5-9 | 2004.5 | 20 | 35 | 45 | 57.1 | 44.4 |
| 10-14 | 1999.5 | 23 | 45 | 58 | 51.1 | 39.7 | |
SOURCE: Indonesia Demographic and Health Survey (IDHS), 1991, 1994, 1997, 2002-2003, 2007, 2012.
It is apparent that during the last two decades lowering the NMR was more difficult than lowering the IMR or U5MR (Figure 2-1). The difficulty in lowering the NMR is also reflected in the increase in the percentage contribution of the NMR to the IMR from 47 percent (IDHS, 1991) to 59 percent (IDHS, 2012) and the percentage contribution of the NMR to the U5MR from 32 percent (IDHS, 1991) to 47 percent (IDHS, 2012). Overall, increases in the percentage contribution of the NMR to the IMR or the U5MR are also shown by the coefficient of the regression line of the percentage contribution (Figure 2-2).
Estimates of the NMR, IMR, and U5MR by time reference (Table 2-5) can be transformed into log scale and split into two time periods (before and after year 1999) as depicted in Figure 2-3. The figure contrasts trends of NMR, IMR, and U5MR before and after 1999. The coefficient of the log scale regression is the annual reduction rate (ARR), and one can compare the ARR before and after 1999 for the
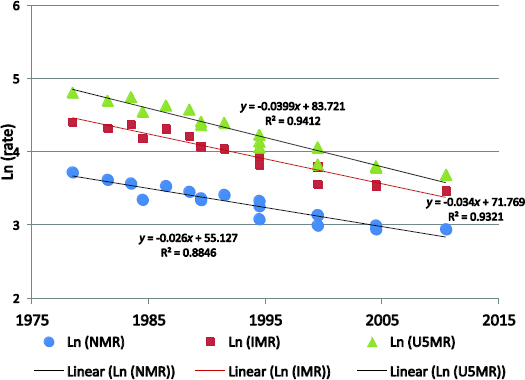
FIGURE 2-1 Direct Estimates of Neonatal, Infant, and Under-5 Mortality Rates, Indonesia: IDHS, 1991-2012.
SOURCE: Indonesia Demographic and Health Survey (IDHS), 1991, 1994, 1997, 2002-2003, 2007, 2012.
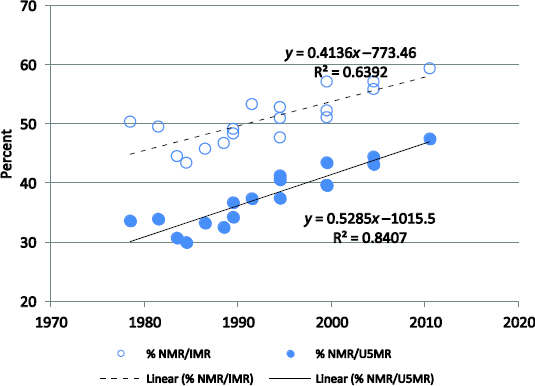
FIGURE 2-2 Percentage Contribution of Neonatal Deaths to Infant and Under-5 Deaths, Indonesia: IDHS, 1991-2012. SOURCE: Indonesia Demographic and Health Survey (IDHS), 1991, 1994, 1997, 2002-2003, 2007, 2012.
NMR, IMR, and U5MR. The ARR for the three measures decreases with time. The ARR before and after 1999 are 2.8 percent versus 1.5 percent, NMR; 3.3 percent versus 2.5 percent, IMR; and 4.3 percent versus 2.8 percent, U5MR. The ARR for the U5MR is higher than that for the IMR, and the ARR for the IMR is higher than that for the NMR. Figure 2-4 contrasts each of the three measures (NMR, IMR, U5MR) for the five-year period preceding the IDHS conducted in 2002-2003, 2007, and 2012. There are no statistically significant changes in the three measures, which likely indicates a stagnant condition.
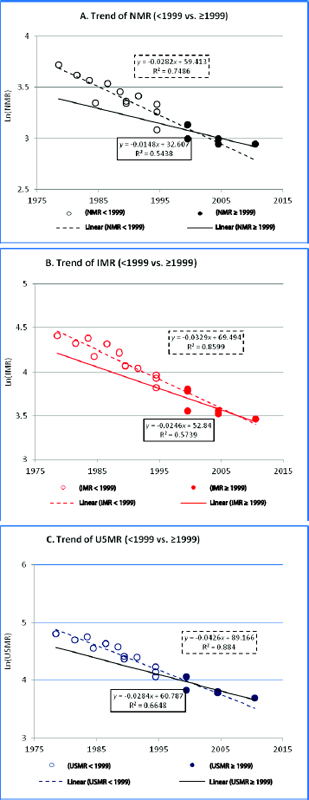
FIGURE 2-3 Change in Trends of Neonatal Mortality Rate (A), Infant Mortality Rate (B), and Under-5 Mortality Rate (C) by Time Period, Indonesia: IDHS, 1991-2012. This figure contrasts each of the three measures (NMR, IMR, U5MR) for the five-year period preceding the IDHSs conducted in 2002/2003, 2007, and 2012. There are no statistically significant changes in the three measures, which likely indicates a stagnant condition. SOURCE: Indonesia Demographic and Health Survey (IDHS), 1991, 1994, 1997, 2002-2003, 2007, 2012.
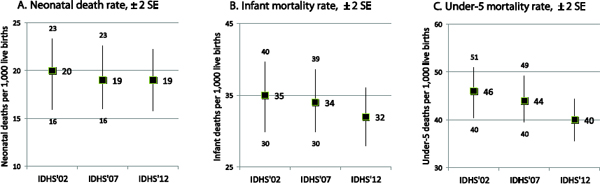
FIGURE 2-4 Comparison of Neonatal Mortality Rate (A), Infant Mortality Rate (B), and Under-5 Mortality Rate (C), Indonesia: IDHS, Selected Years. NOTE: SE = standard error; IDHS = Indonesia Demographic and Health Survey. SOURCE: Indonesia Demographic and Health Survey, 2002-2003, 2007, 2012.
Table 2-6 presents the estimates by Lozano et al. (2011) of the NMR, 17.3 deaths per 1,000 live births; IMR, 29.4 per 1,000; and U5MR, 37.6 per 1,000. It also shows the annual reduction rate for the periods 1990-2000, 2000-2011, and 1990-2011 for the U5MR. All three measures, compared with the estimates from IDHS 2012 for the five-year periods preceding the survey (NMR, 19 deaths per 1,000 live births; IMR, 32 per 1,000; and U5MR, 40 per 1,000) are lower. The differences, however, are not significant. Likewise, the Inter-agency Group for Child Mortality Estimation (IGME), established by the United Nations in 2004, estimated the levels and trends in child mortality for Indonesia, and they are shown in Table 2-7 (UNICEF, 2010).
Background Characteristics of Maternal Deaths in Indonesia
Underlying Causes of Maternal Deaths
The 2010 population census reported that maternal (pregnancy-related) deaths were followed up by the National Institute of Health Research and Development (NIHRD), which defined the cause of death by employing the verbal autopsy method.7Table 2-8 gives the percentage, by direct (underlying) cause, of maternal death (International Classification of Diseases-10) for each region (Badan Litbangkes Kemenkes RI, 2012). The two leading underlying causes are hypertensive disorders of pregnancy and postpartum hemorrhage. Table 2-8 also contrasts direct versus indirect causes of maternal deaths by region. Nationally, 77 percent of maternal deaths are due to direct obstetric causes (underlying cause or unsafe delivery practices) and 23 percent to indirect obstetric causes.8
7The Institute of Health Metrics and Evaluation defines a verbal autopsy as “a method of determining individuals’ causes of death and cause-specific mortality fractions in populations without a complete vital registration system. Verbal autopsies consist of a trained interviewer using a questionnaire to collect information about the signs, symptoms, and demographic characteristics of a recently deceased person from an individual familiar with the deceased” (http://www.healthmetricsandevaluation.org/research/team/verbal-autopsy).
8The underlying cause of death is based on death reports of which about 50 percent are incomplete, and so the pattern may differ from the true pattern in the population. According to Cross, Bell, and Graham (2009) writing in the Bulletin of the World Health Organization, “Direct obstetric deaths are those resulting from obstetric complications of the pregnant state (i.e. pregnancy, labour and the puerperium), from interventions, omissions or incorrect treatment, or from a chain of events resulting from any of the above. Indirect obstetric deaths are those resulting from a previously existing disease or a disease that developed during pregnancy and which was not due to direct obstetric causes but which was aggravated by the physiological effects of pregnancy.”
| Deaths per 1,000 live births, 2011 | Number of under-5 deaths (‘000) | ARR (%) | ||||
| NMR (0-28 days) | IMR (0-364 days) | U5MR (0-4 years) | 1990-2000 | 2000-2011 | 1990-2011 | |
| 17.3 (14.5-20.4) | 29.4 (26.6-36.8) | 37.6 (30.3-46.6) | 161 (124-211) | 3.9 (3.4-4.4) | 2.8 (0.8-4.8) | 3.3 (2.3-4.4) |
SOURCE: Lozano et al. (2011).
| U5MR | IMR | ||||
| 1990 | 2009 | ARR (%) 2000-2009 | 1990 | 2009 | ARR (%) 2000-2009 |
| 86 | 39 | 4.2 | 56 | 30 | 3.3 |
SOURCE: UNICEF (2010).
| Underlying cause of death | ICD-10 code | Region (%) | Indonesia (%) | ||||
| Sumatra | Java-Bali | Kalimantan | Sulawesi | Eastern Indonesia | |||
| 1. Pregnancy with abortive outcome | O00-O08 | 3.7 | 4.2 | 2.7 | 5.6 | 4.2 | 4.1 |
| 2. Edema, proteinuria, and hypertensive disorder (HDK) | O10-O16 | 33.3 | 33.1 | 34.9 | 32.6 | 25.8 | 32.4 |
| 3. Placenta previa, premature separation of placenta, and antepartum hemorrhage | O44-O46 | 4.4 | 2.7 | 4.3 | 2.3 | 3.6 | 3.3 |
| 4. Problems related to fetus and amniotic cavity and possible delivery problems | O30-O43, O47-O48 | 3.0 | 1.7 | 0.0 | 0.8 | 0.1 | 1.6 |
| 5. Obstructed labor | O64-O66 | 0.5 | 1.1 | 0.0 | 0.6 | 1.0 | 0.8 |
| 6. Postpartum hemorrhage (PPH) | O72 | 16.4 | 16.8 | 28.1 | 26.3 | 29.8 | 20.3 |
| 7. Other complications of pregnancy and delivery | O20-O29, O60-O63, O67-O71, O73-O75, O81-O84 | 11.1 | 6.0 | 2.9 | 7.6 | 5.9 | 7.2 |
| 8. Complications predominantly related to puerperium and other conditions | O85-O99 | 27.6 | 34.3 | 27.1 | 23.9 | 29.7 | 30.2 |
| Total | 100.0 (N = 1,737) | 100.0 (N = 3,334) | 100.0 (N = 587) | 100.0 (N = 979) | 100.0 (N = 887) | 100.0 (N = 7,524) | |
| Direct obstetric death Indirect obstetric death | O00-O95 O98-O99 | 81.5 18.5 | 73.8 26.2 | 80.9 19.1 | 80.2 19.8 | 75.7 24.3 | 77.2 22.8 |
NOTE: ICD = International Classification of Diseases.
SOURCE: Badan Litbangkes Kemenkes RI (2012).
Background Characteristics of Maternal Deaths
A follow-up study of the 2010 population census by NIHRD (Badan Litbangkes Kemenkes RI, 2012) provides some background characteristics of maternal deaths in Indonesia. Sixty-two percent of maternal deaths occurred during the postpartum (puerperium) period, 25 percent during pregnancy, and 13 percent at delivery. Sixty-five percent of maternal deaths were women aged 20-35 years; 96 percent, married women; 55 percent, women with 1-2 children; 28 percent, women with 3-4 children, 95 percent, women with a high school or lower education (34 percent, junior and senior high school, and 61 percent,
primary school or less); 64 percent, women who lived in rural areas; 58 percent, women who died in the hospital; and 29 percent, women who died at home.
For those who lived in an urban area, maternal deaths in a hospital were more prevalent (75 percent) than for those who lived in rural areas (48 percent). Maternal deaths at home were more prevalent for those who lived in rural areas (36 percent) than for those who lived in urban areas (18 percent). Many of those who died in a hospital were transferred there after emergency difficulties were encountered while giving birth at home.
Mortality Trends and Progress toward MDGs 4 and 5
Demographic and health surveys (DHSs), with principal support from the Macro Institute, have been widely applied in developing countries. Mortality measures (such as the MMRatio, IMR, or NMR) based on a DHS have influenced government policies related to maternal, newborn, and child health programs, including the MDG targets. Many developing countries, including Indonesia, have adopted strategies based on the DHS data without considering the limitations of the data sources.
The government of Indonesia adopted IDHS results in planning and measuring the achievements toward MDGs 4 and 5. Based on the IDHS-based trends in which the MMRatio declined from 390 deaths per 100,000 live births (IDHS, 1994) to 230 deaths per 100,000 live births (IDHS, 2007), the government targeted an MMRatio of 102 deaths per 100,000 live births by 2015. Likewise, based on IDHS-based trends for U5MR and IMR, the government targeted an U5MR of 32 deaths per 1,000 live births and an IMR of 23 deaths per 1,000 live births by 2015 (Bappenas, 2010).
Earlier in this chapter, it was revealed that the levels and trends of the MMRatio, U5MR, and IMR for Indonesia are dependent on the data sources and methods of estimation employed, and so they may produce a different conclusion on the attainment of MDGs 4 and 5. An average ARR of 4.4 percent is needed to meet the MDG 4 target of a two-thirds reduction in the U5MR from 1990 to 2015, and an average ARR of 5.5 percent is needed to meet the MDG 5 target of a three-fourths reduction in the MMRatio from 1990 to 2015.
Table 2-9 summarizes progress on the MDG 4 and 5 indicators reported for Indonesia by various data sources and the methods of estimation. The Maternal Mortality Estimation Interagency Group and UN Inter-agency Group for Child Mortality Estimation generally offer a positive appraisal of Indonesia’s progress toward attaining MDGs 4 and 5. By contrast, the Institute for Health Metrics and Evaluation gives Indonesia a negative appraisal, asserting that the MDG 4 and 5 targets are unlikely to be attained (Rajaratnam et al., 2010; Lozano et al., 2011). Our appraisal of the likelihood of attaining MDGs 4 and 5 based on direct estimates of the MMRatio and childhood mortality rates derived from the IDHS and 2010 population census is in agreement with the IHME appraisal. Using the recent trends in the IMR and U5MR, reflected by their ARRs, the expected IMR by 2015 would be 27 deaths per 1,000 live births and the U5MR 34 deaths per 1,000 live births. These figures are higher than the targets set by Indonesia’s National Development Planning Agency (Bappenas): IMR, 23 deaths per 1,000 live births, and U5MR, 32 per 1,000 live births. Likewise, using the recent levels and trends of the MMRatio, the expected MMRatio by 2015 would be 230 deaths per 100,000 live births, far above the target set by Bappenas, which is 102 deaths per 100,000 live births.
International Comparison
Of the countries in the ASEAN (Association of Southeast Asian Nations) group, Indonesia’s MMRatio is in the range of those of Laos, Cambodia, and Myanmar, but far behind those of Singapore, Brunei Darussalam, Malaysia, and Thailand. The lifetime risk (LTR) of maternal death for Indonesia is 1 in 210, which is much higher than the LTR for Singapore (1 in 25,300) or the LTR for Brunei Darussalam (1 in 1,900). Of the ASEAN countries, Indonesia contributes the highest number of maternal deaths because of its high MMRatio and large population (see Table 2-10). Table 2-11 contrasts Indonesia’s pro-
gress toward MDGs 4 and 5 with those of other ASEAN countries based on modeled estimates. Indonesia has been assessed as being on track for reaching the under-5 mortality ratio (MDG 4) target and on reaching the maternal mortality ratio (MDG 5) target. However, the numbers that appear in Tables 2-10 and 2-11 should be interpreted with caution because most estimates are based on models that have very wide confidence intervals. By comparing slopes of mortality decline between 1990 and 2000 and 2000 and 2010, Figures 2-5A and 2-5B indicate that the rates of mortality decline are lower after 2000, which means that the efforts to meet the MDG targets are becoming harder.9
| Indicator | Source | Method of Estimation | 1990 | 2010 | ARR (%) | MDG Target Attainment |
| MMRatio | MMEIG | Model-based | 600 | 220 | 4.9 | Making progress |
| IHME | Model-based | 404 | 245a | 2.4 | Insufficient progress | |
| IDHS, PC | Direct | 390b | 260c | 2.3 | Insufficient progress | |
| NMR | IHME | Model-based | 27.5 | 18 | 2.2 | Insufficient progress |
| IDHS | Direct | 30b | 19 | 2.4 | Insufficient progress | |
| IMR | IGME | Model-based | 56 | 30c | 3.3 | Insufficient progress |
| IHME | Model-based | 53 | 30 | 2.8 | Insufficient progress | |
| IDHS | Direct | 57b | 32 | 3.2 | Insufficient progress | |
| U5MR | IGME | Model-based | 86 | 39c | 4.2 | Making progress |
| IHME | Model-based | 71.5 | 38 | 3.3 | Insufficient progress | |
| IDHS | Direct | 81b | 40 | 3 5 | Insufficient ro ress |
a2011.
b1991.
c2010 Population Census direct estimate (after correction); refers to 2009.
NOTE: MMEIG = Maternal Mortality Estimation Interagency Group; IHME = Institute for Health Metrics and Evaluation; IDHS = Indonesia Demographic and Health Survey; PC = population census; IGME = Inter-agency Group for Child Mortality Estimation; ARR = annual reduction rate; MDG: Millennium Development Goal.
SOURCES: CBS et al. (1995); Rajaratnam et al. (2010); Lozano et al. (2011); MMEIG (2012); Badan Pusat Statistik (2012).
| Country | MMRatio | Range of MMRatio Uncertainty | Lifetime Risk of Maternal Death: 1 in | Number of Maternal Deaths | |
| Lower Estimate | Upper Estimate | ||||
| Brunei Darussalam | 24 | 15 | 40 | 1,900 | 2 |
| Cambodia | 250 | 160 | 390 | 150 | 790 |
| Indonesia | 220 | 130 | 350 | 210 | 9,600 |
| Laos | 470 | 260 | 840 | 74 | 670 |
| Malaysia | 29 | 12 | 64 | 1,300 | 170 |
| Myanmar | 200 | 120 | 330 | 250 | 1,600 |
| Philippines | 99 | 66 | 140 | 300 | 2,300 |
| Singapore | 3 | 2 | 7 | 25,300 | 2 |
| Thailand | 48 | 33 | 70 | 1,400 | 400 |
| Vietnam | 59 | 27 | 130 | 870 | 860 |
SOURCE: MMEIG (2012).
9For Indonesia, the slope of the decline in the U5MR for the period 1990-2000 is equal to an ARR of 4.5 percent, and for 2000-2010 is equal to an ARR of 4.3 percent. The slope of the decline in the MMRatio for the period 1990-2000 is equal to an ARR of 5.7 percent, and for 2000-2010 is equal to an ARR of 4.4 percent. A similar pattern of changes in the ARR for the U5MR between the two periods is shown in Figure 2-5B.
TABLE 2-11 Country Progress toward Millennium Development Goals 4 and 5, Indonesia
| Country | Under-5 mortality rate | Maternal mortality ratio (modeled) | ||||||||
| Deaths per 1,000 Live Births | Average ARR (%) | Assessment of Progress | Deaths per 100,000 Live Births | Average ARR (%) | Assessment of Progress | |||||
| 1990 | 2000 | 2010 | 1990-2010 | 1990 | 2000 | 2010 | 1990-2010 | |||
| Cambodia | 120 | 103 | 51 | 4.3 | On track | 830 | 510 | 250 | 5.8 | On track |
| Indonesia | 85 | 54 | 35 | 4.4a | On track | 600 | 340 | 220 | 4.9b | Making progress |
| Laos | 150 | 88 | 54 | 4.9 | On track | 1,600 | 870 | 470 | 5.9 | On track |
| Myanmar | 110 | 87 | 66 | 2.6 | Insufficient progress | 520 | 300 | 200 | 4.8 | Making progress |
| Philippines | 59 | 40 | 29 | 3.6 | On track | 170 | 120 | 99 | 2.8 | Making progress |
| Vietnam | 51 | 35 | 23 | 4.0 | On track | 240 | 100 | 59 | 6.9 | On track |
aThe annual reduction rate (ARR) for Indonesia’s U5MR in declined from 4.5 percent (1990-2000) to 4.3 percent (2000-2010).
bThe ARR for Indonesia’s MMRatio declined from 5.7 percent (1990-2000) to 4.4 percent (2000-2010).
SOURCE: MMEIG (2012).
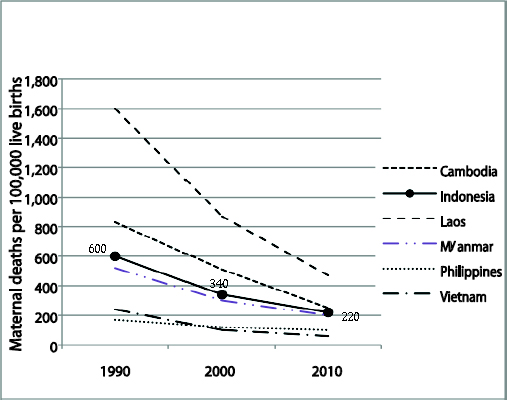
FIGURE 2-5A Maternal Mortality Ratio: Country Progress, Southeast Asia
SOURCE: MMEIG (2012).
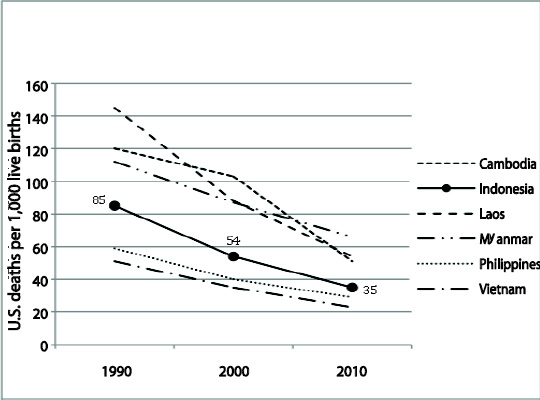
FIGURE 2-5B Under-5 Mortality Rate: Country Progress, Southeast Asia
Indonesia relies on survey-based data to obtain official measures of maternal, neonatal, and child health-related deaths, but these data largely yield a wide range of estimates. Different approaches to measuring mortality rates give different results and different assessments of the progress made. Estimates employing both the sibling technique and models based on the MMRatio and childhood mortality rates offer no conclusive assessment of trends and MDG achievements.
The 2010 population census has its limitations for estimating the MMRatio, whereas direct estimation of the MMRatio gives a more stable result. A rate of some 260 maternal deaths per 100,000 live births and an estimated 12,000 maternal deaths in 2009 are most likely the correct figures for Indonesia for recent years.
Indonesia is facing a high maternal mortality ratio, with wide disparity among regions. Java-Bali, with the largest population, contributes the largest number of maternal deaths, although its rate is the lowest. Eastern Indonesia, with a far smaller population, contributes a lower absolute number of deaths, although its rate is much higher.
The IDHS, which provides direct estimates of the NMR, IMR, and U5MR, could be better interpreted as the lowest limit of the measures. Trends in childhood mortality rates over time indicate that it is becoming increasingly difficult to further reduce these measures, and lowering the NMR is more difficult than lowering the IMR and U5MR.
Among ASEAN countries, Indonesia contributes the highest number of maternal deaths because of its large population and high maternal mortality ratio. The high maternal mortality ratio for Indonesia is comparable only with those of countries such as Laos, Myanmar, and Cambodia.
Recent levels and trends in the MMRatio, IMR, and U5MR indicate that it is unlikely that the MDG 4 and 5 targets will be achieved. Assessments of progress toward MDGs 4 and 5 are based on unreliable data, and model-based methods should be interpreted with caution. Policy documents that rely on unreliable survey data should also be revisited.
Issues related to inequity among the regions of Indonesia and revealed by comparisons of the absolute numbers of maternal deaths and maternal mortality rates should be taken into consideration in developing policies for reducing maternal mortality. Evidence-based planning requires reliable and timely information. A civil registration and vital statistics system and a health information system are urgently needed in Indonesia. This will require a commitment and cooperation of all parties involved in building the systems, such as the Ministry of Health, Ministry of Home Affairs, and Statistics Indonesia (BPS).
References
Badan Litbangkes Kemenkes RI (Research and Development Agency, Ministry of Health). 2012. Disparitas, Akses dan Kualitas. Kajian Determinan Kematian Maternal di Lima Region Indonesia. Jakarta: Kemenkes RI and UN Population Fund (UNFPA).
Badan Pusat Statistik (Statistics Indonesia), National Population and Family Planning Board, Ministry of Health, and Measures DHS ICF International. 2012. Indonesia Demographic and Health Survey 2012 (Preliminary Report). Jakarta: Badan Pusat Statistik.
Badan Pusat Statistik (Statistics Indonesia) and ORC Macro. 2003. Indonesia Demographic and Health Survey 2002-2003. Calverton, MD: Central Bureau of Statistics and ORC Macro.
Bappenas (National Development Planning Agency). 2010. Report on the Achievement of the Millennium Development Goals, Indonesia 2010. Jakarta: Bappenas.
CBS (Central Bureau of Statistics) and MI (Macro International Inc.). 2008. Indonesia Demographic and Health Survey 2007. Calverton, MD: CBS and MI.
CBS (Central Bureau of Statistics), National Family Planning Coordinating Board, Ministry of Health, and MI (Macro International Inc.). 1992. Indonesia Demographic and Health Survey 1991. Columbia, MD: CBS and MI.
______. 1998. Indonesia Demographic and Health Survey 1997. Calverton, MD: CBS and MI.
CBS (Central Bureau of Statistics), State Ministry of Population/National Family Planning Coordinating Board, Ministry of Health, and MI (Macro International Inc.). 1995. Indonesia Demographic and Health Survey 1994. Columbia, MD: CBS and MI.
CDI (Centre for Data and Information) and MoH (Ministry of Health). 2007. Indonesia Health Information System Review and Assessment. Jakarta: MoH-Health Metrics Network.
Cross, Suzanne, Jacqueline S. Bell, and Wendy J. Graham. 2009. What you count is what you target: The implications of maternal death classification for tracking progress towards reducing maternal mortality in developing countries. Bulletin of the World Health Organization 88:147-153.
Hartanto, Wendy. 2012. Indonesia maternal mortality estimate from 2010 population census. Paper presented at PAA-APA Workshop on Data Quality and Accessibility in the 2010 Round Censuses in Asia, Bangkok, August 25-26.
IHME (Institute for Health Metrics and Evaluation). 2011. Maternal Mortality Estimates and MDG 5 Attainment by Country 1990-2011. Seattle: IHME.
Lozano, Rafael, et al. 2011. Progress towards Millennium Development Goals 4 and 5 on maternal and child mortality: An updated systematic analysis. Lancet 378:1139-1165.
MMEIG (Maternal Mortality Estimation Interagency Group). 2012. Trends in Maternal Mortality: 1990-2010. WHO, UNICEF, UNFPA and The World Bank Estimates. Geneva: World Health Organization.
NIHRD (National Institute of Health Research and Development). 2012. Assessment of Indonesia’s civil registration and vital statistics system. Draft final report of CRVS Review Committee, Jakarta, August 30.
Rajaratnam, J. K., et al. 2010. Neonatal, postneonatal, childhood, and under-5 mortality for 187 countries, 1970-2010: A systematic analysis of progress towards Millennium Development Goal 4. Lancet 375:1988-2008.
Soemantri, S. 2012. PC 2010: Mortality data quality. Paper presented at Workshop and Training on SP 2010: Estimation of MMR. Aston Hotel, Bogor, November 12-14.
UNICEF, Interagency Group for Child Mortality Estimation. 2010. Levels and Trends in Child Mortality. Report 2010. New York: UNICEF.
WHO (World Health Organization) and SPH-UQ (School of Population Health, University of Queensland). 2010. Improving the Quality and Use of Birth, Death and Cause-of-Death Information: Guidance for a Standards-Based Review of Country Practices. Canberra.


