
The test protocols for Army helmets were originally based on a requirement of zero penetrations in 20 shots (five shots on each of four helmets). The Director, Operational Test and Evaluation (DOT&E) protocol replaced this legacy plan with a requirement of 17 or fewer penetrations in 240 shots (five shots on each of 48 helmets). The helmets spanned four sizes and were tested in four different environments. The 0-out-of-20 (0, 20) plan and DOT&E’s 17-out-of-240 (17, 240) plan have comparable performance if the probability of penetrating a helmet shell on a single shot is around 0.10. As noted in Chapter 5, available data indicate that penetration probabilities are around 0.005 or less. Near this value of penetration probability, both plans have a 90 percent or higher chance of passing the test, so the manufacturer’s risk is small, as it should be. However, if there is a 10-fold increase in the penetration probability from the current level of 0.005 to 0.05, DOT&E’s (17, 240) plan still has a 95 percent chance of acceptance. This may not provide sufficient incentive for the manufacturer to sustain current penetration-probability levels. Thus, the (17, 240) plan may have the unintended effect of leading to a reduction in helmet penetration resistance. In the absence of a link between penetration probability and human injury, there is no scientific basis for setting a limit on the penetration probability. In such a circumstance, the committee’s view is that the objective of a new test plan should be to provide assurance that newly submitted helmets are at least as penetration-resistant as current helmets. This chapter proposes appropriate criteria for selecting test protocols and illustrates their use through several plans.
The primary goal of this chapter is to evaluate DOT&E’s protocol for testing a helmet’s resistance to penetration (RTP). The committee compares its performance with that of the Army’s legacy plan and a modified version of the DOT&E plan that has recently been adopted by the Army. A modification of the current protocol for the enhanced combat helmet (ECH) is also examined. These discussions are directly relevant to the issues raised in the correspondence between U.S. Representative Slaughter and the Department of Defense. To provide adequate background, the chapter begins with an overview of the statistical considerations in the design of test protocols for RTP. The chapter ends with a discussion of several topics: (1) robustness of the operating characteristic (OC) curves when the penetration probabilities vary across different test conditions; (2) examination of possible protocols for testing by helmet sizes; (3) post-test analysis of the RTP data to determine the achieved penetration probabilities of the tested helmets; and (4) a proposal to base future protocols with the helmets as the test unit rather than shots.
6.2 STATISTICAL CONSIDERATIONS IN DESIGNING TEST PLANS FOR RESISTANCE TO PENETRATION
As described in Chapter 4, the RTP test protocol specifies that helmets of different sizes be conditioned in selected environments and that shots be taken at different locations on the helmet. However, in this section, the committee starts with a simple setup—a single helmet size, a single shot location on the helmet, and a single environment—so that the test deals with a homogeneous population of units and a single test environment. (To be specific, one can think of a medium helmet, top location on the helmet, at ambient temperature.) It is then reasonable to view the penetration outcomes when n helmets are tested in this manner as being independent and identically distributed binary (pass/fail) random variables with constant penetration probability θ. Thus, the probability distribution of X, the (random) number of penetrations in n shots, is a binomial distribution with parameters (n, θ). The statistical properties of a test plan can be derived from this distribution.
c-out-of-n Test Plans
The test plans used by DOT&E for RTP are of the following form: take n shots, and if c or fewer penetrations are observed, the first article testing (FAT) passes; otherwise, it fails. In this study, the committee refers to such tests as (c, n)-plans. They are also called binomial reliability demonstrations plans or acceptance-sampling plans for attribute data.
The plan is defined by the value of two constants: c and n. Once these are specified, the protocol’s properties are determined and can be studied through its operating characteristic (OC) curve. An OC curve is a plot of the probability (P) of acceptance (y axis) against the underlying failure (penetration) probability of the items under test (x axis). Figure 6-1 shows the OC curve for a (c = 1, n = 40) test plan; i.e., the FAT is successful if there are one or fewer penetrations in 40 shots.
In Figure 6-1 and subsequent plots of OC curves in this report, the x axis is the true (but unknown) penetration probability θ. This format is different from the OC curves that are currently used by the Army and DOT&E that plot the probability of nonpenetration in the x axis. One should focus on the penetration probability, because it is easier to interpret the curve as the penetration probability changes. For example, an increase in θ from 0.005 to 0.05 is easy to interpret as a 10-fold increase in penetration probability; it is hard to interpret this change in terms of 1 – θ, which decreases from 0.995 to 0.95.
Recommendation 6-1. The operating characteristic curves used by the Department of Defense should display penetration probabilities rather than non-penetration probabilities on the x axes.
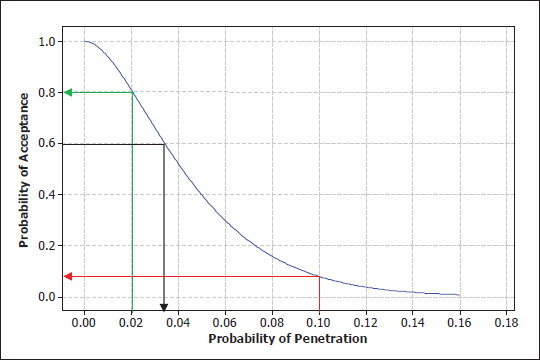
FIGURE 6-1 Operating characteristic curve for (c = 1, n = 40) test plan. The green and red lines show the probabilities of acceptance for the plan when the true probabilities of penetrations are, respectively, 0.02 and 0.10. The black line shows that, if we want the probability of acceptance to be 0.6, the true penetration probability has to be 0.38.
The y axis in Figure 6-1 shows the probability that a (c = 1, n = 40) test will be successful as a function of the underlying penetration probability θ. These acceptance probabilities are given by the cumulative distribution, P(X ≤ 1| θ), where X has a binomial distribution with n = 40 and penetration probability equal to θ. For example, if θ, the underlying (unknown) penetration probability, equals 0.02 (green line), the probability of acceptance is 0.8 (80 percent chance of passing). If θ = 0.10 (red line), the probability of acceptance is approximately 0.10. Conversely, in order to have a probability of acceptance of 0.6 (black line), the true penetration probability needs to be about 0.38. So the OC curve describes the relationship between the acceptance probabilities and the underlying penetration probability as θ ranges across values of interest.
Suppose the decision maker examined the OC curve for the 1-out-of-40 (1, 40) plan in Figure 6-1 and decided that the acceptance probability of 0.10 when θ = 0.10 is too high. There are two options for reducing this value: decreasing c or increasing n.
Figure 6-2 provides a comparison with two alternatives: 0-out-of-40 (0, 40) and 1-out-of-70 (1, 70) plans. For both (c = 0, n = 40) and (c = 1, n = 70) plans, the acceptance probabilities are close to zero for θ = 0.10. This may be acceptable to the decision maker who is the purchaser in this situation. But one cannot discriminate between the two plans at this value of θ.
Consider the case where the target penetration probability is θ = 0.01. Figure 6-2 shows that, at this level, the (0, 40) plan has an acceptance probability of about 0.63, while the (1, 70) plan has an acceptance probability of about 0.83. Since this is the target penetration probability, the decision maker will want to accept helmets with a high probability and will choose the (1, 70) plan or another plan that provides an even higher acceptance probability at θ = 0.01.
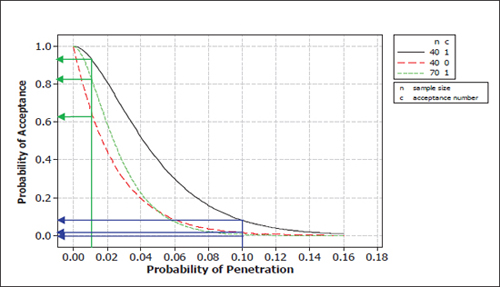
FIGURE 6-2 Operating characteristic curves comparing 1-out-of-40 test plan with 0-out-of-40 and 1-out-of-70 test plans. The blue lines show the probabilities of acceptance for the two plans when the true probability of penetration is 0.1; the green lines show the corresponding acceptance probabilities when the true penetration probability is 0.005.
Because manufacturers want to have a high probability of passing the test, their helmet design and manufacturing process should attain a penetration probability that achieves this goal. For example, to have a 90 percent chance of passing under the (0, 40) plan, the penetration probability will need to be about 0.003. To pass the (1, 70) test, penetration probability will need to be about 0.008, which is not as stringent a target as is set by the (0, 40) plan. These are the kinds of considerations and trade-offs that go into selecting a test plan. The next subsection provides a discussion of test designs that are derived by specifying two points on a plan’s OC curve.
A few additional remarks on Figure 6-2:
• The OC curve for the (0, 40) plan is always below that of the (1, 40) plan. This is intuitively clear because the (0, 40) plan is more stringent (it has the same sample size but accepts fewer failures), so the probability of passing the test is lower.
• The OC curve for the (1, 70) plan is always below that of the (1, 40) plan. This is also obvious because the (1, 70) has a larger sample size but allows the same number of failures as the (1, 40) plan.
• More generally, consider two plans that have OC curves that cross, such as the (0, 40) and (1, 70) plans in Figure 6-2. The two plans cross at a penetration probability of 0.05. To the left of that point, the (1, 70) plan has the higher acceptance probability. To the right, the (0, 40) plan has the higher probability of acceptance (although the differences are quite small).
The different perspectives of manufacturer and purchaser could lead them to prefer different plans. Different plans could be considered and evaluated and a compromise plan could be negotiated. Alternatively, as described in the next subsection, plans can be derived from specifications of manufacturer’s and purchaser’s risks.
Statistical Approaches to Selecting (c, n)-Test Plans
The conventional statistical approach for choosing a test plan is to specify two points on the OC curve: (1) a low penetration-probability, θL, at which a high acceptance probability, denoted by (1 – α), is desired (a manufacturing process that produces good helmets has a high probability of being accepted), and (2) a high penetration-probability, θH, at which a low acceptance probability β is desired (a manufacturing process that produces poor helmets has a high probability of being rejected). Expressing these objectives algebraically leads to the following two equations:
P( X ≤ c | n, θ = θL ) ≥ (1 – α) Equation 6.1
and
P( X ≤ c | n, θ = θH) ≤ β Equation 6.2
In quality control terminology, θL is the “acceptable quality level” for the plan, and θH is the “rejectable quality level.”
There are two kinds of errors that can occur in the (c, n) accept-reject decision. The first error is to reject the helmet (fail the acceptance test) when the underlying penetration probability is at the low (or desired) value (i.e., θ ≤ θL); this is often referred to as producer’s or manufacturer’s risk. The term manufacturer’s risk is used in this report. Equation 6.1 limits the probability of this error to at most α. The second error is to accept helmets when the penetration probability is too high (i.e., for values of θ ≥ θH). These are usually called consumer’s or customer’s risk. The committee refers to this risk as government’s risk in this report. As shown by Equation 6.2, the probability of this error is at most β. These are the Type I and Type II error probabilities in the corresponding statistical hypothesis testing formulation of the problem.
Equations 6.1 and 6.2 specify the cumulative binomial acceptance probabilities at two points. By setting the inequalities as equalities, one can solve them to get the values of test size, n, and acceptance limit, c, that satisfy these equations. Because the binomial distribution is discrete, one typically cannot achieve the equalities for α and β exactly. (There are catalogs of test plans and software that can be readily used to obtain the values of c and n to meet particular risks.)
As a concrete example, suppose the test should be designed to ensure that helmets with an underlying penetration probability of θ = 0.005 have at least a 90 percent chance of passing the test. So θL = 0.005 and (1 – α) = 0.90, or α = 0.10. Further, suppose it was decided that if the penetra-
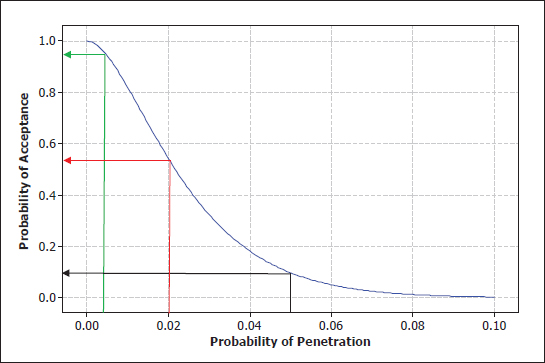
FIGURE 6-3 Operating characteristic curves of (c = 1, n = 77) plan with the desired risks. The black line shows the probability of acceptance for the plan when the true probability of penetration is 0.1; the green and red lines show the corresponding acceptance probabilities when the true penetration probabilities are, respectively, 0.005 and 0.02.
tion probability is θ = 0.05, which is an order of magnitude higher, there must be at most a 10 percent chance of passing the test. So, θH = 0.05, and β = 0.10. Therefore, the test is designed to discriminate between helmets with penetration probabilities of 0.005 and 0.05. In this example, both α and β are the same, but they do not have to be. These two risks are specified by the decision maker.
Figure 6-3 shows the OC curve for the 1-out-of-77 (1, 77) test plan that meets the above requirements. It has the desired properties at the specified penetration probabilities of 0.005 and 0.05. In practice, however, after a plan has been obtained, one should also examine its OC curve at other values of θ to see if it has reasonable (not too low or not too high) acceptance probabilities. In this case, if θ = 0.02 (a four-fold increase from the desired penetration probability), the acceptance probability is about 0.55. One may decide that this is too high and look for a more stringent plan—say one with c = 1 but a larger value of n. That change, however, would increase the manufacturer’s risk and decrease the government’s risk. The OC curve of an acceptance plan conveys a variety of incentives and disincentives to stakeholders in the acceptance decision.
Zero-Failure Plans
A common class of test protocols is based on zero-failures (i.e., c = 0). One reason is that the lower the value of c, the smaller the number of units to be tested, n, in order to achieve a particular level of government’s risk. However, there may be a false perception associated with zero-failure plans: Because it does not allow any failures, the quality of the products must be, in general, considerably higher than the government’s threshold quality. It is clear but worth reiterating that a zero-failure plan does not imply that the penetration probability is zero! For example, if the penetration probability is 0.03, the probability of zero penetrations in 20 shots is 0.54. This means that, even though there is a 3 percent chance of penetration, the 0-out-of-20 failure plan will pass the test more than half of the time. Therefore, an outcome of 0/20 does not imply zero penetration probability.
Robustness to Deviations from the Binomial Distribution
The preceding subsection was based on a framework in which the penetration probability θ was constant across all shots. This assumption does not strictly hold in helmet testing: the helmets are of different sizes, they are tested at different environmental conditions, and the shots are taken at multiple locations on the helmet. It is possible that the penetration probability is different at different helmet locations. When the penetration probabilities vary across shots, the number of penetrations, X, in n shots would not have a binomial distribution. Therefore, the OC curves computed under this model would not apply exactly. The question of interest is whether the binomial calculations are still useful.
The committee performed numerical investigations to examine the differences between the true OC curves and the OC curves obtained by assuming that the penetration probabilities are the same across all shots. It examined a range of deviations for the penetration probabilities. Further, it took the constant penetration probability for comparison to be the average of the varying probabilities. The study shows that the differences in the OC curves are negligible for the range of penetration probabilities and deviations that are relevant to the helmet situation.
Finding 6-1. RTP data aggregated over helmet sizes, environments, and shot locations may not have a constant underlying penetration probability. An evaluation of operating characteristics for modest departures from this situation indicates that the actual acceptance probabilities are negligibly different from those calculated assuming a constant underlying penetration probability. This means that the OC curves computed under the assumption of constant probability provide very good approximations.
6.3 STATISTICAL EVALUATION OF DOD PROTOCOLS FOR RESISTANCE TO PENETRATION
“Legacy” Protocol for the Advanced Combat Helmet
The legacy protocol, first specified by the program manager for the Advanced Combat Helmet (DoD IG, 2013), was a (0, 20) test plan. It involved testing four helmets, one each at four test environments (ambient, hot, and cold temperatures and seawater). Only large-size helmets were tested. For each helmet, the protocol required shooting a 9-mm bullet at five different locations, for a total of 20 shots. The five shots on each helmet were in a fixed shot sequence and pattern. No penetrations were allowed (i.e., it was a zero-failure plan).
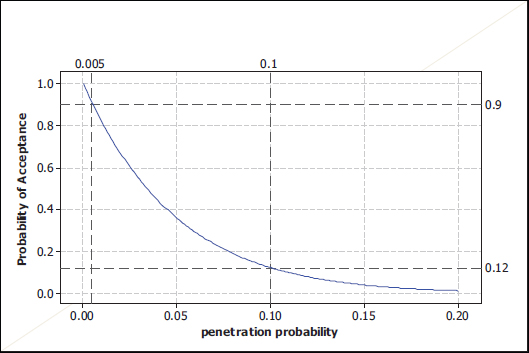
FIGURE 6-4 Operating characteristic curve for the legacy (0, 20) test plan. The darker dashed lines show the probabilities of acceptance for the plan when the true penetration probabilities are 0.10 and 0.005.
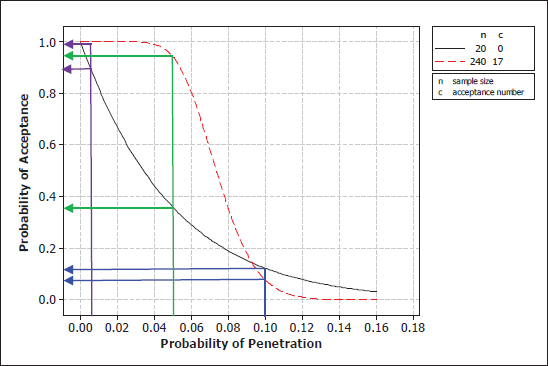
FIGURE 6-5 Comparison of the operating characteristic curves for (0, 20) and (17, 240) plans. The blue lines show the probabilities of acceptance for the two plans when the true probability of penetration is 0.1; the purple and green lines show the corresponding acceptance probabilities when the true penetration probabilities are, respectively, 0.005 and 0.05.
This legacy test plan was adapted from prior helmet protocols and was not designed to meet specified statistical risks. Nevertheless, one can study its properties through its OC curve in Figure 6-4. The acceptance probability is about 0.12 when the penetration probability is 0.10. In other words, if the underlying shot penetration probability is 0.10, the helmets will fail the demonstration test 88 percent of the time.
Consider the behavior of the curve to the left of θ = 0.10 and the implications for manufacturers. If a manufacturer wants to have a 90 percent chance or higher of passing the (0, 20) test, the helmet design and production process would have to achieve a penetration probability of θ = 0.005 or less.
Note that the manufacturer has to achieve a penetration probability considerably less than the government’s standard of θ = 0.10 to have a good chance of passing the (0, 20) test. While the government, by its specification of θ = 0.10 as its limit on penetration probability, may be willing to purchase helmets with, say, θ = 0.075, the manufacturer would not aim at that target because the chance of passing the (0, 20) test is too low for comfort—about 0.20 in Figure 6-5.
As noted earlier, the government’s risk at θ = 0.10 was 0.12. So, this plan does not strictly satisfy the 90/90 property (at most 10 percent government’s risk at penetration probability 0.10 or, equivalently, at least 90 percent chance of failing the test if the nonpenetration probability is 0.90.) One needs a 0-out-of-22 (0, 22) plan to satisfy this requirement. The 90/90 criterion was explicitly adopted by DOT&E in its subsequent protocols.
DOT&E’s (c = 17, n = 240) Protocol
In response to a Senate and House Armed Services Committee’s request, the Secretary of Defense asked DOT&E in 2007 to take over the responsibility to prescribe policy and procedures for the conduct of live-fire test and evaluation of body armor and helmets (DoD IG, 2013).
DOT&E decided to increase the number of helmets tested to 48 in order to cover a range of conditions and to have adequate precision in comparing any differences in penetration probability, or BFD, due to environment, helmet size, and shot location. The new protocol called for testing 48 helmets, 12 each for Small, Medium, Large, and Extra Large sizes. Three helmets of each size were conditioned in the four environments before testing. There were five shots at different helmet locations, leading to a total of 240 shots.
There are good statistical reasons to justify DOT&E’s increase in the number of helmets tested to 48 helmets from the Army’s 5. One gets more precise estimates of the penetration probability from 240 shots than from 20 shots. In addition, DOT&E’s plan allows better statistical comparison of possible differences between helmet sizes and environmental conditions.
To examine the properties of the (c = 17, n = 240)-plan, recall that if n is specified, one can control only one point on the OC curve, or one of the two risks, by the choice of c. With n chosen, the DOT&E approach was to specify that, for penetration probability of 0.10, the probability of acceptance (the government’s risk) should be no more than 10 percent. This is referred to as the 90/90 plan (corresponding to a rejection probability of at least 0.90 at nonpenetration probability of 0.90). To summarize, DOT&E’s (17, 240) plan was chosen by first increasing the sample size n to be 240 for statistical reasons. Then, the 90/90 standard was applied to get the maximum number of acceptable failures to be 17. Thus, there is a direct relationship between the 90/90 standard and the (17, 240) plan.
However, there is no scientific or empirical basis for specifying 0.10 as the acceptable limit for a helmet’s penetration probability. It appears that the 90/90 standard was chosen because of its use in body armor protocols1 and also because the legacy protocol approximately had this property. That specification led to the (c = 17, n = 240) test plan. The committee does not know if there was any attempt to control the manufacturer’s risk.
Figure 6-5 provides a comparison of the OC curves for the (0, 20) and (17, 240) plans. The two OC curves cross at about θ = 0.092. The (0, 20) plan has higher acceptance probabilities to the right of this penetration probability and has lower acceptance probabilities to the left. The two plans have about the same acceptance probabilities (government risks), in the neighborhood of θ = 0.10, as intended.
When θ = 0.005, near the region where the manufacturers are currently operating (see Chapter 5), the acceptance probability of the (0, 20) plan is about 0.9, while that of the (17, 240) plan is essentially 1.0. Thus, the (17, 240) plan has
_________________
1Personal communication between Christopher Moosmann, DOT&E, and Nancy Schulte, NRC, via e-mail on May 14, 2013.
lower manufacturer’s risk. Director Gilmore’s letter to Rep. Slaughter (see Appendix A) recognized that the DOT&E protocol would lessen the burden on manufacturers to pass the test with helmets with an underlying penetration probability less than the “standard” of 0.10. However, this is not necessarily an advantage.
Consider a comparison of the two plans when the penetration probability equals 0.05, which is a 10-fold increase in the penetration probability from the currently achieved level of around 0.005. For this value of θ = 0.05, the acceptance probability is about 0.38 for the (0, 20) plan, while it is about 0.95 for the (17, 240) plan. Thus, even if there is a 10-fold degradation in the penetration resistance of helmets, there is a 95 percent chance of accepting the helmets under the DOT&E protocol. Similar comparisons can be made at other values of θ to the left of the point where the two curves cross. For example, for any values of penetration probability of θ ≤ 0.04—a five-fold increase—the helmets will almost certainly be accepted. To the right of the crossing point, however, the (0, 20) plan has a higher acceptance probability (and hence poorer performance in terms of screening out helmets with high penetration probabilities, but still less than a 12 percent chance of acceptance).
A decision on which of the two plans is better comes down to deciding what is the relevant range of values of the penetration probability. DOT&E’s (17, 240) plan focuses around θ = 0.10, and its main objective is to prevent helmets with a 0.10 penetration probability or more from being accepted. The (17, 240) plan has comparable performance to the (0, 20) plan at this point and has lower acceptance probabilities for θ ≥ 0.10. So if this is the region of interest, then the (17, 240) plan is superior to the (0, 20) plan. However, if the objective of the plan is to provide an incentive for manufacturers to produce helmets at least as good as current helmets (θ ≤ 0.005), the (0, 20) plan is better in that it has a lower probability of acceptance for helmets that are not as good as current helmets up to a penetration probability of 0.10.
To evaluate a plan, one needs to consider the whole OC curve, not just one point that may have been used to specify the plan. The DOT&E plan focuses on the point at which θ = 0.10. Its main objective is to prevent helmets with a 0.10 penetration probability or more from being accepted. Available data show that the Department of Defense’s design and production specifications have led to helmets with a much lower penetration probability. The committee considers it appropriate to replace the current (17, 240) plan, in light of the available RTP data, with a plan that has the objective of providing an incentive for manufacturers to produce helmets at least as penetration resistant as current helmets (θ ≤ 0.005). The (17, 240) plan does not have that property.
Finding 6-2. Helmet manufacturers are currently producing helmets with a penetration probability near θ = 0.005, conservatively. If, as is the case for the (17, 240) plan, the manufacturers have a low risk of failing the test even when there is a 10-fold increase in the current penetration probability (from 0.005 to 0.05), this may provide a disincentive to maintain current levels of penetration resistance. In this sense, the (17, 240) plan is not as good as the legacy plan of (0, 20).
It is likely that manufacturers are more motivated by having a high probability of passing the test than they are in avoiding a penetration probability at the current DOT&E “standard” of 0.10, a value nearly two orders of magnitude higher than what current data indicate for a helmet penetration probability. If manufacturers have a very high probability of passing the test, even if there is a substantial increase in the penetration probability, the (17, 240) plan may have the unintended effect of leading to a reduction in helmet penetration resistance.
Recommendation 6-2. If there is a scientific basis to link brain injury with performance metrics (such as penetration frequency and backface deformation), the Director of Operational Test and Evaluation (DOT&E) should use this information to set the appropriate standard for performance metrics in the test protocols. In the absence of such a scientific basis, DOT&E should develop a plan that provides assurance that it leads to the production of helmets that are at least as penetration-resistant as currently fielded helmets.
Enhanced Combat Helmet Protocol: Modified DOT&E Protocol
The ECH protocol, a modification of the DOT&E protocol, is a 5-out-of-96 (5, 96) plan that involves taking two shots each at 48 helmets. The acceptance limit of c = 5 is based on the 90/90 criterion. Figure 6-6 provides a comparison of its OC curve with that of the (0, 20) plan. It shows that, if the penetration probability is 0.035, the manufacturer’s risk
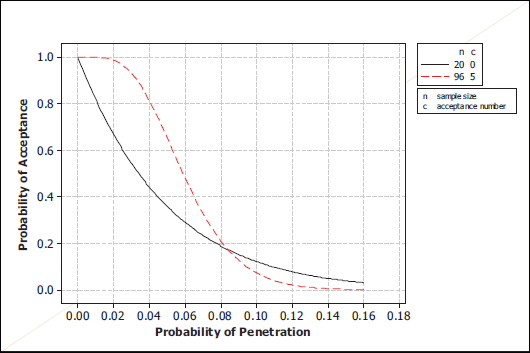
FIGURE 6-6 Comparison of the operating characteristic curves for (0, 20) and (5, 96) plans.
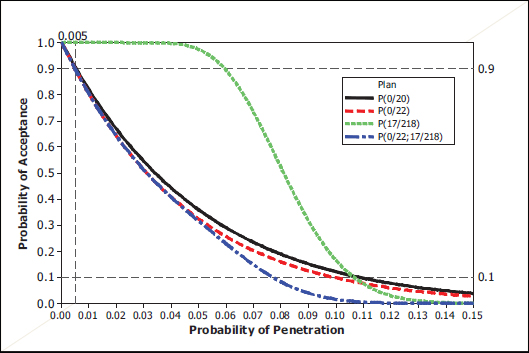
FIGURE 6-7 Operating characteristic curves for the hybrid plan and comparison to others.
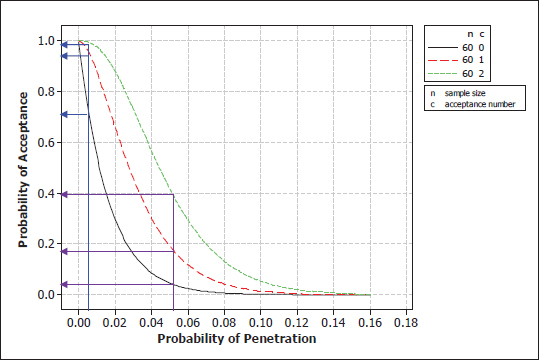
FIGURE 6-8 Operating characteristic curves for three plans with n = 60. The blue lines show the probabilities of acceptance for the three plans when the true probability of penetration is 0.05; the purple lines show the corresponding acceptance probabilities when the true penetration probability is 0.05.
is about 0.10 (i.e., there is a 90 percent probability of acceptance). Again, this is about an order of magnitude greater than the penetration probability that available data indicate. The above findings and recommendations pertaining to the full DOT&E protocol also apply here.
Army’s Modification of the DOT&E Protocol
In 2012, with DOT&E’s approval, the Army modified the (17, 240) plan to a hybrid (two-stage) protocol (U.S. Army, 2012). The two stages involve conducting a (0, 22) plan in the first stage; if the lot passes this test, then a second 17-out-of-218 (17, 218) plan is used, for a total of 240 shots.
Figure 6-7 provides a comparison of the OC curves of the hybrid plan with its component plans and also the legacy plan of (0, 20). It is intuitively clear that the OC curve of the hybrid plan should be below that of its two component plans—(0, 22) and (17, 218)—because it is more stringent than either one. Figure 6-8 confirms that this is indeed the case. The plan’s government risk when θ = 0.005 is around 0.10 (i.e., there is a 90 percent chance that helmets with penetration probability of 0.005 will be accepted). This is comparable to the (0, 20) legacy plan and also the first-stage (0, 22) plan. The government’s risk when θ = 0.10 is close to zero and much lower than the other three plans being compared.
Because of the first stage, the modified protocol maintains essentially the same incentive for a manufacturer to achieve a penetration probability in the 0.001 to 0.005 neighborhood, in order to have a high probability of passing the acceptance test. Further, thanks to the (0, 22) first-stage threshold, the protocol is considerably more stringent in rejecting submitted product with underlying penetration probability in the 0.05 to 0.10 range than is the (17, 240) plan in Figure 6-5. The (17, 218) criterion for Stage 2 would, by itself, give the impression that a penetration probability as high as 17/218 = 8 percent is acceptable, which is quite different from Stage 1 of the plan. Fortunately, if a product was submitted that had an underlying 0.08 probability of penetration, that helmet is unlikely to pass the (0, 22) first stage test.2
With this hybrid protocol, the Army has actually made this hybrid test plan more stringent than the earlier (0, 20) plan, particularly for penetration probabilities in the range of 0.05 to 0.12.
Finding 6-3. The Army’s modified plan satisfies the criterion that it will provide an incentive for manufacturers to produce helmets that are at least as penetration resistant as current helmets.
6.4 EXAMINATION OF SEPARATE TEST PLANS BY HELMET SIZE
The committee made a recommendation in Chapter 5 related to testing by separate helmet sizes (Recommendation 5-3). It is neither the committee’s intention nor its charge to recommend a specific alternative. Instead, the committee discusses the properties of several plans to indicate the considerations that DOT&E should take into account in making its decision.
If the current practice of 240 total shots is continued, there would be 60 9-mm shots for each helmet size. Figure 6-8 compares some possible acceptance plans. It shows that at the current operating level of around θ = 0.005, the three plans have acceptance probabilities of about 0.76, 0.95, and almost 1, respectively, for c = 0, 1, and 2. One could decide
_________________
2The Army’s hybrid plan essentially separates the procurement decision from the characterization analysis that is made possible by the complete set of 240 shots.
that the manufacturer’s risk of 1 – 0.76 = 0.24 for the c = 0 plan is too stringent. One can compare the two remaining plans at θ = 0.05, which represents a 10-fold increase in penetration probability. The c = 2 plan has a 40 percent chance of acceptance, while the c = 1 plan has about a 19 percent chance of acceptance. One can then conclude that a 40 percent chance of accepting helmets with penetration probability of 0.05 is too high, in which case the c = 2 plan is not desirable. If the 19 percent is at an acceptable level, then one can go with the 1-out-of-60 (1, 60) plan.
An alternative approach to determining a plan for each helmet size is to specify the manufacturer’s and government’s risks and derive both the sample size and acceptance limit that would meet those criteria. Earlier in this chapter the committee derived a (1, 77) plan that had a 90 percent chance of acceptance probability at θ = 0.005 and a 10 percent chance of acceptance probability at θ = 0.05. This plan provided an incentive for manufacturers to achieve helmets with a penetration resistance that is at least as good as current helmets and protected against the acceptance of helmets that are 10 times worse than current helmets. By increasing the number of helmets tested in each environment to 4, the number of tests for each helmet size would be 80. A 1-out-of-80 (1, 80) plan would have an OC curve with comparable (slightly lower) acceptance probabilities as the (1, 77) plan.
It is important that the Army and DOT&E compute the upper confidence bounds for the penetration probability after the test is conducted. This confidence bound will provide additional information on the quality level of the helmets being tested.
As an example, consider the (17, 240) test plan. Suppose the test is conducted, and the result was one penetration. The estimated penetration probability of 1/240 = 0.004. The 90 percent upper confidence bound for the underlying penetration probability based on these data is 0.016. On the other hand, if there were 10 penetrations, and the estimated penetration probability is 0.04, an order of magnitude higher, the upper 90 percent confidence limit would be 0.06. The upper 95 percent confidence limit is exactly equal to the designed value of 0.10 only if there are 17 penetrations. In other words, the 90/90 conclusion is pertinent only if the maximum number of acceptable penetrations is observed during the test.
In these three examples, the observed number of failures differs substantially, so the data provide additional information on the underlying penetration probability and, hence, the quality of the helmets that will be manufactured. The only exception is with zero-failure plans where the observed number of failures is fixed up front and only a single outcome (zero failures) is allowed for a successful outcome.
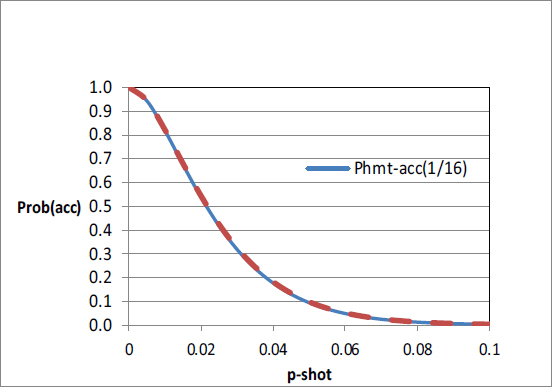
FIGURE 6-9 Comparison of helmet-level and shot-level test protocols. Blue line corresponds to a helmet-level plan; and dashed red line corresponds to the (1,77) shot-level plan.
Recommendation 6-3. The government’s risk should be controlled at much lower penetration levels than the 0.10 value specified by the 90/90 standard.
6.6 FUTURE TEST PROTOCOLS: HELMET AS THE UNIT OF TEST
The current FAT protocols are based on a shot as the unit of test: The (17, 240) plan takes 240 shots, and FAT is successful if there are 17 or fewer penetrations. However, the basic unit of production is a helmet, not a shot location on a helmet. While it is important to test RTP at different locations, it seems desirable to make accept/reject decisions based on a helmet as the test unit. For example, observing five penetrations on a single helmet is quite different from a single penetration at the same location on five different helmets. A helmet-level test, one that scores a helmet as a failure if there is at least one penetration, would distinguish between these two cases: one failure in the former case, and five failures in the latter.
This section studies the properties of FAT plans defined at the helmet level. This option with respect to lot acceptance testing is discussed in Chapter 8.
Consider the rule where a helmet is scored a failure if there is at least one penetration among the five shots on that helmet.3 Let the penetration probabilities for the five locations be denoted by θ1, θ2, θ3, θ4, and θ5. Further, for the sake of illustration, suppose the penetrations at different locations
_________________
3In practice, one might declare a helmet failure at the first penetration and not complete the five shots, and thus reduce the cost of testing. However, for the sake of further characterization analyses, the protocol might require that each suite of five shots might be completed. Note that this is part of the test protocol to evaluate helmet performance. There is no assumption that this test plan represents a situation in which a soldier takes five helmet hits.
are independent events. Let θ(helmet) denote the probability of a helmet failure. Then,
1 – θ(helmet) = (1– θ1) × (1– θ2) × (1– θ3) × (1– θ4) × (1– θ5)
Suppose one wants a helmet-level test plan with the properties that the probability of acceptance is at least 0.90 when θ(helmet) = 0.025 and at most 0.10 when θ(helmet) = 0.25. The blue solid line in Figure 6-9 shows the OC curve for this 1-out-of-16 (1, 16) plan: test n = 16 helmets, and the FAT is successful if no more than one helmet fails.
One can compare this helmet-level plan with a plan based on shots as the unit of test. When the θi’s are all small, θ(helmet) can be approximated as the sum of the θi’s, the individual shot-location probabilities. For illustrative purposes, it is assumed that all the θi’s are the same and equal θ. Then, if θ(helmet) = 0.025, θ approximately equals 0.005; further, if θ(helmet) = 0.25, θ approximately equals 0.05. Earlier in this chapter, it was shown that a shot-level plan that satisfied these properties was a (1, 77) plan, shown in Figure 6-3. This OC curve is superimposed in Figure 6-9 as the dashed red line.
The two plans have virtually identical OC curves. This is not surprising. Two or more penetrations on any one helmet has a small probability for the range of θ values considered. So, one failure in 16 helmets means most likely that only one penetration occurred among the 80 shots in the 16 helmet tests. A (1, 80) plan is not much different from one of (1, 77).
Finding 6-4. Test plans with a helmet as the unit of test are more desirable and interpretable than those based on shots as the unit. When the penetration probability of a shot is small, the helmet-level test plans and the shot-level test plans will require about the same number of shots.
Recommendation 6-4. The Department of Defense should consider developing and using protocols with helmets as the unit of test for future generations of helmets.
DoD IG (Department of Defense Inspector General). 2013. Advanced Combat Helmet Technical Assessment. DODIG-2013-079. Department of Defense, Washington, D.C.
U.S. Army. 2012. Advanced Combat Helmet (ACH) Purchase Description, Rev A with Change 4. AR/PD 10-02. Soldier Equipment, Program Executive Office—Soldier, Fort Belvoir, Va.


