
4
Baseline Information on MHDV Fleet and Methodology for Collection
The committee was assigned the following task regarding baseline information:
The committee will review an updated analysis of the makeup and characterization of the medium- and heavy-duty truck fleet, including combination tractors, trailers, busses and vocational vehicles. The committee also will review the methodology for providing on-road information on fuel consumption.
The committee’s work is thus similar to Task 3, “Model Year 2011+ Fleet Baseline,” as set forth in the National Highway Traffic Safety Administration (NHTSA) contract with Southwest Research Institute (SwRI).1,2 The NHTSA objective for the contract with SwRI is
Augment information available on baseline for the MY2011+ fleet by vehicle segment (engines compliant with 2010 criteria pollutant requirements).
The scope is
Statistics on 2011+ MD/HD on-road fuel consumption and emissions by vehicle class, information on components and technology penetration, vehicle types and duty cycles within each class, how many Class 2b and 3 vehicles are chassis vs. engine dyno certified, share of empty miles within each class and share of alternate fuel vehicles.
The schedule is
In process of procuring all available R.L. Polk registration data and forecasts for Class 2b-8 vehicles (including motor coaches, RV’s and trailers).
Fleet Manager Survey: Frost & Sullivan to survey a minimum of 100 motor carrier fleet managers for in-use characteristics of latest regulatory generation of Class 2b-8 vehicles including fleet make-up (e.g., final vehicle builds and vocational), typical use (mileage, fuel economy and freight tonnage), and fuel economy/emissions technology levels.
Since little of the requested information has been received from NHTSA, SwRI, R.L. Polk, or Frost & Sullivan, the committee has focused its efforts on addressing NHTSA’s procedure for establishing a useful baseline. This chapter covers the following: (1) why do we need a baseline?; (2) criteria for a good baseline collection process; (3) comments on NHTSA, SwRI, and Frost & Sullivan survey; and (4) comments on the CalHEAT report for the California Energy Commission. It also contains Findings and Recommendations, as well as annexes.
WHY DO WE NEED A BASELINE? NHTSA SHOULD HAVE A BASELINE IN ORDER TO INFORM ITS RULEMAKING
A baseline can measure different characteristics of the truck fleet, depending upon the ultimate use of the information. In regulatory proceedings, a baseline may refer to a baseline vehicle in each regulated category for the purpose of applying a regulatory standard. More broadly, a baseline may characterize the truck fleet at a given point in time with respect to types of vehicles in use, technologies being deployed (for example, technologies such as auxiliary engine loads and aftertreatments were left out of GEM’s first iteration) on vehicles in each vehicle class, work performed by the vehicles, and fuel consumption of individual vehicles as well
______________
1 James Tamm, National Highway Traffic Safety Administration, “NHTSA MD/HD Vehicle Fuel Efficiency Technology Study,” Personal communication to NRC staff, April 8, 2013.
2 Tom Reinhart, Southwest Research Institute Labs, Presentation to the committee on June 25, 2013.
as the fleet as a whole. It is in the latter sense that NHTSA has asked the committee to examine the data available and devise a methodology for collecting data to establish a baseline.
It is important to measure how the industry responds to regulation so that subsequent phases of regulation can be based on a clear view of the impact of previous regulatory stages. Comparing subsequent years’ data to the baseline data will help to measure the impact of regulations. For example, one of the clear risks of regulating such a complex industry as trucking is the risk of unintended consequences. Tracking change over time will allow NHTSA to observe unintended consequences and allow correction in subsequent phases of regulation. Monitoring performance over time will also allow NHTSA to observe and measure obstacles to technology adoption, which can improve the effectiveness of subsequent stages of regulation. Knowledge of technology penetrations in the baseline will help guide the stringency of future standards with respect to the effects of projected penetration trends.
One could also use baseline data to measure how the fleet would change in response to key external developments such as fuel price changes or technology developments in the absence of regulation. The large original equipment manufacturers (OEMs) have simulation-based specification-defining tools that seek to give the customer an efficient vehicle for meeting freight and work requirements. Regulations, by mandating equipment and simulation tools, may force vehicle choices that differ from these OEM efforts to provide efficient vehicles. Using the OEM simulation tools one could calculate changes from the baseline that would have taken place absent the regulations. In this way, a potentially useful measure of the effects of regulation could be obtained.
Which Year Should the Baseline Capture?
Since regulations are set for new vehicles, the baseline should be representative of recent vehicle purchases and recently promulgated regulations. In that way, NHTSA will be able to analyze incremental effects of new regulations. In particular, the baseline should capture the effects of the 2010 NOx standards. In addition, it would be desirable to have more complete information on the effects of the Phase I Rule on the fleet before setting Phase II standards. However, the schedule NHTSA has established for data gathering and analysis seems to preclude a baseline year that largely incorporates the effects of 2014 greenhouse gas (GHG) standards. Consequently, model years (MY) 2010, 2011, 2012, and 2013 would be the most appropriate years for establishing the baseline. It can be seen from the press releases of various manufacturers that some portions of the 2013 product mix have already been certified to the 2014 standards. Those data provide a small window into manufacturer compliance.
Which Data Should the Baseline Contain?
Ideally, the data should describe the features of the fleet relevant to rulemaking. The information would include:
- Vehicle data. It is important to collect information on a vehicle basis. While important for understanding national trends, fuel consumption and ton-miles driven on a fleet basis will not sufficiently inform the setting of regulations. Consequently, the database should collect information on a vehicle basis, including the type of vehicle (tractor-trailer, straight truck, motor-coach), the engine type (diesel, natural gas, gasoline, hybrid), the fuel-saving technologies (aerodynamics, tires, transmissions, axles), ton-miles driven, work performed, and fuel consumption. This will allow NHTSA to measure the adoption rates of specific technologies, monitor their performance, and assess market barriers to adoption. The individual vehicle data can then be aggregated by segment where necessary to arrive at updated parameters for use in modeling and simulation.
- In-use data. Collection of data on real-world experience will allow NHTSA to update the GHG Emissions Model (GEM) as well as to perform more accurate cost-benefit analyses of energy-saving technologies. Ideally, the database will reflect real-world experience on the use of fuel-saving technologies and include information that quantifies the experience with fuel-saving technologies, including estimated returns on investment.
- Sample. Data are needed on small as well as large trucking fleets. The trucking industry is very diverse, with many small fleets accounting for a significant proportion of total trucks in use. This diversity resides in the size of the fleet, whether the user owns or leases equipment, the types of operation of the vehicles (e.g., freight movement, services such as ambulances or utility bucket trucks, construction, or refuse hauling), and whether the operation is for hire or private carriage. Combinations of these attributes exist in most all segments, and the baseline should either include them all or specifically state which ones are not being included. It appears that the R.L. Polk data will be procured for Classes 2b through 8 vehicles, including motor coaches, recreational vehicles (RVs), and trailers, but the Frost & Sullivan survey is for 100 motor carrier fleet managers. It is not clear how NHTSA will gather in-use characteristics for nonfleet vehicles such as personal pickups and vans, personal motor coaches, RVs, and other nonfleet vehicles.
CRITERIA FOR A GOOD BASELINE DATA COLLECTION PROCESS
The data collection process should be replicable so that NHTSA will be able over time to measure the impacts of regulation, improve the efficiency of regulation, and adjust for unintended consequences. For the data to be replicable, the collection process should not be too large a burden on respondents in terms of cost and time. A data collection process that is too burdensome is likely to be ignored or result in spotty responses that would undermine the quality of the data.
COMMENTS ON NHTSA, SWRI, AND FROST & SULLIVAN SURVEY
On December 19, 2012, NHTSA published in the Federal Register3 a proposal for collection of information on Medium- and Heavy-Duty Trucks. Comments were received from several parties based on the following draft publications:4
- Frost & Sullivan Fleet Profile Screener Draft v4 December 4, 2012, and
- Questionnaire Draft v8 December 4, 2012.
No subsequent drafts were made available to the committee for review. Based on the committee’s review of the drafts received and comments made on the drafts by the parties that provided comments on the federal notice5 (American Trucking Associations, Daimler Trucks North America, NAFA Fleet Management Association, National Transportation Equipment Association, Recreational Vehicle Industry Association, and the Truck and Engine Manufacturers Association), the committee judges that the survey approach and questions asked are problematic and unlikely to provide the needed information. In short, the survey has the following shortcomings:
- Limited to fleets of 100 or more vehicles, which does not capture the diversity of the trucking companies that make up the fleet.
- Limited to 100 respondents.
- Focused heavily on Class 8 on-road fleets and does not represent vocational fleets.
- Unclear with respect to model year designation, because engine MY and vehicle MY might differ.
- Load information is difficult to assess.
- Trailer and work truck body equipment is limited and too basic.
- Information on technologies utilized is limited and does not include additional fuel-saving practices of fleets.
- The survey will take much longer to complete than suggested. Finding the information requested will be difficult and burdensome.
- The survey does not take into account tractors that are used for both long-haul and local delivery.
- Information is aggregated and not broken down into class or vocation.
- Engine and transmission information is limited, along with information on other major components.
- Some OEMs have begun to manufacture products that already meet GHG 2014 regulations.
A number of commenters noted the focus on 2010 and newer engines and vehicles. The reason for this focus and the purpose of the survey were not clear to some commenters. The committee understands the purpose of the survey is to obtain data for creating a baseline of information prior to the implementation of the current 2014 GHG regulations for MHDVs. The committee also believes that information will be needed as the regulations take effect, and consideration is given to future regulations. Since NHTSA and the Environmental Protection Agency (EPA) concentrate on the manufacture of new vehicles in these regulations, the committee understands the need to instead focus only on vehicles that meet the current 2010 engine emissions regulations. These would be vehicles with MY2010 engines, regardless of the vehicle model year.
NHTSA should employ alternative means to develop a reliable and repeatable process for obtaining the information that is needed to inform the efficacy of current regulations and promulgation of future regulations.
COMMENTS ON THE CALHEAT REPORT FOR THE CALIFORNIA ENERGY COMMISSION
The California Hybrid, Efficient and Advanced Truck Research Center (CalHEAT) recently completed a study of trucks in California (Silver and Brotherton, 2013). The report provides valuable information related to the baseline of vehicles in California. The methodology used may serve as a model for developing a baseline for commercial vehicles in the entire United States. The abstract from that study reads as follows:
The California Hybrid, Efficient and Advanced Truck Research Center (CalHEAT) was established by the California Energy Commission in 2010. It is operated by CALSTART to perform research into planning, commercializing, and demonstrating truck technologies for more fuel-efficient medium- and heavy-duty vehicles and to reduce emissions. The role of the research center is to coordinate the development of a Research and Market Transformation Roadmap to deliver clear actionable steps to help meet or exceed the
______________
3 77 Fed. Reg. 75257.
4 Available at http://www.regulations.gov/#!docketDetail;D=NHTSA-2012-0170. Accessed September 30, 2013.
5 See http://www.regulations.gov/#!docketDetail;D=NHTSA2012-0170. Accessed September 30, 2013.
2020 goals for California in petroleum reduction, carbon reduction, and air quality standards, and identify longer term goals through 2050. Medium- and heavy-duty trucks account for 9% of greenhouse gases in California, and approximately 20% of fuel consumption. Improvements in efficiency or reduction of petroleum use by trucks provide a substantial opportunity to reduce emissions. (Silver and Brotherton, 2013)
The CalHEAT reports also note that
… as the first step in the development of this Roadmap, CalHEAT performed a California Truck Inventory Study to better understand the various types of trucks used in California, their relative populations, and how they are used. The analysis included nearly 1.5 million commercial medium- and heavy-duty trucks, grouped by weight and application, to establish a baseline inventory and determine fuel use and potential for efficiency and emissions improvements. CalHEAT also conducted Phase I research to characterize the California truck population by size, use, and emissions, and prepared a baseline report of available technology and pathways for improvement. Phase II research identified gaps along the pathways and barriers to progress, and developed a decision-making tool to identify the most efficient choices to meet the State’s goals. (Silver and Brotherton, 2013, p. 61)
The committee recommends as follows:
Recommendation 4.1: NHTSA and EPA should implement the following practices as part of a good baseline data collection process:
- To the extent possible, existing data sources should be exploited. NHTSA should take advantage of existing private sources such as R.L. Polk. (See the annex to this chapter for other sources of baseline data.)
- Data already collected in connection with certification of medium- and heavy-duty vehicles (MHDVs) should be utilized in establishing the baseline. To the extent other agencies collect data on MHDVs, the data collection should be harmonized and streamlined to minimize the collection burden.
- Other extant data analysis processes in the industry (e.g., data products of firms that interview truck builders and fleets for industry forecasting) should be utilized. Here, the processes could be expanded to satisfy NHTSA’s ongoing data collection needs.
Finding: There is no existing baseline of data that meets the needs of a baseline for the MHDV fleet. The Frost & Sullivan survey process, as presented to the committee in documents dated December 2012, will not provide reliable and repeatable information.
Finding: The collection of R.L. Polk registration data and forecasts is appropriate for Class 2B to Class 8 vehicles (including motor coaches, RVs, and trailers). It is the recognized source within the industry.
Recommendation 4.2: NHTSA should establish a repeatable, reliable data collection process as soon as possible. In addition to continuing data procurement with SwRI and R.L. Polk, NHTSA should investigate outside sources—such as FTR, ACT Research, SmartWay, the North American Council for Freight Efficiency (NACFE), and the American Transportation Research Institute (ATRI)—to obtain a repeatable, reliable baseline as well as future data. These sources could use the R.L. Polk data and conduct clarifying, deeper interviews with truck and trailer builders, manufacturers, and fleets to elicit specific ongoing data on technologies procured and fuel consumption.
Recommendation 4.3: Because the government operates a wide variety of trucks and buses that are a potential source of data, NHTSA should explore with the General Services Administration, the U. S. Postal Service, and the Federal Transit Administration (FTA) the advisability of building a database on the government-operated truck fleet and municipal bus fleets purchased with grants from FTA. The database should capture information on new vehicle purchases by model year, fuel-saving technologies utilized, maintenance and operating costs, and the fuel-consumption performance of the vehicle.
Finding: The CalHEAT study produced a valuable inventory or baseline for the State of California using R.L. Polk data. In addition, the data from the discontinued Vehicle Inventory and Use Survey (VIUS) was useful in the past for safety analysis, freight planning, and transportation system analysis.
Recommendation 4.4: NHTSA should establish a repeatable survey for private fleets. Possible models for such a survey include the CalHEAT study, the discontinued VIUS methodology, and other private data sources detailed in the annex to this chapter.
American Trucking Associations (ATA). 2012a. U.S. Freight Transportation Forecast to 2023.
ATA. 2012b. American Trucking Trends: 2012.
Silver, F., and T. Brotherton. 2013. Research and Market Transformation Roadmap to 2020 for Medium- and Heavy-Duty Trucks. CEC-XXX-2013-XXX. Draft Rev # 7 Dated 6-14-2013. Sacramento, Calif.: California Energy Commission.
ANNEX 4A OTHER SOURCES OF BASELINE DATA IN THE INDUSTRY
Because many aspects of commercial vehicles and hauling of freight are regulated by various government entities, information is often publicly collected, aggregated, and disseminated to the industry. Some is done by government agencies, such as the U.S. Department of Energy and the U.S. Department of Transportation. Some is done by trade organizations that help their members do benchmarking against competitors to improve their operations. The following seven sources will be discussed briefly; however, this is not an exhaustive list for creating a baseline for future regulations or for creating a new industry metric tracking or estimating GHG emissions, fuel economy, fuel efficiency, or freight efficiency.
- FTR
- ACT Research
- American Trucking Associations (ATA) reports
- ATRI
- Wards Auto
- R.L. Polk
- North American Council for Freight Efficiency (NACFE)
FTR
FTR is one of two organizations that are used monthly by companies throughout trucking to understand the business of hauling freight.6 Using both public and private sources, including regular interviews with fleets, it compiles information ranging from current registrations of vehicles through industry trends to freight hauled. Annex Figures 4A-1 through 4A-4 and Tables 4A-1 and 4A-2 exemplify just a few of the information displays from a typical report. This organization should be contacted to determine if the needed
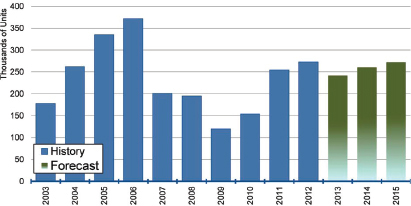
ANNEX FIGURE 4A-1 North American Class 8 Factory Shipments (annual). SOURCE: FTR.
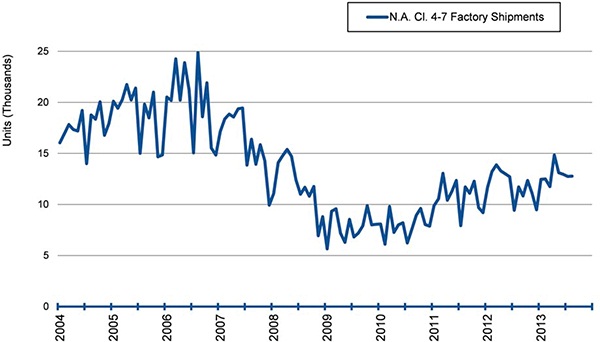
ANNEX FIGURE 4A-2 North American Class 4 through Class 7 Factory Shipments. SOURCE: FTR.
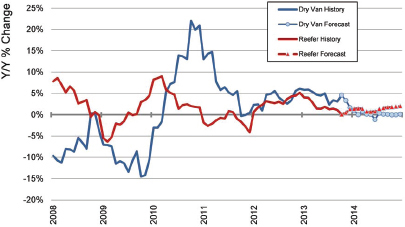
ANNEX FIGURE 4A-3 Truck loadings: dry van and refrigerated trailers. SOURCE: FTR.
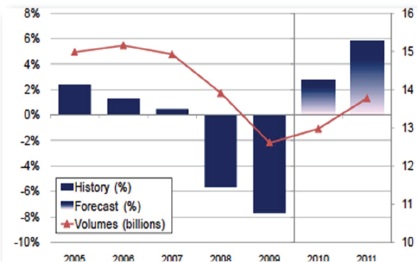
ANNEX FIGURE 4A-4 U.S. truck ton-miles (total). SOURCE: FTR, copyright 2010.
______________
6 Further information is available at http://www.ftrassociates.com.
ANNEX TABLE 4A-1 Quantities of Freight Hauled in Class 8 Vehicles, Historic and Projected
| 2013 | 2014 | Annual | ||||||||||
| Q1 | Q2 | Q3 | Q4 | Q1 | Q2 | Q3 | Q4 | 2012 | 2013 | 2014 | 2015 | |
| Tons (000,000) | 2,917 | 2,942 | 2,982 | 3,009 | 3,021 | 3,035 | 3,045 | 3,083 | 11,334 | 11,850 | 12,185 | 12,458 |
| Y/Y change (%) | 3.60 | 4.10 | 5.80 | 4.80 | 3.60 | 3.20 | 2.10 | 2.50 | 2.20 | 4.60 | 2.80 | 2.20 |
| Ton-miles (000,000) | 652,305 | 658,222 | 660,476 | 667,090 | 667,971 | 670,206 | 670,737 | 681,183 | 2,518,788 | 2,638,092 | 2,690,097 | 2,741,162 |
| Y/Y change (%) | 5.10 | 4.80 | 4.50 | 4.60 | 2.40 | 1.80 | 1.60 | 2.10 | 1.30 | 4.70 | 2.00 | 1.90 |
| Length of haul | ||||||||||||
| Short haul | 87,653 | 88,676 | 90,419 | 90,788 | 91,526 | 92,343 | 92,937 | 93,505 | 345,139 | 357,536 | 370,312 | 380,489 |
| Y/Y change (%) | 1.80 | 2.90 | 5.40 | 4.20 | 4.40 | 4.10 | 2.80 | 3.00 | 2.30 | 3.60 | 3.60 | 2.70 |
| Medium haul | 323,425 | 322,483 | 324,364 | 327,478 | 328,223 | 329,402 | 329,258 | 335,740 | 1,233,436 | 1,297,751 | 1,322,623 | 1,346,680 |
| Y/Y change( %) | 5.90 | 5.00 | 5.10 | 4.80 | 1.50 | 2.10 | 1.50 | 2.50 | 0.70 | 5.20 | 1.90 | 1.80 |
| Long haul | 241,227 | 247,063 | 245,693 | 248,824 | 248,221 | 248,461 | 248,543 | 251,938 | 940,213 | 982,806 | 997,163 | 1,013,994 |
| Y/Y change (%) | 5.2 | 5.30 | 3.30 | 4.30 | 2.90 | 0.60 | 1.20 | 1.30 | 1.90 | 4.50 | 1.50 | 1.70 |
| Type of good | ||||||||||||
| Raw | 90,839 | 92,554 | 94,951 | 96,814 | 96,632 | 96,891 | 96,298 | 99,603 | 354,931 | 375,158 | 389,423 | 394,503 |
| Y/Y change (%) | 2.20 | 4.60 | 8.20 | 7.80 | 6.40 | 4.70 | 1.40 | 2.90 | 0.20 | 5.70 | 3.80 | 1.30 |
| Processed | 226,466 | 229,690 | 231,407 | 232,988 | 233,968 | 234,944 | 236,030 | 238,557 | 874,191 | 920,551 | 943,500 | 967,374 |
| Y/Y change (%) | 5.10 | 5.50 | 5.00 | 5.60 | 3.30 | 2.30 | 2.00 | 2.40 | 0.70 | 5.30 | 2.50 | 2.50 |
| Manufactured | 334,999 | 335,978 | 334,118 | 337,288 | 337,370 | 338,371 | 338,409 | 343,023 | 1,289,667 | 1,342,383 | 1,357,173 | 1,379,284 |
| Y/Y change (%) | 5.90 | 4.50 | 3.10 | 2.90 | 0.70 | 0.70 | 1.30 | 1.70 | 2.10 | 4.10 | 1.10 | 1.60 |
NOTE: Data are seasonally adjusted. Y/Y, year to year.
SOURCE: FTR.
ANNEX TABLE 4A-2 Quantities of Freight Hauled in Classes 5 Through 7 Vehicles, Historic and Projected
| 2013 | 2014 | Annual | ||||||||||
| Q1 | Q2 | Q3 | Q4 | Q1 | Q2 | Q3 | Q4 | 2012 | 2013 | 2014 | 2015 | |
| Tons (000,000) | ||||||||||||
| Total Classes 5-7 | 362 | 362 | 365 | 368 | 370 | 372 | 373 | 378 | 1,400 | 1,457 | 1,494 | 1,524 |
| Y/Y change (%) | 3.90 | 3.60 | 5.1 | 3.70 | 2.10 | 3.00 | 2.20 | 2.80 | 2.00 | 4.10 | 2.50 | 2.00 |
| Ton-miles (000,000) | ||||||||||||
| Total Classes 5-7 | 33,874 | 33,887 | 33,942 | 34,214 | 34,291 | 34,382 | 34,374 | 34,918 | 130,884 | 135,917 | 137,966 | 140,134 |
| Y/Y change (%) | 4.70 | 4.00 | 3.40 | 3.20 | 1.20 | 1.50 | 1.30 | 2.10 | 1.10 | 3.80 | 1.50 | 1.60 |
| Length of haul | ||||||||||||
| Short haul | 23,214 | 23,039 | 23,176 | 23,341 | 23,445 | 23,566 | 23,576 | 23,963 | 89,140 | 92,770 | 94,550 | 96,236 |
| Y/Y change (%) | 5.00 | 3.90 | 4.00 | 3.40 | 1.00 | 2.30 | 1.70 | 2.70 | 0.80 | 4.10 | 1.90 | 1.80 |
| Medium haul | 9,939 | 10,114 | 10,035 | 10,142 | 10,138 | 10,136 | 10,125 | 10,291 | 38,886 | 40,230 | 40,691 | 41,288 |
| Y/Y change (%) | 4.20 | 4.30 | 2.40 | 2.90 | 2.00 | 0.20 | 0.90 | 1.50 | 1.40 | 3.50 | 1.10 | 1.50 |
| Long haul | 722 | 734 | 730 | 731 | 708 | 680 | 673 | 664 | 2,858 | 2,917 | 2,726 | 2,610 |
| Y/Y change (%) | 1.50 | 3.70 | 1.60 | 1.50 | −1.90 | −7.40 | −7.80 | −9.20 | 2.30 | 2.10 | −6.60 | −4.20 |
| Type of good | ||||||||||||
| Raw | 4,572 | 4,638 | 4,767 | 4,844 | 4,847 | 4,859 | 4,834 | 4,978 | 17,974 | 18,821 | 19,517 | 19,741 |
| Y/Y change (%) | 1.20 | 3.40 | 7.40 | 6.80 | 6.00 | 4.80 | 1.40 | 2.80 | 0.10 | 4.70 | 3.70 | 1.10 |
| Processed | 8,317 | 8,380 | 8,332 | 8,376 | 8,409 | 8,443 | 8,470 | 8,574 | 32,128 | 33,405 | 33,897 | 34,620 |
| Y/Y change (%) | 4.80 | 4.50 | 2.90 | 3.60 | 1.10 | 0.80 | 1.70 | 2.40 | 1.20 | 4.00 | 1.50 | 2.10 |
| Manufactured | 20,986 | 20,870 | 20,842 | 20,994 | 21,036 | 21,080 | 21,071 | 21,366 | 80,781 | 83,692 | 84,553 | 85,772 |
| Y/Y change (%) | 5.50 | 3.90 | 2.80 | 2.30 | 0.20 | 1.00 | 1.10 | 1.80 | 1.20 | 3.60 | 1.00 | 1.4 |
NOTE: Data are seasonally adjusted.
SOURCE: FTR.
information is already available, or if it can be obtained. Also, going forward, with this level of information it may be possible to create new metrics related to GHG emissions, fuel economy, fuel efficiency, or freight efficiency.
ACT Research
ACT Research is a second organization that publishes reports monthly used by companies throughout trucking. Its website is http://www.actresearch.net. Using both public and private sources, it compiles information on tonnage, vehicle population, and vehicle unit age, among others. Annex Figures 4A-5 through 4A-11 show a few sample graphs from a typical monthly report. This organization should be contacted to determine if the needed information is already available and accessible.
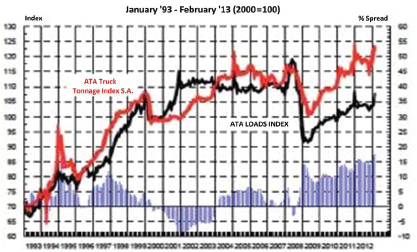
ANNEX FIGURE 4A-5 ATA truck tonnage index and ATA truck loads index NOTE: S.A., seasonally adjusted. SOURCE: ACT Research, copyright 2013.
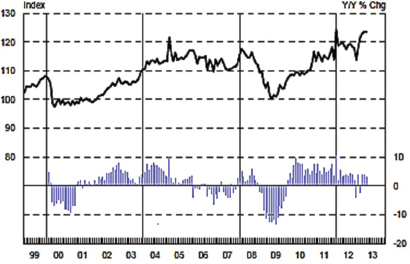
ANNEX FIGURE 4A-6 ATA truck tonnage index (seasonally adjusted). SOURCE: ACT Research, copyright 2013.
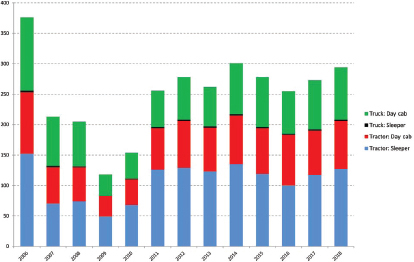
ANNEX FIGURE 4A-7 North American Class 8 production. SOURCE: ACT Research.
ANNEX FIGURE 4A-8 North American Class 5 thru Class 7 production. SOURCE: ACT Research.
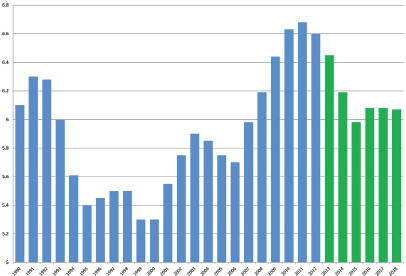
ANNEX FIGURE 4A-9 Class 8 population (freight per unit). SOURCE: ACT Research.
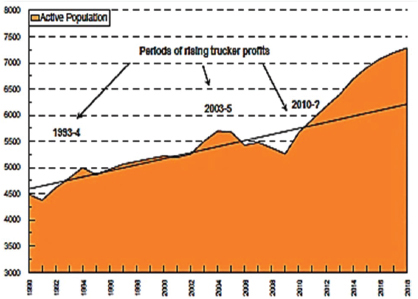
ANNEX FIGURE 4A-10 Average age of active population of U.S. Class 8 vehicles. SOURCE: ACT Research.
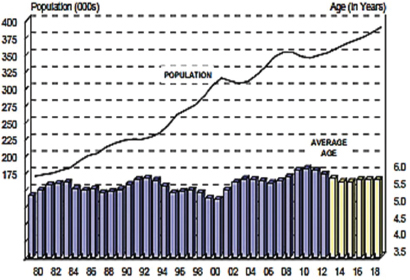
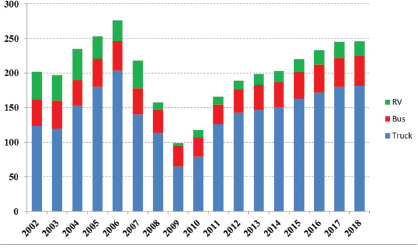
ANNEX FIGURE 4A-11 Population and average age of refrigerated vans. SOURCE: ACT Research.
ATA Reports
American Trucking Associations is the premier trade association for fleets in the United States. Thousands of fleets are members of the various state associations. ATA compiles and publishes annual reports on freight transportation trends and activities. It publishes a monthly Truck Tonnage Report, which is used as input to FTR and ACT Research monthly reports. Since ton-miles is an important characteristic to track for existing and future fuel use regulations, ATA may be an excellent source going forward (see Figures 4A-12 to 4A-14 and Table 4A-3). From Figure 4A-13, used in a public webinar in 2013, it can be seen that tonnage has been tracked for many years. However, this information is currently aggregated and does not include the necessary detail by class of vehicle.
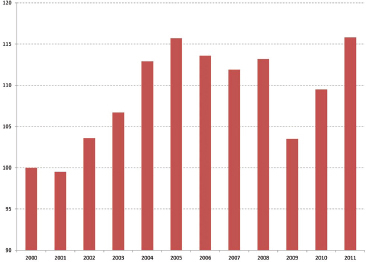
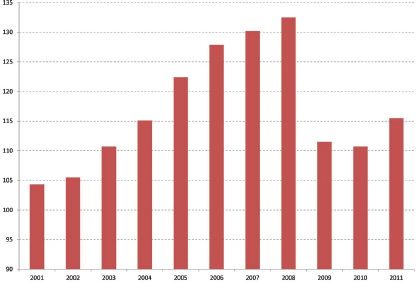
ANNEX FIGURE 4A-12 Tonnage index of ATAs for hire (seasonally adjusted). NOTE: Year 2000 = 100. SOURCE: ATA 2012b.
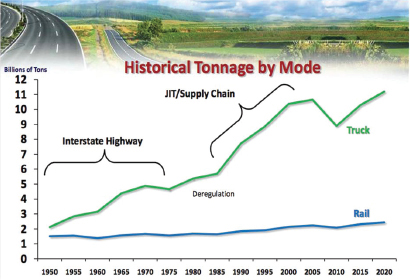
ANNEX FIGURE 4A-13 Historical tonnage by mode. SOURCE: ATA 2012a.
ANNEX FIGURE 4A-14 Index of less-than-truckload revenue per ton (seasonally adjusted) of ATAs for hire. NOTE: Year 2000 = 100. SOURCE: ATA 2012b.
ANNEX TABLE 4A-3 U.S. Retail Truck Sales (thousands)
| Year | Class | ||||||||
| I | II | III | IV | V | VI | VII | VIII | Total | |
| 2000 | 5,124.2 | 2,421.5 | 116.3 | 47.4 | 29.1 | 51.2 | 122.6 | 211.5 | 8,123.8 |
| 2001 | 5,112.8 | 2,507.7 | 101.5 | 52 | 24.4 | 42.4 | 91.6 | 139.6 | 8,072.0 |
| 2002 | 5,007.3 | 2,564.7 | 80 | 37.8 | 24 | 45.1 | 69.3 | 146 | 7,974.4 |
| 2003 | 6,268.5 | 2,669.2 | 90.8 | 39.6 | 29 | 51 | 66.8 | 142 | 9,357.0 |
| 2004 | 6,457.7 | 2,796.0 | 107.3 | 47.1 | 36.3 | 69.8 | 75.3 | 203.2 | 9,792.6 |
| 2005 | 6,585.8 | 2,525.0 | 166.9 | 48.5 | 46.3 | 60.2 | 88.9 | 252.8 | 9,777.3 |
| 2006 | 6,143.3 | 2,430.5 | 149.8 | 50.3 | 49.5 | 70 | 90.8 | 284 | 9,268.2 |
| 2007 | 5,682.3 | 2,662.6 | 165.9 | 51 | 44.9 | 53.8 | 70.4 | 151 | 8,841.9 |
| 2008 | 4,358.3 | 1,888.2 | 134.8 | 36.4 | 40.3 | 39.4 | 48.9 | 133.5 | 6,679.8 |
| 2009 | 3,527.9 | 1,305.8 | 111.7 | 19.9 | 23.9 | 22 | 39.1 | 94.8 | 5,145.1 |
| 2010 | 4,244.6 | 1,513.8 | 161.4 | 12.1 | 31 | 29.1 | 38.4 | 107.2 | 6,136.8 |
| 2011 | 4,714.1 | 1,735.6 | 195.3 | 10.5 | 40.7 | 41.2 | 41.2 | 171.4 | 6,951.2 |
SOURCE: ATA (2012b).
ATRI
As can be seen from a number of the preceding charts and graphs above, the American Transportation Research Institute (ATRI) is the trucking industry’s not-for-profit research organization and is an autonomous member of the ATA Federation.7 ATRI is a recognized source of data on the industry. The list of publications and areas of research are too numerous to list.
Wards Auto
Wards Auto is often cited as the source of information on production and sales, by vehicle size and brand. Often they have used R.L. Polk registration data for this information.8
R.L. Polk
R.L. Polk registration data are the recognized standard for information on commercial vehicles and their use.9 This basic database is used by many organizations in trucking, by vehicle OEMs, and by suppliers to better understand volumes of trucks by class and vocation.
North American Council for Freight Efficiency
NACFE conducts an annual Fleet Fuel Study, where fleets provide a rolling 10 year history for the adoption of various technologies (see Annex Figure 4A-15). These data, although limited to a few adopters, could provide a solid, repeatable process for determining technology adoption rates. Annex Figure 4A-15 shows adoption rates over the years for various categories of technologies of all participating fleets.
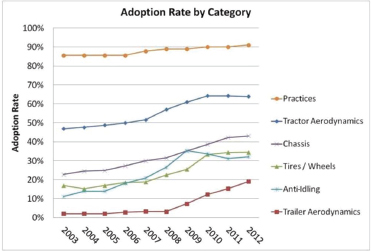
ANNEX FIGURE 4A-15 Rates at which various technologies were adopted. SOURCE: North American Council for Freight Efficiency. Available at http://nacfe.org/wp-content/uploads/2014/01/NACFE2013-Study-Report-FINAL-March.pdf. Accessed December 11, 2013.
______________
7 The American Transportation Research Institute website is available at http://atri-online.org.
8 The Wards Auto website is available at http://wardsauto.com.
9 The R.L. Polk website is available at https://www.polk.com.
ANNEX 4B ADDITIONAL WAYS TO OBTAIN INFORMATION IN THE FUTURE
Since the fuel economy and GHG regulations for MHDVs are new, it is important to establish methods and processes that will serve both industry and government in the coming decades. Some sources of information already exist, such as information on bills of lading, fuel purchases, and road use taxes. All such sources of information should be investigated for possible use on an ongoing basis for tracking items of interest to these regulations and their cost and their effectiveness. New sources of information are coming online. Federal and state governments have regulations requiring the reporting of numerous items that can be used for creating a baseline and regularly tracking the improvement in the industry in fuel usage and ton-miles. This includes hours of service, inspection reports, bills of lading, weigh station inspections, and fuel tax reporting. In the near future, the Federal Motor Carrier Safety Administration is expected to mandate the use of recorders for drivers’ hours of service. These could become excellent sources for tracking information on the vehicles. California has a rule for electronic trailer refrigeration units that includes a telematics monitor requirement. Also, as mentioned in Chapter 2, the EPA SmartWay program is another source for fuel consumption information from participating fleets. As NHTSA deliberates on potential rules and regulations for V2X (Vehicle to Vehicle, Vehicle to Infrastructure), the regulatory instrument could be crafted to provide new sources of information on fuel use and GHG emissions. EPA and NHTSA should establish a plan for obtaining information in the future that takes account of all public, private, and governmental sources of information.


