
5
Natural Gas Vehicles: Impacts and Regulatory Framework
Natural gas (NG) accounts for about 25 percent of all energy use in the United States yet only 0.1 percent is used in transportation, equivalent to about 0.5 billion gallons per year of petroleum fuel. However, in the short time since the release of the report Technologies and Approaches to Reducing the Fuel Consumption of Medium- and Heavy-Duty Vehicles (NRC, 2010), NG has emerged as a viable option for commercial vehicles, driven by the rapid drop in its cost as a result of new technology. Yet, uncertainties exist relative to the extent and quality of reserves, safety and community acceptance, fuel cost and continued availability, sustainability, etc. This chapter starts with a brief review of why NG has emerged as a potentially significant fuel for medium- and heavy-duty vehicles (MHDVs). It then discusses the technology and infrastructure that will be needed for NG-fueled trucks, which can operate on either compressed natural gas (CNG) or liquefied natural gas (LNG). It describes the regulatory framework for greenhouse gas (GHG) emissions (primarily carbon dioxide, or CO2) and fuel economy standards. Finally it presents the key findings and recommendations relevant to NG-fueled trucks.
SUMMARY OF SUPPLY AND DEMAND TRENDS FOR NATURAL GAS FUEL
To better understand what this potential means for the United States and its energy future, the National Research Council’s (NRC’s) Board on Energy and Environmental Systems (BEES) convened a meeting on September 11, 2012, assembling technical experts from private industry as well as representatives of government and academia. The primary goals were to assess the current state of NG development and to identify key research and technological gaps. This effort was augmented by presentations to a meeting of the committee on July 31 and August 1, 2013. This discussion is largely based on those forums.
NG production, driven by shale gas (Figure 5-1), began accelerating in 2005 and is expected to continue to grow (Figure 5-2). There are three key enabling technologies for the current boom: horizontal drilling, which was largely proven in the 1990s; geosteering, the use of real-time, on-site geologic data to guide the well bore; and hydraulic fracturing, or fracking, which involves the use of fracturing fluid (predominately water-based) to fracture the rock and proppants (e.g., sand) to hold the fractures open, allowing the trapped gas to flow through the shale and into the well.1 These technologies have allowed the extraction of NG from huge reserves that previously had been economically inaccessible. The Interstate Natural Gas Association of America expects NG consumption to grow 1.6 percent per year.2
Increased production has driven prices down, which has led to increased demand, in particular for electricity generation and transportation fleet use. It has also benefited residential, commercial, and industrial customers. Manufacturing appears to be on the rebound in this country in part because of the low price of NG, which is used as both a fuel and a feedstock for petrochemicals. Potential NG production levels could exceed growing demand, and the United States could become a net gas exporter by 2015.3 However, low current prices do little to encourage more drilling to expand production, and higher prices will dampen demand. It is not clear where supply and demand will balance.
With the recent, rapid increase in shale gas development has come increasing concern about its environmental impacts, both positive and negative. The substitution of NG for coal for electricity generation has been an important factor in reducing U.S. emissions of GHG. Horizontal drill-
______________
1 Stephen A. Holditch, Texas A&M University, “Shale gas development,” Presentation to the Board on Energy and Environmental Systems, September 11, 2012.
2 Donald Santa, International Natural Gas Association of America, “Pipelines make it possible,” Presentation to the Board on Energy and Environmental Systems, September 11, 2012.
3 Majida Mourad, Cheniere Energy, Inc. “LNG exports— How much and how soon,” Presentation to the Board on Energy and Environmental Systems, September 11, 2012.
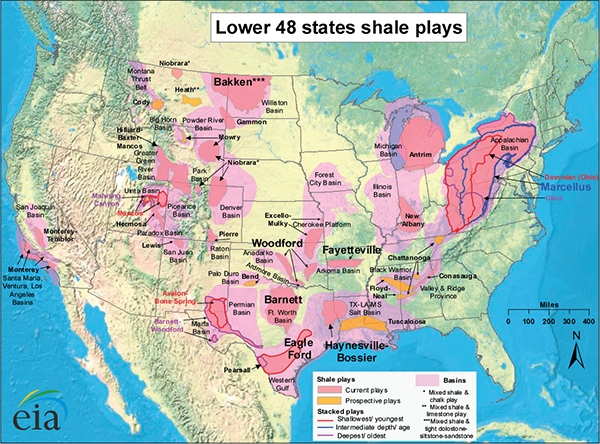
FIGURE 5-1 Shale gas plays in the continental United States. SOURCE: Energy Information Administration (EIA). Available at http://www.eia.gov/oil_gas/rpd/shale_gas.pdf. Accessed December 23, 2013.
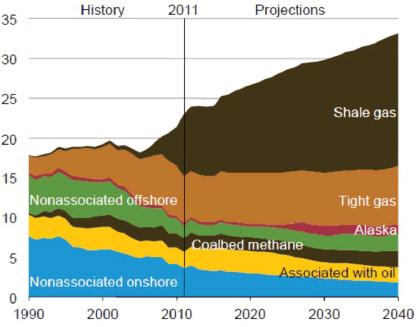
FIGURE 5-2 U.S. natural gas production. SOURCE: EIA (2013a).
ing causes much less surface disruption than conventional drilling—for example, Apache Corporation’s Horn River Development uses a drill pad of just 6.3 acres to recover gas from approximately 5,000 acres. However, this means that local pollution (e.g., particulate matter, volatile organic compounds, and nitrogen oxides [NOx]) may be more concentrated. In addition, NG largely consists of methane, which is a powerful GHG. Leakage, most of which is estimated to come from gas production activities, could negate the hoped-for climate benefits of reducing CO2 emissions by replacing other fossil fuels with NG. Methane has a shorter lifetime in the atmosphere than carbon dioxide, but its higher radiative forcing—that is, its ability to redirect heat that would otherwise escape the atmosphere—means that over 100 years it has 20 times the GHG impact of CO2. One analysis concluded that after taking into account current estimates of leakage, converting heavy-duty diesel trucks would have a net negative effect on climate change for centuries.4 One estimate of gas leakage, based on measurements at 190 onshore gas production sites, is 0.42 percent of the total gas production (Allen et al., 2013). Note that this leakage exceeds the amount of NG currently used in transportation. Other estimates of fugitive emissions have been significantly higher (e.g., Howarth et al., 2011).
Water contamination is a widely discussed concern about hydraulic fracturing. This can be divided into two main issues: (1) underground contamination related to well integrity and (2) disposal of wastewater from the hydraulic fracturing process.5 At the surface, an integrated management plan is needed to address the supply, handling, reuse, and disposal of the fracking fluid to ensure sustainability throughout the production cycle.
In the electric power sector, the low price of NG has directly caused the closure of coal plants, as it has become more economical to use combined-cycle NG plants (with thermal efficiencies up to 65 percent) for electricity production. However, fuel price is the dominant contributor to the cost of electricity (55 percent). One analysis concluded that the break-even fuel price is between $4 and $6 per million British thermal units (mmBTUs).6
In the heavy-duty transportation sector, price has a less direct effect on the use of NG as a fuel because delivering and compressing (or liquefying) the fuel account for a large share of the price at the pump. The break-even price of NG relative to diesel fuel is around $6 per million BTU (predelivery, not at the pump). If the costs of NG vehicles themselves come down relative to the costs of their diesel counterparts (discussed in the next section), the break-even value could be as high as $9 to $12 per million BTU. If, as projected by the Energy Information Administration (EIA), the price of NG in 2035 is about $7 per million BTU (EIA, 2013a), its use in the transportation sector will likely depend in part on future technological improvements.
Currently, the biggest obstacles to NG use for freight transportation are (1) the lack of widespread and dependable infrastructure, (2) the substantial increase in weight and cost of the fuel tanks compared to diesel tanks, and (3) the availability of NG vehicles, although almost all MHDV manufacturers now offer a NG engine. More detailed discussion of infrastructure and technology follows in a later section of this chapter. Pipeline and infrastructure investment in the United States and Canada is likely to exceed $200 billion over the next 25 years (see footnote 2).
EIA expects increased production, lower imports, higher exports, and higher prices, as shown in Table 5-1.
NATURAL GAS ENGINES AND VEHICLES
Overview
NG internal combustion engines are a well-developed and established technology. There are over 11 million NG vehicles worldwide, including passenger vehicles. In the United States, NG-fueled MHDVs, especially transit buses,
______________
4 Steven Hamburg, Environmental Defense Fund, “Methane leakage from natural gas production, transport and use—Implications for the climate,” Presentation to the Board on Energy and Environmental Systems, September 11, 2012.
5 Mark Boling, Southwestern Energy, “Forum on Unconventional Natural Gas Issues: Water Quality,” Presentation to the Board on Energy and Environmental Systems, September 11, 2012.
6 Revis James, Electric Power Research Institute, “The Role of Natural Gas in the Electricity Sector,” Presentation to the Board on Energy and Environmental Systems, September 11, 2012.
TABLE 5-1 Projections of Domestic Production and Prices for Natural Gas and Diesel Fuel Price
| Year | ||||
| 2012 | 2025 | 2040 | ||
| Production (quadrillion BTU) | 24.59 | 32.57 | 38.37 | |
| Henry hub price ($) | 2.75 | 5.23 | 7.65 | |
| Price delivered to transportation ($) | 14.64 | 15.57 | 19.67 | |
| Diesel fuel price ($) | 8.80 | 29.02 | 34.53 | |
NOTE: Prices are per million BTU in 2012 dollars. Note that a million BTU is equivalent to about 8 gallons of diesel fuel. Thus, natural gas costs on the order of $2.00 per gallon equivalent, much less than diesel fuel.
SOURCE: EIA (2013a).
have been incentivized for roughly 20 years in some states as part of emission-reduction programs. For MHDVs to use natural gas fuel, the most significant differences from current vehicles are the onboard fuel storage method and, for compression ignition (diesel-fueled) vehicles, the means of introducing and igniting the fuel in the engine. On-vehicle storage is either by high-pressure (3,600 psi is typical) CNG cylinders or by cryogenic containers filled with LNG. An illustration comparing on-vehicle storage of NG with diesel is shown in Figure 5-3.
For the same truck mission, the CNG tank plus fuel weighs about four times as much as a diesel tank plus fuel. LNG tanks and fuel weigh about twice as much as diesel. The cost of either CNG or LNG storage adds $40,000 to $50,000 to the cost of a heavy truck, but with the current low price of NG, the payback period for long-haul trucks is on the order of only 2 years.
There are three general technical classifications of NG engines, as shown in Table 5-2. Either CNG or LNG can replace gasoline with only modest changes to the spark ignition (SI) engine. Compression ignition (CI) engines are more complicated; NG can be used in combination with diesel fuel (dual-fuel); or it can supply all the energy to a high-pressure direct-injection (HPDI) CI engine, in which a small amount of diesel fuel is needed to achieve ignition.
Table 5-2 notes several advantages and disadvantages of each configuration.
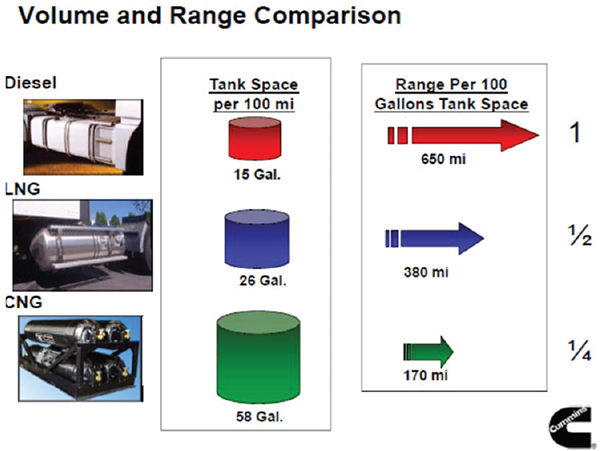
FIGURE 5-3 Comparison of diesel and NG fuel tanks. SOURCE: John Wall, Cummins, Inc., “Opportunities and barriers for natural gas: Expanding natural gas in transportation,” Presentation to the Board on Energy and Environmental Systems on September 11, 2012.
TABLE 5-2 Natural Gas Engine Technology Comparison
| Dedicated NG | Dual Fuel | HPDI | ||
| Technology | Spark ignition Throttle to control A/F Lean or stoichiometric/EGR Two-/three-way catalyst A/T | Compression ignition With or without EGR Diesel + premixed NG DOC DPF+SCR A/T system | Compression ignition EGR Diesel pilot + in-cylinder NG injection Not dual fuel—all power from NG DOC DPF + SCR A/T system | |
| Advantages | 100% diesel substitution Lowest emissions v. other NG technologies Simple, passive aftertreatment LNG or CNG | Power density similar to diesel Efficiency similar to diesel No spark plugs Potentially retrofittable on existing diesel engine Can run on diesel only | Power density similar to diesel Efficiency similar to diesel No spark plugs 95% diesel substitution | |
| Disadvantages | Spark plug life 10-15% lower efficiency than diesel, better efficiency than gasoline PFI Lower power density Knock limited | Substitution limited to 50-80% Unburned methane emissions Misfire at light loads Knock at high loads | High system cost/complexity Requires both fuels, always LNG + cryogenic in-tank pump for high-pressure injection | |
NOTE: A/F, air:fuel ratio; A/T, aftertreatment; DOC, diesel oxidation catalyst; EGR, exhaust gas recirculation; PFI, port fuel injection; SCR, selective catalytic reduction; DPF, diesel particulate filter.
SOURCE: Tim Frazier, Cummins Westport, “Cummins Westport Natural Gas-Fueled Engines,” Presentation to the committee on July 31, 2013.
These configurations of SI, pilot ignition, and dual fuel have existed for many years, but under very different emissions standards. At least 11 different engine displacements for CNG/LNG MHDVs are expected to be available by 2015. As more original equipment manufacturers (OEMs) are introducing NG options to their product lines, the share of CNG/LNG MHDVs continues to grow.
Details of seven engines are presented in Table 5-3. They range in displacement from 6.0 L to 12.7 L. The engines are predominantly SI, capturing the simplicity of fuel/air mixing with stoichiometric combustion and facilitating criteria emission control with the similarly simple three-way catalyst (TWC). These NG engines typically are based on diesel engines (not SI) to achieve the durability and reliability expected for trucking applications. For example the Cummins-Westport engine has over 80 percent of its parts in common with the base diesel-fueled engine (ISX12). However, the SI combustion system is less efficient than CI engines by roughly 15 percent. One manufacturer expects to offer a HPDI compression ignition model that should approach diesel engine efficiency. A Westport Innovations 15L-HPDI sold for about 7 years but was taken off the market in October 2013; it does not appear in the table.
Figure 5-4 depicts the types of NG-fueled vehicles that are available and the examples of engines for those vehicle classes. The engines shown from Ford and GM are conversions of OEM-built vehicles where, upon delivery, customers use an OEM-qualified vehicle modifier that supplies the fuel tanks, lines, and special fuel injectors. Depending on the size of the tank, these modifications can cost from $6,000 to $9,500. The NG-fueled vehicles offered by Ford, GM, and Chrysler are all derived from gasoline SI engines and can operate as bi-fueled configurations. Bi-fuel indicates that vehicles are equipped with both CNG and gasoline fuel systems; switching from gas to gasoline is automatic. This process can significantly extend vehicle range when CNG refueling is not available. Certain of the heavier vehicles are equipped only with CNG fuel systems. Figure 5-4 does not include aftermarket conversions procured after the sale of the vehicle.
As of 2010, the number of medium- and heavy-duty NG vehicles in the United States is estimated to have been between 30,000 and 50,000, out of roughly 10 million total MHDVs (TIAX for American Natural Gas Association [ANGA]).
Fuel Consumption and GHG Comparisons of Natural Gas and Diesel Engines
When a fuel is combusted, its CO2 release per unit heat released is a function of its carbon content. Because it has a relatively low carbon content, NG releases about 28 percent less CO2 per BTU of heat than diesel fuel. However, SI engine efficiency is considerably lower than that of mature diesel engines, especially at light loads, partially offsetting the inherent GHG benefit of NG. In addition, unburned methane may be emitted by the vehicle, and upstream emissions from the production and delivery of the NG must be considered in a well-to-wheels comparison. Methane is a very potent GHG, so if these emissions are significant, NG vehicles could contribute more to GHG emissions than diesel vehicles.
Several studies have compared CO2 emissions of diesel and NG vehicles and engines in driving and test cycles.
TABLE 5-3 Features of Available Natural Gas Engines
| Engine Description | Vortec 6.0L V8 gasoline conversion bi-fuel |
ISB6.7-G purpose built diesel derivative | PSI 8.8L-G purpose built | ISL-G purpose built diesel derivative | Doosan GL11 purpose built | ISX12-G purpose built diesel derivative | D13-LNG diesel derivative diesel pilot |
| Parameters | |||||||
| Manufacturer | GMC | Cummins | Pow er Solutions | Cummins | Doosan | Cummins | Volvo |
| Vehicle Vocational Target | CL 2b-6 Van, Trk | CL6 Trk,SchlBus | CL 6-8 Truck | CL6-8 Truck, | CL6-8 Truck, | CL 8 Truck, Bus | CL 8 Truck |
| Expected NG form | CNG | CNG or LNG | CNG | CNG or LNG | CNG | CNG or LNG | LNG |
| Number ofCylinders | V8 | 6 | V8 | 6 | 6 | 6 | 6 |
| Displacement (L) | 6.0 | 6.7 | 8.8 | 8.9 | 11.1 | 11.9 | 12.7 |
| Displ/Cyl (L) | 0.75 | 1.1 | 1.1 | 1.5 | 1.8 | 2 | 2.1 |
| Combustion System | SI-stoic | SI-stoic | SI | SI-stoic | SI-stoic | SI-stoic | CI |
| Compression Ratio | >10.5 | 12.1 | 15.6 | ||||
| Fuel System Description | Port injection | Electronic throttle body mixing | Electronic throttle body mixing | Electronic throttle body mixing | Electronic throttle body injection | Electronic throttle body mixing | LNG-diesel dual fuel injectors; diesel pilot |
| Air Handling System Description | naturally aspirated | WG-Turbo; CAC | Turboc harged | WG-Turbo; CAC | Turbocharged, CAC | WG-Turbo; CAC | VGT; CAC |
| EGR (Y/N) | N | Y-HPL | N | Y-HPL | Y-LPL | Y-HPL | Y |
| Aftertreatment Descrptn: 2010 Criteria Emissions | TWC | TWC | TWC | TWC | TWC | DOC,DPF & SCR | |
| Rated RPM | 5000 | 2600 | 3400 | 2200 | 2200 | 2100 | 1700 |
| Rated kW/L | 28.1 | 36.1 | 22.7 | 26.9 | 22.9 | 25 | 27.9 |
| Rated kW(HP) | 225'(301) | 242'(325) | 200'(268) | 239'(320) | 253'(340) | 298'(400) | 354'(475) |
| Max Torque N-m(lb-ft) | 452'(333) | 1017'(750) | 1356'(1000) | 1356'(1000) | 1627'(1200) | 1966'(1450) | 2373'(1750) |
| Issues & Unique Barriers | bi-fuel | both fuels, alw ays | |||||
| Production available | Y | 2015 | mid 2014 | Y | 2014 | Y | mid 2014 |
| Resource | I | E | F | B | G | B | D |
Notes: 1 bi-fuel means non-simultaneous fuel (natural gas and gasoline) supply to engine
While the results differ somewhat, NG engines and vehicles generally emit about 5 to 20 percent less CO2 (Krupnick, 2010; Kamel et al., 2002; Greszler, 2011). The advantage for NG is very dependent on the drive cycle. One estimate of the impact of methane emissions, shown in Figure 5-5, is that they reduce the CO2-equivalent GHG emissions benefit of NG from 13 percent to only 5 percent.
This review of the data comparing diesel and NG engines affirms that the chemical advantage of NG for low GHG emissions is largely (but not completely) offset by the lower efficiency of most NG-fueled heavy-duty engines. This will need to be considered in setting specific GHG and fuel consumption standards for medium- and heavy-duty vehicles using NG, as was done in setting different standards for gasoline and diesel engines.
Safety: On-Vehicle NG Storage
CNG has been used successfully for many years to power commercial vehicles operating in limited-range applications, usually in urban areas. With the recent increase in the availability of low-cost NG, it is anticipated that its use in long-haul Class 7 and Class 8 trucks will increase, especially using LNG as a means of extending vehicle range. Crash-related safety risks associated with NG storage in larger vehicles compared with diesel fuel risks do not appear to be appreciably different. However, because the number of NG-fueled commercial vehicles is small compared with diesel-fueled vehicles, that conclusion is uncertain at this time. Furthermore, because public crash databases do not contain information on fuel type, they cannot provide categorical insight on risk.
In tractor vehicles, diesel tanks are often mounted on the outside of the tractor frame rails beneath the driver and occupant access doors. This location is exposed to side impacts from other vehicles, side impacts with objects, truck rollovers, and opposite direction sideswipe crashes. In single unit trucks (SUTs), the tanks are often located below the bed, which is more protected.
If a NG tank is ruptured and the gas is ignited, the fire will be appreciably different from a fire involving diesel fuel. The risk to the driver and occupants from such events is not well understood due to a lack of data and documented crash experience.
LNG is at much lower pressure and would not ignite so violently, but the tank shells are more complex to provide thermal insulation and may be more vulnerable to puncture than high-pressure CNG tanks. The extreme cold (−260 °F) of LNG presents risks of its own. There is little information on accidents involving NG trucks because so few are on the road, but experience with diesel trucks provides some useful
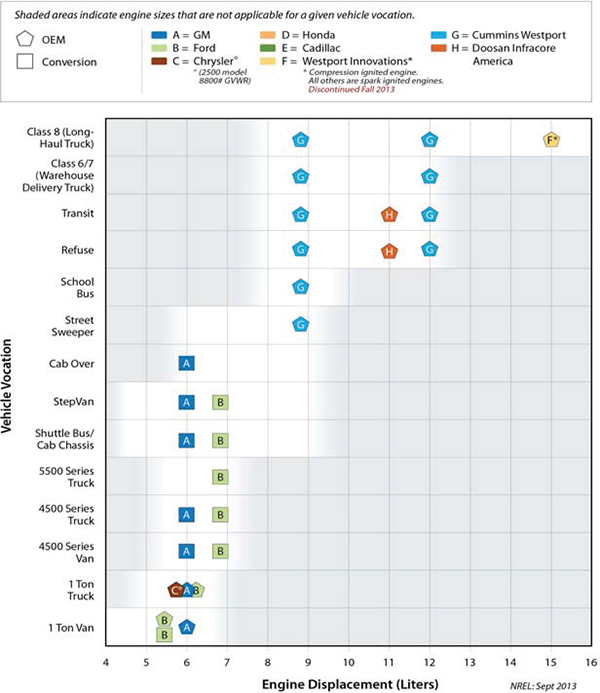
FIGURE 5-4 Available natural gas vehicles and OEM-authorized conversions. SOURCE: NREL.
information. In particular, fires (from all causes, not just fuel) are involved in accidents responsible for 14.2 percent of all fatalities and serious injuries in tractors, but only 4.8 percent in SUTs (UMTRI, 2013). These data suggest that protecting NG tanks in tractor applications will be very important for safety. Rollovers are the most frequent source of fatalities for both vehicle types, but that is likely to be true no matter which fuel is used. Heavy trucks are 30 to 40 times heavier than passenger vehicles. When crashes occur, they tend to be very damaging to cab structures and auxiliary components, particularly when large fixed objects are encountered.
There are various NG tank options available for large truck applications. Type 4 CNG cylinders have a “plastic core and are fully wrapped with a composite, such as carbon fiber. Other less expensive options are Type 2 and Type 3 CNG tanks, which have a steel or aluminum core and are composite wrapped.”7 For LNG-fueled vehicles, Dewar flask cryogenic tanks are used to keep the fuel in its liquid state. An LNG fuel tank can hold between 56 and 80 diesel-equivalent gallons. LNG is the preferred form of NG fuel if the daily operating range is over 400 miles. Given the diversity of NG tanks available for the heavy truck market, the crash characteristics, and associated risks, a review of technical standards and safety-related issues appears to be warranted, particularly with respect to tank type, location, and shielding. At present, there are two SAE-recommended practice
______________
7 Kenworth, “Kenworth Truck Company Offers Advice on Spec’ing for Natural Gas Power.” Available at http://www.kenworth.com/news/news-releases/2011/december/kenworth-truck-company-offers-advice-on-specing-for-natural-gas-power.aspx. Accessed March 12, 2014.
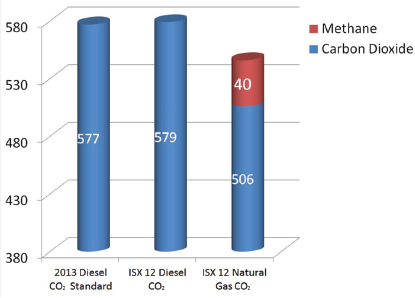
FIGURE 5-5 Comparison of emissions from natural gas and diesel engines. NOTE: bhp, brake horse power; g CO2, grams carbon dioxide. Natural gas emissions were calculated as follows: CO2 engine emissions + [(CH4 engine emissions – CH4 limit) * global warming potential] = 506 + [(1.7 – 0.1) * 25] = 546. The Federal Test Procedure (FTP) was employed. SOURCE: Tim Frazier, Cummins Westport, “Cummins Westport natural gas-fueled engines,” Presentation to the committee on July 31, 2013.
standards for medium- and heavy-duty NG vehicles. SAE J2343 focuses on LNG while SAE J2406 addresses CNG. SAE J2343 refers to tank placement, but neither standard covers tank shielding requirements to prevent punctures during crashes. Industry could benefit from best practice directives to minimize safety risks associated with NG fuel tanks on commercial vehicles.
Technology Improvement Opportunities
Although the engines available today are robust and capable, improvements could further increase efficiency and reduce maintenance costs. Areas where further R&D for NG engines would be beneficial are listed in Table 5-4.
It has been suggested that in addition to needed advancements in engines and aftertreatment, a uniform national standard for NG quality for vehicular use is needed. Higher carbon content hydrocarbons in LNG tanks can lead to fluid stratification, and the composition of CNG tanks can affect autoignition, combustion behavior, and engine power density. The Engine Manufacturers Association recommends a minimum methane number of 80 for CNG, a maximum inert content of 4 percent, and a 16,200 BTU/lb minimum energy content, in addition to limits on contaminants such as water and sulfur compounds, among others (EMA, 2010). Activities to support standard setting are in progress in the Society of Automotive Engineers (SAE) and the Coordinating Research Council (CRC), and ISO-15403 has been published as a European standard for NG vehicle fuel (Kauling, 2013). Assurance of a minimum quality for in-use compressed and liquefied motor vehicle NG fuel could allow for the design of more efficient and less costly engines. However, a standard for in-use motor vehicle NG could require further processing of some pipeline gas before compression or liquefaction. Given the limited demand for motor vehicle NG currently envisioned, compared to nationwide consumption for other purposes such as home heating and power generation, it is not clear if suppliers of NG would invest in the gas cleanup needed for motor vehicle fuel. This could result in NG fueling stations being unavailable in certain areas where pipeline gas does not meet motor vehicle fuel specifications. This could impede the increased use of NG as a motor vehicle fuel.
Finally, as noted above, the fuel tank, whether for CNG or LNG, accounts for most of the cost increment for NG vehicles over equivalent gasoline or diesel vehicles. In addition to cost, weight can be an issue. The cheapest solid steel (Type 1) cylinders weigh four to five times as much as gasoline or diesel tanks of the same capacity; advanced (Type 3) cylinders with thin metal liners wrapped with composite weigh about half as much as Type 1 tanks, although they cost more. Tanks with polymer liners weigh even less, but are even more expensive. Higher pressure tanks (up to 10,000 psi) could reduce fuel storage space, but at added cost and increased energy required to compress the gas.
While tank costs are likely to come down with increased and improved production, large cost reductions will depend on advanced technology. In the future, it may be possible to store CNG at higher density, even at 500 psi (within the 200-1,500 psi range for gas in NG transmission pipelines) in adsorbed NG (ANG) tanks using spongelike materials such as activated carbon. If successful, this technology could allow vehicles to be refueled from the NG network without extra gas compression, reducing cost and energy use and allowing the fuel tanks to be lighter (adapted from NRC, 2013). Also, at lower pressure, the shape of the tank can be adjusted as needed to fit the space available, thus minimizing the impact on cargo space (PNNL, 2010).
TABLE 5-4 Technologies for Improvements in Heavy-Duty Natural Gas Engine Brake Thermal Efficiencies and GHG Emissions for the Phase II Rule
| Base Engine | Aftertreatment |
| Improved air handling | Improved three-way catalyst |
|
High-efficiency turbo |
Better methane oxidation |
|
Low pressure loss EGR |
Increased oxygen storage |
|
Low restriction ports |
|
| Improved controls | |
| Higher energy ignition |
Advanced air/fuel ratio dithering strategies |
| Improved combustion | Adaptive algorithms |
|
New bowl geometry |
Advanced sensors |
| Lower swirl/higher squish | |
|
Crank case ventilation |
|
| Improved friction and parasitics |
SOURCE: Tim Frazier, Cummins Westport, “Cummins Westport natural gas-fueled engines,” Presentation to the committee on July 31, 2013.
CNG Infrastructure
NG is moved throughout the United States in an extensive network of pressurized pipelines. According to the American Gas Association (AGA, undated), there are 1.9 million miles of CNG distribution lines and an additional 300,000 miles of transmission lines. The transmission lines are for long-distance interstate transport and operate at high pressure, from 200 to 1,500 psi. The distribution and service lines to homes operate at low pressure, approximately 50 psi to less than 1 psi. CNG refueling stations for vehicles are connected to points in the distribution pipeline network. The gas industry spends over $6 billion per year on the transmission lines and $4 billion per year expanding the distribution system.
There are 632 public CNG vehicle refueling locations in the United States (AFDC, undated) and around 1,200 including stations for private fleets (Weeks, 2013). The number of fueling stations actually peaked in 1997 and then declined until 2008. The rate of growth of CNG stations has been about 11 percent per year for the last few years (Clay, 2013), probably driven more by increased use in trucks than in passenger vehicles. The infrastructure hurdle for freight-hauling heavy-duty NG vehicles appears more manageable than for passenger vehicles and for Class 2b vehicles because far fewer stations will be needed for servicing trucks.
There are two basic types of CNG fueling systems: fast-fill and time-fill, shown in Figure 5-6 (AFDC, undated). Both are capable of filling the on-vehicle tank to approximately 3,600 psi, but as the name implies, the fast-fill can refuel a passenger vehicle in a few minutes by supplying gas from high-pressure storage vessels that are maintained full by compressors. The time-fill system in essence refuels the vehicle over a long period (hours) by the CNG compressor’s relatively small direct output, with small storage tanks used only for buffering. The time-fill stations are generally less costly to set up and are likely to be most appropriate for fleets that can refill overnight. Some stations may have both systems.
CNG stations are estimated to cost $600,000 to $1 million, with time-fills in the lower part of the range and fast-fills in the upper (ANGA, undated). These costs will be a considerable hindrance to the growth of CNG as a passenger vehicle fuel. One study estimated that between 16,000 and 32,000 stations would be needed to support a thriving NG vehicle population, with a much smaller number of refueling sites needed for heavy trucks (ANGA, undated). Equipping another 9,000 public stations will cost in the range of $5.4 to $9 billion.
LNG Infrastructure
LNG use is growing in transportation, especially for Class 8 freight trucks operating over interstate routes. LNG is formed by cooling NG to −162°C (−260°F), increasing its volumetric energy density about 600-fold and allowing it to be stored at relatively low pressure in highly insulated containers. The on-vehicle storage volume and weight advantages compared to CNG are considerable, but diesel fuel still has about 1.7 times the volumetric energy density of LNG. As shown in Figure 5-3, the approximate range per 100 gallons in a long-haul truck is: 650 miles (diesel); 380 miles (LNG); and 170 miles (CNG). LNG fueling stations are similar in configuration and operation to gasoline and diesel fuel retail outlets. LNG is delivered to the fueling station in tanker trucks, stored there, and dispensed into vehicles with cryogenic LNG storage tanks (see Figure 5-7). Many LNG fueling sites supply CNG as well.
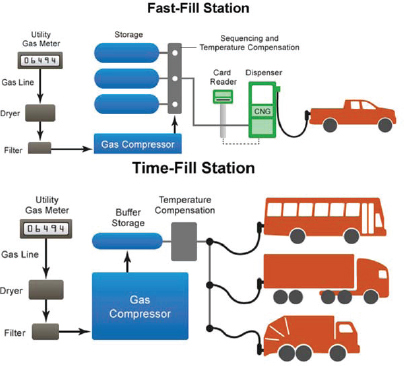
FIGURE 5-6 Conceptual diagram of compressed natural gas filling stations. SOURCE: http://www.afdc.energy.gov/fuels/natural_gas.html.
The main disadvantage of LNG is that it gradually boils off as ambient heat penetrates the tank no matter how well insulated it is. This may not matter much in long-distance
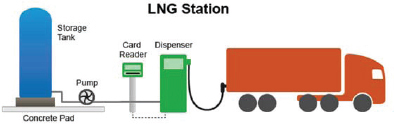
FIGURE 5-7 Conceptual diagram of LNG filling stations. SOURCE: http://www.afdc.energy.gov/fuels/natural_gas.html.
trucks that operate almost continually, but it probably precludes the use of LNG in light-duty vehicles.
Only about 40 nonprivate LNG fueling stations are in operation in the United States, many of them in California (AFDC, undated; TIAX, 2009). Clean Energy Fuels Corporation has been establishing a cross-country network of LNG fueling stations (“America’s Natural Gas Highway”), with near-term plans for 100 LNG stations. Shell is working with TravelCenters of America to offer LNG for highway trucks and has a joint cooperation agreement on LNG with Volvo. LNG is produced at only about 50 to 60 sites in the United States, and there are a few LNG import terminals, so transport distance to LNG dispensing stations could be a detriment. California boasts the world’s largest facility for producing LNG from landfill gas.
Conversion of NG to Other Fuels
NG can be converted to other fuels using well-known processes and technology. Each has advantages and disadvantages for storage, GHG impact, and cost:
- Dimethyl ether (DME)
- Methanol
- Ethanol
- Gas-to-liquids (GTL)
- Ammonia
- Electricity
- Hydrogen (for fuel cell vehicles)
DME-fueled truck development and demonstration is being carried out by Volvo with the fuel developer Oberon, which has a technology for converting NG or other feedstocks to DME via methanol as an intermediate. DME has storage characteristics similar to propane and much lower storage pressure and higher energy density than CNG. In a CI engine its performance is similar to that of diesel fuel.
Most methanol produced in the United States is derived from NG. In the mid-1980s, heavy-duty bus engines that ran on pure methanol or M85 (a mixture of 85 percent methanol and 15 per cent gasoline) were produced and emissions-certified, but subsequently CNG buses largely replaced them (Aldrich, 1995). Passenger vehicles were also produced and emissions certified to run on M85. A substantial infrastructure for dispensing M85 was established for fueling flex-fuel passenger vehicles, especially in California, but the program came to an end around 2005. Today in China, methanol is blended at low percentages in gasoline.
Although at present motor fuel ethanol comes from fermentation of biomass, it can also be produced from petroleum and NG. Recently several companies announced the development of new processes for the production of ethanol from NG. For example, Celanese, one of the world’s largest producers of acetic acid from fossil fuels, is building industrial-scale ethanol plants in China and Indonesia using coal as a feedstock. The company also has a demonstration-scale ethanol plant in Houston, Texas, that uses NG as a feedstock, although Celanese (2013) has noted obstacles to supplying its ethanol for either E85 or E10 in the U.S. market. Coskata, Inc., is also developing a process for producing ethanol from NG. The proprietary Coskata process begins with the reforming of methane to produce synthesis gas, followed by fermentation of the synthesis gas to produce ethanol. Both Celanese and Coskata8 estimate that they can produce ethanol at a substantial discount to gasoline or diesel fuel on an energy-equivalent basis
Converting NG to liquid hydrocarbons is a well-established technology relying largely on the Fischer-Tropsch process developed in the 1920s-1940s. Liquid fuels, especially diesel, from GTL technologies have been shown to be compatible with existing vehicles and can be combined with petroleum products, averting the need for a completely new dispensing infrastructure and a new vehicle technology to allow the widespread use of NG for transportation. GTL plants have been established worldwide where low-cost NG is available. To be profitable, the scale of GTL plants is enormous as is the capital investment, and the production of high-value chemicals in addition to fuel is important. Shell and Sasol are the largest GTL producers. Operating since 2011, Shell’s Pearl GTL facility in Qatar is one of the largest such plants in the world (140,000 BPD products), nearly 10 times the size of the demonstration facility Shell built in Malaysia in the early 1990s. Products from the Pearl facility are shipped to the United States. Low-cost NG in the United States gives rise to consideration of domestic GTL production. Companies such as Compact GTL and Velocys are developing relatively small, modular GTL production technology to support operations of, say, less than 5,000 BPD. A 1,000 BPD commercial production compact GTL plant is being considered for construction in Pennsylvania, in the heart of one of the large shale gas plays.
NG is the source for 95 percent of hydrogen production in the United States, and fuel cells are candidates for certain heavy vehicles such as buses and drayage tractors. In California, fuel cell heavy vehicles are a key option where zero-emission vehicles are needed. There are 10 hydrogen refueling stations in the United States, most of them in California (AFDC, undated).
NG is a feedstock for anhydrous ammonia, a feasible engine fuel that can be stored as a liquid at pressures similar to propane. Although it has been demonstrated in both SI and CI combustion systems, its toxicity and acute incompatibility with the human body make its widespread use as a transportation fuel impractical.
About 30 percent of U.S. electricity comes from burning NG (EIA, 2013b), and this fraction is growing rapidly. Combined-cycle (gas turbine/steam turbine) technology can
______________
8 Coskata, Inc. “Natural Gas.” http://www.coskata.com/process/index.asp?source=984A0E13-B27D-4267-8411-AA86E0CAA39F.
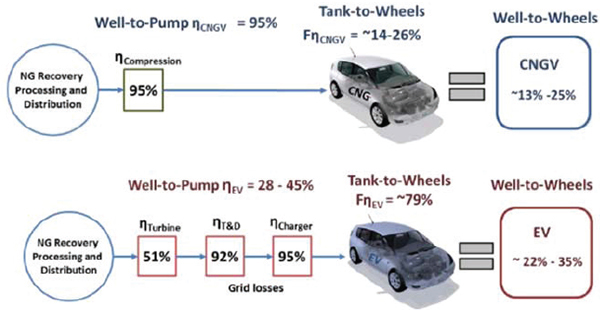
FIGURE 5-8 Comparison of efficiencies of compressed natural gas vehicles (CNGVs) and battery electric vehicles (BEVs). SOURCE: Curran, 2013.
be highly efficient. Some units are over 60 percent efficient, much higher than coal-fired generation. Electric vehicles (battery electric or plug-in hybrids) can take advantage of NG in this path, thereby displacing petroleum.
The conversion processes for all of the alternative fuel options described above emit GHGs. Therefore the processes that produce hydrocarbon fuels will result in higher total GHG emissions than NG-fueled engines, which are on par with or slightly better than comparable diesel-fueled engines. Only electricity and hydrogen from NG can produce lower GHG emissions than direct combustion of NG in engines due to the inherently high efficiency of battery electric and fuel cell vehicles.
Figure 5-8 compares the efficiencies from well to wheels of CNGVs and electric vehicles (the figure was developed for automobiles, but the well-to-pump numbers would be the same for trucks). While today’s CNGVs might attain a total well-to-wheels efficiency of 25 percent, the battery electric vehicle could attain 35 percent, which would result in about one-third less GHG emissions.9
This figure assumes efficient (51 percent) gas-to-electric conversion typical of a combined-cycle plant. If heavy-duty vehicles or hybrid passenger vehicles with their relatively high efficiency were to be substituted for the automobile shown, the combustion path would be close to the electric path.
EXPECTED GROWTH IN NATURAL GAS VEHICLE POPULATION
Several forecasts have been made for the growth in medium- and heavy-duty vehicles using NG. Figure 5-9 compares several forecasts of NG penetration in Class 8 trucks in the near term. Key factors influencing the decision to purchase a NG vehicle are the fuel cost savings, initial cost premium for the vehicle, and ready access to refueling facilities.
The National Petroleum Council (NPC) study produced a longer-term projection to 2050 (Figure 5-10), which estimated that about 40 percent of Class 7 and Class 8 vehicles would be fueled by NG by 2050.
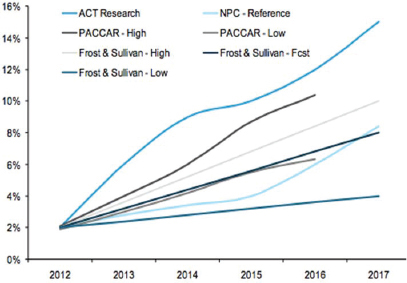
FIGURE 5-9 Near-term Class 8 natural gas penetration forecasts. SOURCE: Citi GPS (Global Perspectives & Solutions), 2013, Energy 2020: Trucks Trains & Automobiles. New York: Citigroup. June.
______________
9 Note that these are not full well-to-wheel estimates since they include neither leakage at the well nor tailpipe emissions from the CNGV.
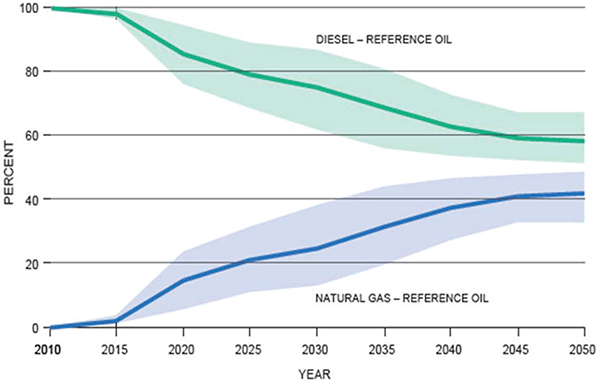
FIGURE 5-10 Shares of vehicles fueled by natural gas and by diesel to 2050. SOURCE: National Petroleum Council, 2012, Advancing Technology for America’s Transportation Future, Part One—Integrated Analyses, pp. 3-17.
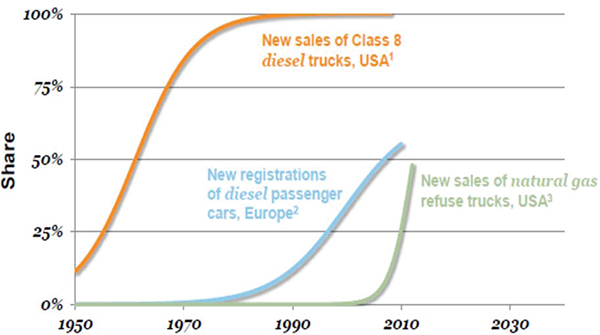
FIGURE 5-11 Historic rates of penetration for NG refuse trucks in the United States and diesel passenger cars in Europe. SOURCE: Data from (1) MacKay & Co. and Ward’s Automotive Group, a division of Penton Media, Inc., (2) European Automotive Manufacturers’ Association (ACEA), and (3) and (4) Westport.
The growth of refuse trucks fueled by NG is dramatic, as shown in Figure 5-11. Currently about half of new refuse trucks are NG-fueled, and that is expected to rise to 90 percent soon, in part because of local, state, and national incentives. However, refuse trucks collectively are not large consumers of fuel, so the greater opportunity for NG substitution is in Class 7 and Class 8 tractor-trailer rigs, which use about 20 times as much.
REGULATORY FRAMEWORK FOR NATURAL GAS ENGINES AND TRUCKS
New NG-fueled medium and heavy truck engines have been certified by their manufacturers to meet Environmental Protection Agency (EPA) criteria emission requirements and standards (NOx, particulate matter [PM], etc.) for many years. The criteria emission tests and procedures for NG engines are the same as those used to certify gasoline- and diesel-fueled heavy engines. Most engines are certified using a transient engine test, referred to as the heavy-duty Federal Test Procedure (FTP), which is supplemented by additional tests (steady-state and not-to-exceed tests) that cover more engine operating conditions. Medium- and heavy-duty vehicle engines fueled by diesel fuel or NG are certified to a NOx standard of 0.20 g/bhp-h. Certification data show similar NOx emission levels for NG and diesel fuel. Evaporative testing is not required of NG vehicles. Some large diesel pickup trucks and vans are chassis-certified based on the vehicle test used to certify cars and light trucks. EPA specifies the properties of NG for the purpose of certification emission testing. It also allows use of alternative test fuel specifications if they represent fuel the engine would use in normal use, such as pipeline NG.
Greenhouse Gas Emission and Fuel Economy Standards for Engines
In August 2011 the federal government adopted CO2 and fuel economy standards for new medium- and heavy-duty trucks and engines. The CO2 emission standards for new engines vary by engine type and duty cycle. If the engine is gasoline fueled or uses a spark plug and operates like a theoretical Otto combustion cycle, it is considered a SI engine. A CI engine is defined as an engine that is not a SI engine.
The CO2 emission standard for a new SI engine is 627 g/bhp-hr, beginning with model year (MY) 2016. For CI engines, the CO2 standard depends on the engine class (light-, medium-, or heavy-duty) and on what type of vehicle the engine is used in (tractor or vocational), and it begins with 2014 models. The CO2 emission standards for CI engines are shown in Table 5-5. The 2017 standards represent a 9 to 23 percent reduction in CO2 compared to a 2010 baseline.
Small businesses (fewer than 1,000 employees for truck manufacturers and 750 employees for engine manufacturers) are exempt from the GHG and fuel consumption standards, although NHTSA and EPA state they plan on reexamining this in the next rulemaking.
TABLE 5-5 Engine Emission Standards for New CI Engines (grams per brake horsepower-hour)
| Engine CO2 Emission Standard | ||||
| Vehicle Type | HD Engine Class | 2014 | 2017 | |
| Tractor, | Medium | 502 | 487 | |
| Classes 7 and 8 | Heavy | 475 | 460 | |
| Vocational | Light | 600 | 576 | |
| Medium | 600 | 576 | ||
| Heavy | 567 | 555 | ||
Methane and nitrous oxide engine emission standards of 0.10 g/bhp-hr each also apply to all engines regardless of fuel. Through 2016 models, CO2 emission credits can offset methane (and nitrous oxide) emissions to provide more flexibility in meeting these additional standards, and the flexibility may help NG engines with high methane emissions comply.
The test cycle for measuring CO2 emissions from engines used in Class 7 and Class 8 tractors is the supplemental emission test (SET). For engines used in vocational vehicles, the test cycle is the heavy-duty transient engine test procedure.
Fuel economy standards for new engines have been adopted by NHTSA. Compliance with the fuel economy standard is determined from the CO2 emissions measured by the appropriate emission test. Thus an engine that meets the CO2 standard also meets the fuel economy standard, and vice versa. The fuel economy standard for diesel engines does not begin until MY2017. SI engine fuel economy standards begin in 2016.
NG engines have to meet the same emission standards as gasoline- or diesel-fueled engines. NG engines are classified for criteria emissions based on the combustion cycle of the engine the NG engine is derived from. All larger NG engines (over 7 L) are currently derived from diesel CI engines even if they are converted to SI, and they are treated by EPA as diesel engines for criteria emission certification. EPA also requires consistent categorization for both criteria and CO2 emission compliance. Thus, under current EPA requirements, larger heavy-duty NG engines, even if spark-ignited, will have to comply with the CI CO2 standards shown in Table 5-5 beginning with the 2014 models. NG engines derived from gasoline engines are subject to the numerically higher SI CO2 standard beginning with the 2016 models.
Dual-fuel engines and vehicles (such as NG and diesel) must be tested for CO2 emissions on each fuel. Through 2015 the test results may be averaged; after 2015, the manufacturer must supply data on actual fuel use of each fuel for the type of vehicle, and the test results are weighted appropriately. The combined test results must comply with the standards. Criteria emission standards must be met on both fuels. However, separate evaporative testing of the CNG system is not required.
The CO2 and fuel economy regulations change the engine classification definitions in a manner that may one day affect NG engines. A literal reading of the new definitions suggests that a SI engine derived from a diesel engine would be classified as a SI engine and would have to meet the SI engine CO2 standard, which is less stringent than the diesel engine CO2 standard it must meet in 2014. EPA has indicated that it may address this in a future rulemaking, but for now an engine manufacturer may choose to be classified based on either the new or the old definition.
Emission and Fuel Economy Standards for Complete Trucks
EPA and NHTSA have also adopted GHG and fuel economy standards for trucks, with compliance units of grams/ton-mile and gallons/1,000 ton-miles, respectively. The standards vary by truck type (tractor or vocational), vehicle class, and roof height of the tractors. These vehicle standards include no provision unique to NG engines. The vehicle CO2 standards start in 2014, fuel economy standards start in 2016, and both become more stringent and aligned in 2017. Fuel economy and CO2 fleet average standards were also adopted for large pickups and vans, which are chassis-certified. They are patterned after the adopted car and light truck CO2 standards, and their numerical values vary by vehicle attributes such as size.
Heavy-duty NG engines are not expected to require significant design changes to meet the current GHG and fuel economy standards. CO2 emissions from NG engines are typically 5 to 20 percent lower than those from comparable gasoline or diesel engines, and this is about the same reduction required by the current standards. The flexibility of using CO2 reduction to offset methane emissions that are higher than the standard, as discussed in the section on GHG emissions and fuel economy standards for engines, suggests the methane standard will not be a barrier to compliance for NG engines. While NG leakage from a vehicle fuel system is technically possible, manufacturers and operators have great incentive to prevent this because it would represent a significant safety concern as well as a reduction in range.
Fuel consumption certification at the vehicle level for the new EPA-NHTSA standards is accomplished by use of the Greenhouse gas Emissions Model (GEM), a vehicle simulation tool with standard engine maps10 as described in Chapter 3 of this report. At present, there is no engine map in GEM for NG engines, so NG-powered vehicles are included in an alternative certification process under the Advanced Technology and Innovative Technologies categories in the rule. Since NG-powered vehicles are expected to become significantly more prevalent in the coming years, future regulatory changes should consider modifying GEM to incorporate them. Using the procedures for Advanced Technology credits may be replaced by providing a standardized NG engine model (SI, stoichiometric, turbocharged) in addition to a diesel engine model. Otherwise, it could be multiplied by a factor relating it to a diesel engine. Although some NG engine technologies other than SI may be employed and may offer higher efficiency, the SI model should serve as a baseline owing to its current and likely future market penetration.
Several Class 2b pickup and van producers have questioned the ability of gasoline engines to comply with the stringent new rules. Should these gasoline engines be
______________
10 Engine maps are tables of engine input and output values determined from calibration tests. They represent how an engine will operate under specific conditions.
dropped from production (and probably replaced with diesel engines), the availability of Class 2b NG vehicles would be impacted because the NG engines with displacements of less than 7 L are generally derived from gasoline engines. EPA remains confident that technologies developed primarily for light-duty engines will allow gasoline engines to remain viable in this class. This issue should be monitored to determine if the availability of NG engines derived from gasoline engines will be impacted, and if this has an effect on achieving the maximum feasible reduction in fuel use and GHG emissions.
In summary, the current regulations accommodate NG engines and provide a pathway to their certification. Certifying the fuel economy of dedicated NG vehicles would be more straightforward if NG engine maps were added to the GEM vehicle simulation.
Finding: Most evidence points to a long-term price advantage and abundant supply for NG. Market risks include findings on leakage and environmental issues with fracking.
Finding: NG is a low-carbon fuel with a GHG advantage over diesel and gasoline that varies in magnitude with engine technology and duty cycles. Being a large domestic resource, NG use contributes to national energy security. The use of NG contributes to the NHTSA energy mission and EPA’s goal of reducing climate impacts, unless additional findings of methane leakage alter this vision.
Finding: NG is also an economical fuel for many applications in medium- and heavy-duty vehicles. By 2025, 20 percent of new trucks sold could be fueled by NG, a very fast penetration rate from the current level. However, the regulatory approach and standards themselves are in flux, which could potentially disrupt normal market dynamics.
Recommendation 5.1: More studies and data are needed to determine the well-to-tank GHG emissions of NG vehicles, since current estimates vary significantly regarding quantification of emissions leakage of methane. EPA and NHTSA should assemble a best estimate of well-to-tank GHG emissions to be used as a context for developing future rulemakings.
Finding: With regard to the option of NG as a broad strategy for GHG reduction, NG engines are well-developed and can be readily employed in medium- and heavy-duty vehicles, especially with introduction of a 12 L engine for Class 8 trucks. There are areas of technology improvement for engine efficiency and maintenance cost reduction. On-vehicle storage of NG has high initial cost, economically restricting NG usage to applications with high fuel consumption.
The load-specific CO2 emissions from NG engines are generally 5-20 percent less than those from comparable diesel engines. NG’s inherent GHG benefit by virtue of its low carbon content (~28 percent) is partially negated by lower efficiency in currently available engines and the higher GHG impact of methane emissions. If the regulations require the same CO2 levels for trucks using either diesel or NG, then it is conceivable a NG truck could meet the standards with fewer advanced fuel economy technologies than a diesel counterpart. In contrast, a NG leakage correction to GHG impact could negate the inherent tailpipe CO2 advantage.
Recommendation 5.2: NHTSA and EPA should develop a separate standard for NG vehicles as is presently the case for diesel- and gasoline-fueled vehicles. Factors the Agencies should consider in setting the standard include the maximum feasible ability of NG engines to achieve reductions in GHG emissions and fuel consumption, the uncertainties involved with the various alternatives, the impact of duty cycles on the ability to comply with the vehicle standards, the cost of the technology, and rapid growth of the market for NG engines and vehicles. This may require additional focused studies.
Recommendation 5.3: Owing to the economics-driven rapid adoption of NG, it is urgent to develop an optimum solution in Phase II Rule standards for both GHG emissions and fuel consumption (as well as criteria emissions)—that is, a standard that will accommodate this fuel without artificially disrupting prevailing commercial transportation business models. Such standards need to be expedited to provide certainty to consumers and product developers alike, even as current business activities accelerate. As a specific example, the GEM certification tools need to include NG engine maps to more accurately quantify the emissions and fuel economy of NG vehicles.
Recommendation 5.4: To benefit fully from the GHG and petroleum displacement potential of NG, government and the private sector should support further technical improvements in engine efficiency and operating costs, reduction of storage costs, and emission controls (as is done for diesel engines). NHTSA and EPA should also evaluate the need for and benefits and costs of an in-use NG fuel specification for motor vehicle use.
Finding: The NG vehicle refueling infrastructure is growing, but the number of retail outlets for fueling medium- and heavy-duty vehicles is still well short of what is needed.
AGA (American Gas Association). Undated. Available at http://www.aga.org/Kc/aboutnaturalgas/consumerinfo/Pages/NGDeliverySystemFacts.aspx. Accessed February 2014.
AFDC (Alternative Fuels Data Center), Department of Energy. Undated. Available at http://www.afdc.energy.gov/fuels/natural_gas.html. Accessed December 2013.
ANGA (American Natural Gas Association). U.S. and Canadian Natural Gas Vehicle Market Analysis. Undated, prepared by TIAX. Available at http://anga.us/media/content/F7D3861D-9ADE-7964-0C27B6F29D0A662B/files/Comparative%20and%20Scenario%20Analysis1.pdf.
ANGA. Gas Vehicle Market Analysis-LNG Infrastructure: Final Report. Undated, prepared by TIAX. Available at http://anga.us/media/content/F7D3861D-9ADE-7964-0C27B6F29D0A662B/files/LNG%20Infrastructure.pdf.
Aldrich, B. 1995. ABC’s of Afv’s: A Guide to Alternative Fuel Vehicles. Darby, Pa.: Diane Publishing Company.
Allen, D.T., V.M. Torres, et al. 2013. Measurements of methane emissions at natural gas production sites in the United States. PNAS, October 2013. Available at http://www.pnas.org/content/110/44/17768.abstract.
Celanese. 2013. Global Advocacy. Available at http://www.celanesetcx.com/en/global-advocacy. Accessed November 30, 2013.
Clay, Kathryn. 2013. “The Drive Natural Gas Initiative.” Oral presentation at the SAE International Natural Gas Symposium. Greenville, S.C., March 12.
Curran, S., et al. 2013. Well-to-Wheels Analysis of Direct and Indirect Use of Natural Gas in Passenger Vehicles. Presented at SAE 2013 Fuels, Lubricants, and Aftertreatment Symposium: Achieving Fuel Economy and GHG Targets, November 18-21, 2013. (Article in press in Energy)
Energy Information Administration (EIA). 2013a. Annual Energy Outlook 2014: Early Release. Available at http://www.eia.gov/forecasts/aeo/er/index.cfm. Washington, D.C.: Department of Energy.
EIA. 2013b. Frequently Asked Questions.. Available at http://www.eia.gov/tools/faqs/faq.cfm?id=427&t=3. Accessed November 2013.
EIA. 2013c. Annual Energy Outlook 2013. Washington, D.C.: Department of Energy.
Engine Manufacturers Association (EMA). 2010. Letter to California Air Resources Board regarding ARB CNG Specification Revisions, June 3.
Greszler, A. 2011. Opportunities for Heavy Vehicle Efficiency Improvements. 2011 Biennial Conference: Rethinking Energy and Climate Strategies for Transportation. Asilomar, Calif. August 31.
Howarth, R.W., R. Santoro, and A. Ingraffea. 2011. Methane and greenhouse-gas footprint of natural gas from shale formations. Climatic Change, doi:10.1007/s10584-011-0061-5.
Kamel et al. 2002. An emission and performance comparison of the natural gas: Cummins Westport Inc. C-Gas Plus versus diesel in heavy-duty trucks. SAE 2002-01-2737.
Kauling, Dick. 2013. “US Light Duty Natural Gas Vehicles—Role of Customer Requirements and Standards in Technology Development.” SAE Natural Gas Symposium. Greenville, S.C. March 13.
Krupnick, A.J. 2010. “Energy, Greenhouse Gas and Economic Implications of Natural Gas Trucks.” Backgrounder, Resources for the Future. June.
NACFE (North American Council for Freight Efficiency and Cascade Sierra Solutions). 2013. Barriers to the Increased Adoption of Fuel Efficiency Technologies in the North American On-Road Freight Sector. July.
National Petroleum Council. 2012. Advancing Technology for America’s Transportation Future. Washington, D.C. Available at: http://www.npc.org/.
National Research Council (NRC). 2010. Technologies and Approaches to Reducing the Fuel Consumption of Medium- and Heavy-Duty Vehicles. Washington, D.C.: The National Academies Press.
NRC. 2013. Transitions to Alternative Vehicles and Fuels. Washington, D.C.: The National Academies Press.
Pacific Northwest National Laboratory (PNNL). 2010. Issues Affecting Adoption of Natural Gas Fuel in Light- and Heavy-Duty Vehicles. PNNL-19745. Richland, Wash.: PNNL. September.
TIAX. 2009. Assessment of Fuel Economy Technologies for Medium- and Heavy-Duty Vehicles. Report prepared for the National Academy of Sciences by TIAX LLC. Cupertino, Calif. July 31.
University of Michigan Transportation Research Institute (UMTRI). 2013. Trucks Involved in Fatal Accidents, 2006-2010.
Weeks, B. 2013. Technology Trends. Oral presentation at the SAE International Natural Gas Symposium, Greenville, S.C. March 12.


