
6
Review of Options to Reduce Energy Use of Trailers
This chapter addresses the opportunities to reduce the energy consumed by Class 8 tractors pulling, particularly, van trailers. Following some background information, three government programs that deal with tractor-trailer fuel consumption are summarized. Next, the technologies associated with tractor and trailer aerodynamics as well as tires for both components are discussed. The contribution to life-cycle costs of tire pressure monitoring (and maintenance) systems (TPMS) and greenhouse gas (GHG) emissions will also be considered. Finally, the findings and appropriate recommendations are presented.
Because the tractor and trailer act as a system, with each part affecting the energy use of the other, options to reduce energy use of the tractor are also briefly discussed. While tractors are built for the weight Classes of 8, 7, and 6, the most populous and versatile and the default industry workhorses are Class 8 tractors. Reduced tare weight is noted as a contributor to reduced energy consumption (or, alternatively, to marginally increased payload) and is not discussed further.
A fully loaded Class 8 tractor-trailer combination operating on the interstate at a constant 65 mph typically demands over 200 hp from the engine. This power demand is principally to drive the wheels at freeway speeds to overcome aerodynamic drag and tire rolling resistance. The remaining power demand, in the absence of grade or headwinds, is to overcome drivetrain friction and to power auxiliary devices. Table 6-1 details these demands.
Class 8 tractor-trailers account for 60 percent of the fuel used by all on-road heavy-duty trucks (ICCT, 2013). The disproportionate fuel use notwithstanding, Class 8 tractor-trailers are relatively small in number because of the just-mentioned high power demands at freeway speeds (65 mph) and the high annual mileages accumulated by these vehicles (a median of about 100,000). By comparison, Class 3 to Class 6 fully loaded delivery trucks require less than a third of the power to operate at a constant urban speed of 40 mph, and they each accumulate fewer miles per year (a median of about 40,000) (NRC, 2010, Tables 2-1 and 5-2). Therefore, straight trucks with these predominately urban duty cycles will not be further considered in this chapter.
In addition to trailers towed by tractors, some trailers are also transported by rail. “Intermodal transport” refers to the movement of goods by more than one mode on a single journey (Corbett and Winebrake, 2007; Winebrake et al., 2008). Commonly, intermodal transport combines a truck mode with either ship or rail to improve shipping efficiency, reduce costs, or achieve some other desirable performance attribute. Because rail and ship are significantly less energy-intensive than truck, incentivizing the movement of goods from truck to rail or ship is one way to improve the overall efficiency of the freight transportation system (NRC, 2010, p. 175).
Containers are transported at each end of their route by truck tractors. These final segments are typically much shorter than the total journey of the container. The container is on- and off-loaded to a chassis, which completes the trailer configuration (sometimes standard van trailers are also rail transported). When the notion of adding trailer aerodynamic devices is considered later in this chapter, the potential interference of those devices with container handling must be considered.
TABLE 6-1 Operational Power Demands from Class 8 Tractor with Sleeper Cab-Van Trailer at 65 mph on a Level Road and Having a Gross Vehicle Weight (GVW) of 80,000 lb
| Operating Load | Power Consumed (hp) | Power Consumed (%) |
| Aerodynamic | 114 | 53 |
| Rolling resistance | 68 | 32 |
| Auxiliaries | 20 | 9 |
| Drivetrain | 12 | 6 |
| Total | 214 | 100 |
SOURCE: NRC, 2010, Table 5-4.
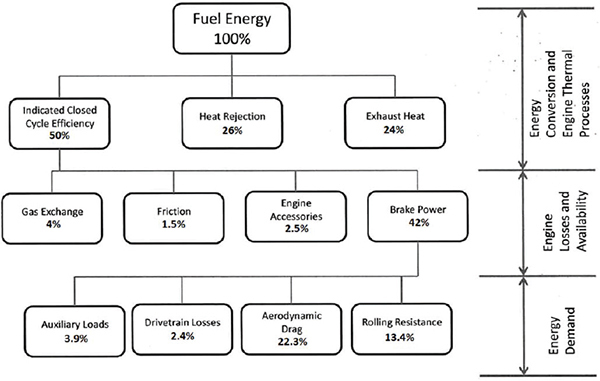
FIGURE 6-1 Energy balance of a fully loaded Class 8 tractor-trailer on a level road at 65 mph. SOURCE: NRC (2010), Figure 5-1.
Current Tractor-Trailer Energy Balance
Efficiency of Class 8 tractor-trailers can also be improved by reducing energy losses in the engine processes. As shown in Figure 6-1, half the fuel energy available to the engine is typically lost to heat. Another 8 percent of the fuel energy is lost to overcoming pressure differentials and friction and to power accessories. The remaining energy available, 42 percent, is the operational power demand from the engine and drivetrain, as summarized in Table 6-1.
Note that not all Class 8 combination trucks operate primarily at high interstate speeds, nor do they all carry high gross weights. Indeed, many operate in shorter regional haul or mixed highway and suburban duties and often carry partial loads. Still others may operate substantially in suburban and urban areas, often with frequent stops. Often these shorter haul duties utilize day cab tractors, typically returning to central dispatch for overnight domicile. These descriptions serve to clarify that there is a continuum of duties in the tractor-trailer universe, and the benefit of technologies that reduce fuel use will vary widely depending on speed, the load being carried, and the mileage accumulated.
Aerodynamics and Tire Rolling Resistance of the Tractor-Trailer
The power required to propel a vehicle at any moment in time is customarily presented as a “road load equation.” This power equation has four terms to describe tire rolling resistance, aerodynamic drag, acceleration, and grade effects:
PRL = mgCrrV cos(θ) + 0.5CdAρaV3 + mV(dV/dt) + mg sin(θ)V
where PRL is road load power, mg is vehicle weight, Crr is tire rolling resistance, Cd is a drag coefficient based on the entire vehicle, A is the frontal area, ρa is the air density, V is the vehicle velocity, m is vehicle mass, t is time, and θ is the road gradient (uphill positive). Neither Cd nor Crr need be constant with respect to speed and are not treated as constant in the better simulations. The term CdA should not be separated as it arguably represents a fundamental characteristic of the vehicle for which it has been determined.
The power required to overcome aerodynamic drag is proportional to the cube of forward velocity. This illustrates the important influence of vehicle speed on horsepower demand and the fuel consumption needed to overcome aerodynamic drag. The power required to overcome tire rolling resistance
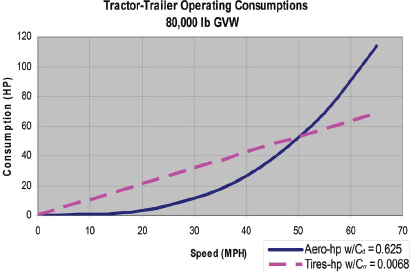
FIGURE 6-2 Aerodynamics and tire power consumption for a late-model tractor-trailer combination with GVW of 80,000 lb. SOURCE: NRC, 2012, Figure 5-1.
is proportional to the forward velocity. These relationships are shown in Figure 6-2.
Notice that these two power demands are equal at about 50 mph, while rolling resistance power consumption at 36 mph is about twice that required to overcome aerodynamic drag. This comparison is for a fully loaded circa MY2007 tractor1 and a trailer that does not incorporate aerodynamic devices. An empty or partially loaded trailer would have less rolling resistance because the rolling resistance force is also proportional to the weight on the tires.
Aerodynamics of the Combined Tractor-Trailer
There are four regions of the tractor-van trailer combination truck that are amenable to aerodynamic design improvements. These regions include the various tractor details, the tractor-trailer gap, the trailer underbody, and the trailer tail (NRC, 2010, p. 96). These are illustrated in Figure 6-3, along with the estimated fuel consumption reductions that might be realized for trailers with aerodynamic devices and present-generation sleeper tractors.
The heavy truck industry began purposeful tractor aerodynamic improvements through hood and fender styling changes, plus aerodynamic bumpers and fuel tank fairings and by moving the externally mounted air cleaner canister under the hood. These changes were led by the introduction of Kenworth’s T600 tractor model in 1985. That game-changing introduction spurred the entire industry to accelerate aerodynamic tractor styling, as customers began to measure fuel consumption reduction effects.
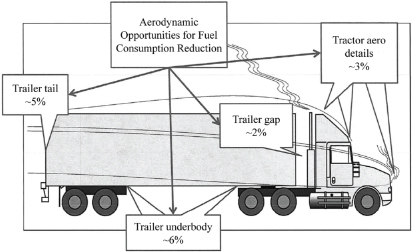
FIGURE 6-3 Tractor-trailer combination truck illustrating regions of potential fuel consumption reduction; combined Cd base of 0.625. SOURCE: NRC, 2010, Figure 5-8.
The current aerodynamic features for tractors are identified in Figure 6-4 and can be seen in the photos in Figure 6-5, which illustrates the most significant aerodynamic differences and similarities between aerodynamic and nonaerodynamic tractors. Panel (a) shows a MY2013 aerodynamic high-roof sleeper cab tractor, equipped with aerodynamic hood, fenders, bumper and mirrors, side fairings, and an integrated roof fairing with cab extenders that help reduce the turbulent area between the cab and the front of the trailer. Panel (b) depicts a day cab tractor equipped with only a simple roof air deflector and no side fairings, yet common cab, hood, fenders, bumper, and mirrors. As the truck industry rarely reports Cd values, such figures are not available for the tractors shown. Indeed, tractor-only Cd values are of limited value, since the combined drag of the tractor and trailer is most significant to the truck’s fuel consumption.
Tractor manufacturers introduce design modifications periodically, and their advertisements often claim aero-related performance improvements (including for engine performance). Indeed, these often are declared by the manufacturers to be major, competitive, purchase-worthy steps forward. It is anticipated that the Department of Energy (DOE) SuperTruck projects2 will generate significant aero-
______________
1 Model years vary significantly among medium- and heavy-duty vehicle (MHDV) manufacturers, so for the sake of simplicity and uniformity, the calendar year is often used as the rough approximation for model year.
2 SuperTruck is a major initiative of DOE’s 21st Century Truck Partnership and is supported by three other federal agencies in cooperation with fifteen industrial partners. The latter include all six U.S. heavy-duty truck manufacturers and many heavy-duty engine and powertrain system manufacturers in order to accelerate technology development and provide focus for R&D efforts. The four industry-led projects, spanning 2010 through 2016, were established to fund R&D and demonstration of full vehicle systems integrating a number of technologies into Class 8 heavy-duty, long-haul trucks. There are three major goals: (1) demonstrate a 50% increase in freight efficiency (measured in ton-miles per gallon) on a defined drive cycle with a 20% engine contribution; (2) demonstrate engine
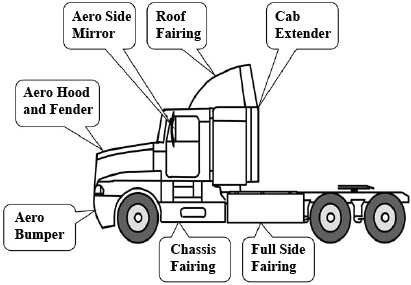
FIGURE 6-4 Sleeper tractor with aerodynamic features identified. SOURCE: NRC, 2010, Figure 5-5.
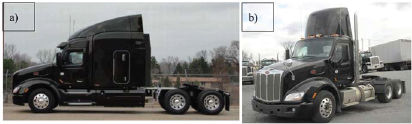
FIGURE 6-5 (a) Peterbilt aerodynamic High Sleeper Cab and (b) Day Cab model 579 tractors. Courtesy Peterbilt Motors Corp., 2013.
dynamic innovations when they conclude between 2014 and 2016. The Phase I Rule also provides a strong incentive to tractor manufacturers to continuously reduce fuel consumption.
Improvements to the aerodynamics of van trailers are influenced by customer demand for reduced fuel consumption, the Environmental Protection Agency’s (EPA’s) SmartWay voluntary program, and GHG regulations of the California Air Resources Board (CARB) (discussed in a later section). The current federal Phase I Regulations on fuel economy and GHGs apply only to engines and tractors and do not require trailer manufacturers to reduce the impact of their trailers on tractor fuel consumption.
The most common improvement to trailers is the addition of side skirts to improve underbody aerodynamics (see discussion in the section “Current Use of Aerodynamic Devices and Low Rolling Resistance Tires”). These may be added to new trailers or retrofitted to existing trailers. The CARB regulation includes a GHG reduction requirement that is most easily met with skirt retrofits, and this has created a burgeoning aftermarket for them. Other types of devices such as nose cones and rear fairings are used on a small fraction of trailers. EPA testing shows that most side skirts provide a 5 percent fuel saving at 65 mph (3 percent at 55 mph), as do most rear tail fairings (see Table 6-2). Other devices such as trailer front gap devices (see Figure 6-6), wheel covers and fairings, and vortex generators and flow tabs have been developed. Overall, the use of trailer aerodynamic devices has grown significantly in the past few years. See the SmartWay discussion below that references devices verified or qualified in that program.
The airstream leaving the tractor cab encounters the gap between tractor and trailer.3 The gap is highly turbulent with air motion out of control and pressure further reduced. Yet behind an aerodynamic tractor, many measurements have identified this region as providing only a 0.5 to 3.5 percent opportunity for drag reduction (TIAX, 2009). An average performance of 1.3 percent was achieved with partial gap closures and 2.2 percent with full gap closures. Because the CARB regulation requires any trailer aero-performance improvement to reduce fuel consumption by at least 5 percent, which can be achieved by using skirts under the van trailer body, the typical partial gap closure devices on offer are utilized only infrequently.4
Nearly all heavy-truck tire manufacturers produce low-rolling-resistance (LRR) tires for all wheel positions on tractor trailers, and many of these have been performance verified by SmartWay. SmartWay requires meeting specific rolling resistance targets based on test data in order to be verified. Achieving the target values results in a 15 percent reduction in rolling resistance, measured against a 2010 baseline tire. Best-in-class tires provide a 30 percent reduction in rolling resistance, indicating that still greater reductions in rolling resistance beyond the SmartWay targets are possible (76 Fed. Reg. 57207). Improvements in rolling resistance have been achieved with new tread compounds, stabiliza-
______________
50% brake thermal efficiency (BTE) at a level road load of 65,000 lb, 65 mph; and (3) conduct technology development and scoping for a path to 55% BTE. SOURCE: Ken Howden, DOE, “21st Century Truck Partnership and SuperTruck Initiative,” Presentation to the committee, March 29, 2013.
3 Freight Wing, Inc. “OnAerodynamics: The Effect ofAerodynamics on Tractor Trailers.” Available at http://www.freightwing.com/on-aerodynamics.php. Accessed December 18, 2013.
4 Sean Graham, Freight Wing Incorporated, personal communication with Chuck Salter, committee member, August 26, 2013.
TABLE 6-2 SmartWay-Verified Devices for Heavy-Duty Tractor/Trailers
| Device | Fuel Economy (mpg) increase (%) | Number verified |
| Advanced trailer side skirts | ≥5 | 37 |
| Trailer side skirts | ≥4 | 16 |
| Advanced trailer end | ≥5 | |
| fairings | 9 | |
| Trailer boat tails | ≥1 | 9 |
| Trailer gap reducers | ≥1 | 4 |
| LRR tires (new) | ≥3 | 41 brands |
| LRR retreads | ≥3 | 7 brands |
| Certified tractors | Specifies design elements | 19 models |
| Certified 53+ foot trailers (new) | Specifies aerodynamic configurations | 8 manufacturers |
NOTE: mpg, miles per gallon.
SOURCE: www.epa.gov/smartway/forpartners/technology.htm. Accessed August 29, 2013.
tion of the tread block, and stiffer shoulders to reduce tread deformation. (Note that a 15 percent reduction in Crr for the entire truck translates into a reduction of about 3 percent in fuel consumption.)
Manufacturers have also introduced wide-base single tires (WBST), many of which feature lower rolling resistance than most dual tire sets and most often produce best in class Crr. The WBST must be mounted on a special wheel and axle end, which increases cost but has the additional benefit of reducing wheel weight and thus increasing payload capacity. Tread life and retreadability also play into a carrier’s analysis of how to achieve the lowest costs over a tire’s life cycle.
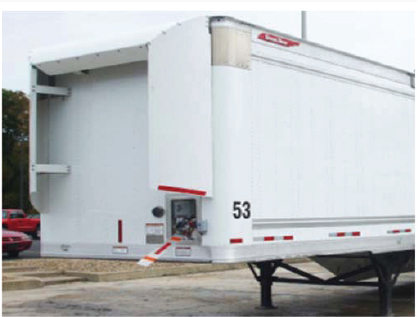
FIGURE 6-6 Trailer front gap fairing. SOURCE: Freight Wing. Available at http://www.freightwing.com/gap_fairing.php. Accessed November 14, 2013.
Following is a treatise on the factors influencing successful WBST use, offered by an experienced truck industry executive (though not a tire manufacturer):
These experiences are primarily those for over the road, tractor-trailer fleets. Wide Base Single Tires (WBST) make up less than 5% of the commercial truck tire market, but their use is increasing due to fleets’ desires to reduce fuel consumption and greenhouse gas emissions. Since 2000 when first introduced by Michelin, many fleets have tried and adopted them while others have tried and abandoned them for several reasons.
Satisfied fleets feel the savings in fuel (between 2 and 5%) greatly offsets any disadvantage in tread wear and tire life. These fleets often utilize automatic tire inflation systems to keep the tires running when trailers encounter road hazards that puncture the casing so that they can get home for repairs.
Fleets that abandoned them usually did so because they did not provide necessary maintenance and experienced high numbers of emergency breakdowns. Some fleets experienced extremely long breakdown periods (e.g., double the 2 hours for standard tires), often due to unavailability of wide base spare tires especially in certain areas of the country.
WBSTs are very sensitive to both under and over inflation. The Tire & Wheel (S.2) Study Group of the Technology & Maintenance Council found fleets experiencing both shoulders wearing away usually were over-inflating these tires. Accordingly several tire manufacturers now recommend 100 psi as the optimal pressure to avoid this condition. Tire pressure systems (TPS) are clearly a robust solution to maintaining proper tire pressure for WBSTs, as well as steer and dual tires. See Subsection 6.4.1 below for an extended discussion on the value of TPS. WBSTs are also more sensitive to free rolling wear which is aggravated by lightly loaded trailers. Negative camber in the axle can cause the shoulder to wear prematurely which can be a big issue for fleets hauling heavier loads.
Irregular wear negatively impacts tread mileage. In addition WBSTs usually come with slightly less tread depth than standard dual tires. Some fleets report getting 50-60% of the tread mileage they experience with duals. Yet other fleets achieve a tread mileage nearly equal to dual tires, through inflation maintenance and proper alignment. Improvements in compounding and tread design find WBST tread life now approaching the same rate as dual tires.
Early retreadability of WBSTs was unsuccessful due to their higher unit loads causing faster casing fatigue. Now, most fleets usually get 1 retread from a wide base casing. This is certainly a short fall for fleets that routinely get 2 retreads on standard dual tires. But again, the savings in fuel economy can make up for this short fall. Some of the problems attrib-
uted to the reduction in retreads fall on retreaders, some of which are still climbing their learning curve.5
Tire manufacturers have variously reported the following for WBST tread life:
- With wide-base Crr 15 percent below duals (the most popular wide base), it is 67 percent or more of tread life of dual tires.
- WBST tread life is nearly equal to the tread life of duals manufactured to the same Crr.
It is noted from the foregoing that while the use of WBST LRR tires results in better fuel economy, the shorter tread life of these tires may lead to an increase in the number of newly manufactured tires and retreads, thereby generating additional life-cycle GHG emissions. The balance between these contrary effects is not known.
GOVERNMENT PROGRAMS THAT INFLUENCE TRACTOR-TRAILER FUEL CONSUMPTION
SmartWay was formed in 2004 as a collaboration of the EPA and the goods movement industry. The objective of SmartWay is improving efficiency and reducing fuel consumption and pollution from the movement of freight across the supply chain. Currently its focus is on-road trucking, which carries the majority of the nation’s freight. The completely voluntary SmartWay Partnership grew more than 10-fold between 2006 and 2012 to 3,000 partners.6 Partners agree to provide data on their operations, which are input into standardized tools to produce a measurement of environmental efficiency, such as grams pollutant per ton-mile. These benchmark results are compared to similar categories of freight movement—for example, dry vans—and ranked in quintiles. Fleet operators and shippers use the results to improve their efficiency, identify green options, and achieve recognition.
SmartWay also includes a Technology Program that certifies the performance of technologies, equipment, and strategies that save fuel and reduce emissions. This process increases the certainty for potential users of equipment and strategies that fuel savings will occur and a reasonable return on investment can be achieved. The technology program verifies the fuel savings of new tractors, new trailers, aerodynamic devices retrofitted to trailers, and LRR tires. New tractors are verified by design category based on their use of an integrated high roof sleeper cab fairing, cab side extenders, fuel tank fairings, aerodynamic bumpers and mirrors, LRR tires, or a device that provides 8 hours of idle-free power and cabin conditioning. No testing is required.
New dry van (nonrefrigerated) trailers 53 feet or longer (“53+ ft”) may also be verified. Verification is based on use of a combination of SmartWay-certified devices and tires that reduce trailer drag and rolling resistance and provide at least a 6.5 percent reduction in fuel use relative to a baseline trailer. Typically this includes use of an advanced trailer skirt or, less frequently, an advanced trailer end fairing (“advanced” refers to a device verified to provide at least a 5 percent reduction in fuel use). Other combinations of verified devices are possible. Trailers must also use verified LRR tires. Aerodynamic devices designed to be retrofitted onto trailers must be tested to demonstrate their fuel reduction efficacy. The test involves comparing the fuel use of two identical trucks, one equipped with the drag reducing device(s) and driven on a dry, closed-loop test track in low wind conditions at no more than 65 mph and the other not so equipped. The procedure is specified as modified Society of Automotive Engineers (SAE) standard J1321. The results place the device into one of five verification categories: gap reducers, end fairings (1 percent or greater reduction in fuel use, each), side skirts (4 percent or greater), advanced skirts, or rear fairings (5 percent or greater, each). This test may also be used for other types of aerodynamic devices provided EPA establishes a new SmartWay verification category for the technology.7
To add some perspective to this test procedure’s maximum speed, it is instructive to review the Freight Performance Measure study by the Federal Highway Administration of the five busiest interstate highways, which together account for nearly 25 percent of interstate freight vehicle miles traveled. Average truck speed deficits from posted limits are attributable to numerous causes, infrastructure design and capacity being the most common cause, plus terrain, weather, accidents, work zones, and time of travel (including operational strategy). That analysis showed an annual average for the four highest speed highways (of the five) in the range of 54 to 58 mph, road by road. The worst interstate was I5 at 50 mph, surprising few. Implied is that certain of the remaining interstates may embody somewhat higher averages, to be determined by a second study.
This suggests that test procedures evaluating the fuel savings of aerodynamic devices should include the variety of speeds experienced on real roads (FHWA, 2006).
LRR tires may be verified using the SAE J1269 or ISO 28580 test procedures, which involve measuring the steady-state rotational force required to turn the tire against a drum
______________
5 Peggy J. Fisher, President, TireStamp, Inc., “Low Profile Metric Wide Base Radial Tire Issues,” personal communication to Chuck Salter, committee member, November 7, 2013.
6 Sam Waltzer and Cheryl Bynum, EPA, “US National Approach to Reducing Freight Emissions,” personal communication to Tom Cackette and Chuck Salter, committee members, July 24, 2013.
7 Detailed requirements for obtaining SmartWay verification for tractors and trailers may be found at http://epa.gov/smartway/technology/designated-tractors-trailers.htm. Accessed August 29, 2013.
under specified conditions. To be SmartWay verified, the tire’s rolling resistance coefficient must be less than EPA’s target values, which vary depending on where the tire is positioned on the tractor/trailer. In general, LRR tires reduce fuel use by about 3 percent, with roughly half the reduction coming from the trailer. In June 2012, EPA also issued an interim protocol and procedures for measuring rolling resistance of retread truck tires.8
SmartWay-Verified Technologies
Only three of the eight trailer manufacturers with SmartWay-verified 53+ ft trailers highlight the use of side skirts or the SmartWay program through use of pictures and/ or discussion on their websites. Two make no mention at all, and the rest offer skirts through an option list. Only one mentions the regulatory requirements of California. Most major commercial truck tire manufacturers discuss on their websites tire models that reduce fuel use and mention SmartWay-verified models in their tire selector or in brochures. Classes 7 and 8 tractor manufacturers all highlight aerodynamics and fuel efficiency of their trucks, but they continue to produce some Class 8 models that offer the “classic look,” which does not utilize hood shapes and fuel tank covers that reduce aerodynamic drag. These are typically designed to haul flatbed trailers and tankers; one manufacturer reports that the classic design accounts for less than 5 percent of new tractor sales.
SmartWay also verifies idling reduction devices (which may be exempt from federal excise tax) and retrofit devices aimed at reducing smog-forming criteria emissions.
Improvements to SmartWay
EPA is undertaking studies to correlate the on-road performance of devices with the results of manufacturer verification testing. For example, an EPA contractor is conducting on-road fuel consumption testing pursuant to SAE J1321 of verified tires and aerodynamic devices to establish correlations with laboratory and track verification test results. One objective is refining current procedures used for verification.
Such attention to test procedure improvement is necessary and timely. During the committee discussions and data collection with tractor, trailer, and aerodynamic device manufacturing personnel, inadequacy of the required J1321 procedure was frequently cited.9, 10 Significant issues include the following:
- Regulation demands more precision than a voluntary SmartWay program does. Fuel consumption reduction verification in the range 1 to 7 percent requires better than the ±1 percent reported in J1321.
- Supposedly identical tests run several months apart showed a 2 percentage point variation in fuel consumption reduction (first 4 percent then 6 percent).
- Results from an aero-device manufacturer’s test could not be replicated within 2 percentage points by a trailer manufacturer.
- Results between test facilities were sometimes not precise within 2 to 3 percentage points.
- A single trailer sometimes performed very differently when towed with different SmartWay-verified sleeper tractors.
Improvement of the precision of SAE J1321 aerodynamics test procedure appears particularly important. Dissemination of these results to fleets and operators will increase confidence in the efficacy of fuel-saving devices.
Scale-model wind tunnel testing for trailers is also being conducted to establish correlation to on-road performance. Scale-model wind tunnel testing could reduce the cost of verification for trailer aerodynamic devices. SAE has developed recommended practice SAE J1252 for this testing. A wind tunnel procedure is the only accurate method of determining wind-average drag, by accounting for the effects of side winds. A test procedure that has no systematic process to account for yaw calls into question the value of devices that perform at a higher level in the presence of yawing wind. It will be key for EPA to establish a good correlation between wind tunnel tests and its modified J1321 on-road tests to help reduce the costs of development and verification for aero devices. It is significant to note that at least three of DOE’s four SuperTruck project teams are utilizing either scale-model or full-size wind tunnels to provide quality analysis for the aero component of those projects.11
The EPA is also exploring the possibility of using computational fluid dynamics (CFD) to determine trailer aerodynamic drag for use in verification. CFD continues to be applied to full truck aero developments. Here again, three of four SuperTruck project teams report using these flow visualizing and quantifying tools to reduce analysis time and avoid prototype builds. EPA should consider processes to permit the results of these time- and cost-saving tools to satisfy performance verification requirements.
Lab testing of new and retread tires is being conducted to establish correlation to road testing and to potentially improve the current lab procedures. This may lead to
______________
8 Further information available at http:http://www.epa.gov/smartway/forpartners/technology.htm. Accessed February 13, 2014.
9 Jeff Bennett, Utility Trailer Manufacturing Company, personal communication to Chuck Salter, committee member, August 29, 2013.
10 Sean Graham, Freight Wing, Inc., personal communication to Chuck Salter, committee member, August 26, 2013.
11 U.S. Department of Energy Vehicle Technologies Office, Annual Merit Review and Peer Evaluation Meeting. May 13-17, 2013. Available at http://www.annualmeritreview.energy.gov/. Accessed November 5, 2013.
improvements to the test procedures for verifying the efficacy of SmartWay-verified devices, trailers, and tires.
Finally, EPA is testing SmartWay idle reduction systems in a full-scale environmental chamber to better understand the energy load demand on the truck cab and explore a performance-based protocol for aero devices.12
EPA is considering inclusion of refrigerated 53+ ft van trailers and twin trailers (twin 28 ft pups) in SmartWay. It is also evaluating adding an “Elite” category for SmartWay trailers that has a higher fuel savings target, such as 10 percent. This could be met by use of multiple aerodynamic devices such as advanced side skirts and an advanced rear fairing (each providing a 5 percent reduction).
California Air Resources Board Regulation
In December 2008, CARB adopted a regulation to reduce GHG emissions from heavy-duty trucks by requiring new and in-use tractors and trailers to utilize aerodynamic designs and devices and LRR tires when operating in California. The regulation specifies that equipment used to comply with CARB’s regulation must be verified through EPA’s SmartWay program. The regulation applies only to 53+ ft van-type trailers (dry and refrigerated) and the Class 7 or 8 sleeper cab tractors that pull them. The regulatory requirements are summarized in Table 6-3.
Several salient points of the regulation are as follows:
- The regulation applies to the tractor-trailer operator, not the manufacturer of the tractor or trailer.
- The regulation applies to any affected tractor-trailer operating on a California road—that is, not just to those trucks based or licensed in California. Thus the regulation is expected to affect truck operators and owners based in other states that deliver products to and from California.
- The regulation requires tractors and trailers of MY 2011 and later to meet SmartWay requirements as follows: All 53+ ft van trailers regardless of what type of tractor is pulling them; all sleeper cab tractors if pulling a 53+ ft van trailer of any MY. In addition, non-sleeper-cab tractors must use LRR tires.
Because the regulation provides several options that can extend the final compliance date beyond 2013, some truck operators may use 2010 and earlier noncomplying trailers until as late as 2019 if certain conditions or interim milestones are met.
TABLE 6-3 Summary of CARB Regulatory Requirements
| Type of Tractor and Trailer | Requirement and Timing |
| MY2011-2013 sleeper cab tractor | EPA SmartWay-certified. |
| MY2011-2013 day cab tractor | SmartWay-verified low rolling resistance tires. |
| MY2011-2013 model year 53+ van trailer | EPA SmartWay-certified. or Use SmartWay-verified aerodynamic device(s) that have been demonstrated to achieve at least a 5% fuel savings (4% for refrigerated trailers) and use SmartWay-verified LRR tires. |
| MY2010 and earlier tractors | Use SmartWay-verified LRR tires by 1/2013, both sleeper- and non-sleeper-cab tractors. |
| M 2010 and earlier trailers | Use SmartWay-verified device(s) by 1/2013 that have been demonstrated to achieve at least a 5% fuel savings (4% for a refrigerated trailers) and use SmartWay-verified LRR tires by 1/2017. |
SOURCE: http://www.arb.ca.gov/msprog/truckstop/trailers/ttghg_regorder.pdf and www.arb.ca.gov/regact/2013/hdghg2013/hdghg2013isor.pdf. Accessed November 18, 2013.
As noted in the introduction to Chapter 1, EPA and the National Highway Transportation Safety Board promulgated standards on GHG emissions and fuel consumption in 2011 (EPA and NHTSA, 2011). The two agencies declined at that time to regulate trailers. However, the GHG emissions model (GEM) used to certify engine and vehicle compliance includes the performance of a default van trailer for line-haul trucks. EPA indicates it only has the authority to set requirements for new trailers, whereas the CARB regulation requires existing trailers to install aerodynamic devices and existing tractors and trailers to use LRR tires.13
Methods for Aerodynamic Performance Evaluation
Regulations require reliable means of evaluation or testing to verify compliance. The value of compliance tests depends on ease of use, accuracy and precision of results, replicative fidelity, availability of test facilities, and relevance of the compliance test to real-world applications.
As noted in an earlier section, “Improvements to SmartWay,” both EPA and several users of the current SmartWay test procedures acknowledged inadequacies in the fidelity
______________
12 Sam Waltzer and Cheryl Bynum, U.S. Environmental Protection Agency, “SmartWay Technology Program: Influencing Efficient Freight Movement into the Future,” personal communication to Tom Cackette and Chuck Salter, NRC Committee on Technologies and Approaches to Reducing the Fuel Consumption of Medium- and Heavy-Duty Vehicles, Phase Two, July 24, 2013.
13 William Charmley, U.S. Environmental Protection Agency, personal communication to Tom Cackettte, committee member, August 2013.
and especially in the precision of results when using the modified TMC/SAE J1321 Type II. While this recommended practice may appear to be the default procedure for a future regulation, the various compliance tests and procedures need to be evaluated to determine which one(s) are best suited to the particulars of the new regulation.
There are numerous SAE-recommended practice protocols available to evaluate the aerodynamic performance of commercial vehicles and aerodynamic devices. Three in particular address full-scale commercial vehicles in open air conditions either on the highway or at the test track.
SAE J1321 was first published in 1986. It consists of test and analysis methods to determine the change in fuel consumption for trucks and buses with GVW rating (GVWR) of more than 10,000 lb. To improve the precision of the results for use in SmartWay, EPA developed 22 additional provisions for SAE J1321. Examples of the provisions include requirements that the test must be conducted on a test track, not a roadway, with a grade change on the test track not greater than 2 degrees and the test facility not more than 4,000 ft above sea level. The latest revision occurred in 2012 as TMC/SAE J1321 Type II. This recommended practice may be used to compare entire vehicles and for easy-to-change components. The revised recommended practice specifically states that “test results that do not rigorously follow the method described herein are not intended for public use and dissemination and shall not be represented as a J1321Type II test result.”14 It is used by the SmartWay program to assess vehicle and component performance.
SAE J1526 Type III recommended practice remains a work in progress. It is “a standard test procedure for comparing the fuel economy of components or systems” that can be switched from one vehicle to another in a short period of time” and “is ideally suited for comparing the fuel consumption of one vehicle to another and one component of a combination vehicle to the same component in another” (SAE, undated). SAE J1526 Type III is an open-road moderate-distance test with a minimum test distance of 28 mi. It involves two vehicles running the same test without interplay as in SAE J1264 Type I, described below. The object or device being tested is switched from one vehicle to the other on separate runs. Because it is an open-road test, variable control will be more challenging; however, it provides an alternative means of evaluating fuel consumption away from a test track. To improve the accuracy of the results when evaluating devices for the Innovative Technology credits in the Phase I Rule, the minimum route distance for SAE J1526 Type III must be increased from 28 mi to 100 mi and the route “must be representative in terms of grade.”15 Many of the 22 additional provisions from TMC/SAE J1321 Type II could also be applied to SAE J1526 Type III to further improve accuracy. The relative fuel economy of the component or vehicle under test is expressed “as a percentage of fuel saved. This factor is calculated using relative fuel consumption while operating with and without the test component or vehicle under evaluation” (SAE, undated).
SAE J1264 Type I was revised in 2011 and is a recommended practice “providing minimum requirements for testing components or systems of the type which can be switched from one truck to another with relative ease—that is, aerodynamic devices, clutch fans, tires, and the like. The test utilizes in-service fleet vehicles, operated over representative routes.”16 The tests are conducted with two vehicles in simultaneous operation within close proximity of each other: 200-250 yd (180-230 m). Halfway along the test leg of at least 50 mi, the trailing vehicle passes the lead vehicle and remains in the lead position for the remainder of the test leg. The relative fuel effectiveness of the component or system under test is determined as a percentage improvement factor.
The Phase I Rule provides for validation of the drag coefficient (Cd) through coast-down testing. Coast-down tests are usually conducted in accordance with SAE J1263, “Road Load Measurement and Dynamometer Simulation Using Coastdown Techniques.” This method was developed for light vehicle testing in relation to dynamometer simulation and to also serve heavy vehicle requirements. An additional recommended practice for coast-down tests is SAE J2263, “Road Load Measurement Using Onboard Anemometry and Coastdown Techniques.” The final result of SAE J2263 is a model of road load force (as a function of speed) during operation on a dry, level road under reference conditions.
The precision of the results from these recommended practices is highly dependent on test controls, protocols, and environmental factors. A significant effort is required to ensure that procedures are rigorously followed and that the external factors that can influence fuel consumption are tightly controlled. The fidelity of test results from this J1263 coast-down procedure to results from the powered J1321 (or other) track test could not be established. This is believed to be the critical issue in test procedure selection for trailer regulation.
Wind tunnel testing at reduced scale and full scale is another well-developed method of aerodynamic performance evaluation. SAE J1252 is “Recommended Practice Wind Tunnel Test Procedure for Trucks and Buses.” The scope encompasses the full range of full-scale MHDVs represented as either full-scale or reduced-scale wind tunnel models. The document provides guidance for wind tunnel testing to support current vehicle characterization, vehicle development, vehicle concept development, and vehicle component development.
______________
14 SAE. “Fuel Consumption Test Procedure—Type II.” Available at http://standards.sae.org/j1321_201202/. Accessed December 23, 2013.
15 40 CFR part 1037.601.
16 Society of Automotive Engineers, undated. “Joint RCCC/SAE Fuel Consumption Test Procedure (Short Term In-Service Vehicle) Type 1 (STABILIZED May 2011).” Warrendale, Pa.: SAE.
SAE J2971, “Recommended Practice Truck and Bus Aerodynamic Device Terminology” was issued in April 2013. It provides a standard naming convention for aerodynamic devices and technologies used to control aerodynamic forces on trucks, including trailers.
Finally, other promising methods include CFD and the constant-speed torque test. It is generally accepted by experts that constant-speed torque tests require standardization. CFD is proving very useful for product development, but there are practical limitations to its use as a compliance tool for whole vehicle evaluation; however, this is likely to change with time as CFD continues to improve. The recommended practice providing guidance for the use of CFD in evaluating commercial vehicle aerodynamic performance is SAE J2966, “Guidelines for Aerodynamic Assessment of Medium and Heavy Commercial Ground Vehicles Using Computational Fluid Dynamics.”
CURRENT USE OF AERODYNAMIC DEVICES AND LOW-ROLLING-RESISTANCE TIRES
New tractor specifications throughout the industry have been substantially influenced both by the SmartWay program and the CARB regulation. The committee prepared a questionnaire for several of the largest tractor manufacturers in an effort to quantify this result. The tractor manufacturers that were contacted accounted for about two-thirds of industry sales in the period noted in Table 6-4.
Among those manufacturers surveyed by the committee, nearly 60 percent of tractors sold (first two rows under Share of Sales) are fully equipped sleepers whose fuel consumption already benefits from SmartWay specification. (The manufacturers not contacted, which account for roughly one-third of sales, could have been either more or less likely to produce SmartWay-certified equipment.) This percentage will increase beginning in 2014, as will the performance of other new tractors, since the federal regulations affecting tractors will have become effective.
TABLE 6-4 Industry Sales Penetration of SmartWay Tractors and Components, circa mid-2012 to mid-2013
| Tractor Type (Classes 7 and 8) | Share of Sales (%) | Share of S/W |
||
| S/W Duals | S/W WBSTs | |||
| SmartWay fully compliant |
38 | 83 | 17 | |
| Aero sleeper |
23 | 67 | 17 | |
| Day cab w/roof fairing and/or other aero | 26 | 49 | 5 | |
| Day cab, no added fairings | 8 | 49 | 6 | |
| Classic and vocational | 4 | 23 | 1 | |
NOTE: Percentages are manufacturer sales-weighted.
a S/W, SmartWay.
b May apply a S/W label.
c Short one or more S/W components.
SOURCE: Responses to committee’s questionnaire for tractor manufacturers in October 2013.
It is significant that another 26 percent of tractors sold, day cabs, are also aero equipped; half of those use low-rolling-resistance (LRR) tires. Most tractor manufacturers supply well aeroengineered fairings for day cab tractors. It may be possible to separate the use of these tractor types into higher and lower speed applications. In the case of the higher average speed applications, requiring “full” aero-treatment could further reduce fuel consumption. There are certain trailers that are best served by tractors without aeroroof fairings (often called low-roof tractors). Among these trailers are flatbeds and many tankers. Finally, some day cab tractors and some sleeper cab tractors are not single purposed but are used in mixed “utility” haulage. This means pulling a van trailer at times and non-vans at other times; as well, either of those activities leads to performance at a mix of average speeds as duty cycle differences and congestion dictate. Regulators and even carriers need to consider if all these applications can benefit from high aero content.
Further, smart speed recorders might serve as a tool for setting a more stringent aero requirement. (Here the committee imagines a speed recorder computing the cumulative product of tractor moving time and speed-cubed that could be periodically evaluated. Such a time-averaged speed-cubed level would represent the added value of a high-aero configuration.)
A final observation from Table 6-4 is that a full 77 percent of all tractors were equipped with LRR tires,17 reflecting the carrier’s perception of their good value. Probably some of the non-LRRs legitimately require special tire operational features not achievable within an LRR specification.
Aerodynamic Devices on Van Trailers
The committee oversaw the collection of information on the use of aerodynamic devices on trailers by observing nearly 5,000 tractor/trailers operating on interstate highways in seven parts of the country. Persons with knowledge of trucking were provided photographs of the trucks, trailers, and aerodynamic devices of interest and instruction on how to conduct the informal surveys. Observations were made from the side of a highway where traffic could be clearly observed in one or both directions. The results were recorded on the individual forms. The observations were made at the following locations:
______________
17 Found by multiplying the values in the column Share of Sales by the percentages thereof having duals and WBSTs and summing.
- California, I5, Sacramento, northbound and southbound;
- California, I10, 90 mi east of Los Angles, westbound;
- California, I15, 87 mi east of Los Angeles, southbound;
- California, I80, 93 mi east of Sacramento, westbound;
- Arizona, I10, 10 mi west of Phoenix, eastbound and westbound;
- Oregon, I84, 5 mi east of Portland, eastbound and westbound;
- Texas, I35, 30 mi north of San Antonio, northbound and southbound;
- Michigan, I94, 26 mi west of Ann Arbor, eastbound and westbound;
- Pennsylvania, I81, 29 mi, south of Harrisburg, northbound and southbound; and
- Maryland, I95, 25 mi north of Washington, D.C., northbound and southbound.
The objective was to gain an understanding of the extent to which aerodynamic devices are being used and insight into how much the CARB regulation is influencing utilization of the devices compared to the sole economic motivation of saving fuel. The informal surveys were limited to 53+ ft dry and refrigerated van trailers being pulled by sleeper cab tractors, since this is a common tractor-trailer combination subject to the CARB rule. The exercise did not assess the use of aerodynamic tractors or LRR tires; in any case the latter are difficult to observe while trucks are in operation. Finally, a preliminary assessment did not find use of aerodynamic fairings on the front end of 53+ ft trailers, so such types of devices were not included in the informal survey.
The first major compliance date for trailers subject to the CARB regulation occurred on January 1, 2013. CARB provided an analysis showing that 78 percent of the 53+ ft van trailers should be in compliance; the remainder are allowed a longer phase-in period before compliance is required.18 It is thus not surprising that observations made in California and Arizona showed a greater proportion of trailers with aerodynamic devices than did those observations made in Oregon, Texas, Michigan, Pennsylvania, and Maryland (Table 6B-1, found in Annex 6B). Side skirts were overwhelmingly the predominant aerodynamic device strategy. Other strategies (underbody fairings and rear fairings) were observed in just a few instances.
Market for Trailer Aerodynamic Devices
Conversations with a selection of major van trailer manufacturers, complemented by the results of the committee’s questionnaire (see Annex 6A), provide information on equipping trailers with SmartWay-verified devices. Results summarized in Table 6-5 indicate that 40 percent of new van trailers sold from the four companies surveyed are equipped with side skirts. Several trailer manufacturers produce their own skirts, but they also install third-party skirts upon request. Trailer manufacturers indicate a high customer interest in side-skirt-equipped pup trailers (dual, 28 ft trailers). Several manufacturers reported a fuel use reduction of 7 to 9 percent for pups with side skirts (compared to 5 to 7 percent for advanced sides skirts used on 53+ ft van trailers). Other types of aerodynamic devices are only infrequently used on new trailers.
Trailer manufacturers say that their customers request trailers with aerodynamic devices to comply with the CARB regulation as much as to save fuel. Customers with high gross weight operations have requested trailer weight reduction to increase payload rather than to achieve fuel savings.
Trailer manufacturers also expressed concern that the EPA test procedures do not produce consistent results and say that improvements are needed. Notably, the modified SAE J1321 test procedure is claimed to provide precision of ±1 percent. Manufacturers are concerned that this is inadequate given that average device improvements are in the range of less than 1 percent to about 7 percent. The current precision levels are most troubling when the average performance is in the range of less than 1 to 2 percent. In addition, poor precision may cause a validation result to jump from one bin to another, depending on how the binning is designed. Further, binning ranges could be as narrow as the agencies (EPA and NHTSA) believe is prompted by validation measurement precision and could approach integer values—for example, bins of 4, 5, 6, and so on.
Skirt manufacturers report a growing share of sales to trailer manufacturers (60 percent) rather than retrofitters. Feedback from carriers indicates there is a good ROI from their use.19 Anecdotal information gained during the observations of on-road trailers indicates a few skirts badly damaged or missing from one side. The skirt manufacturers report no safety concerns (such as side skirts falling off) and little maintenance needed. One skirt manufacturer reported 5-7 percent fuel savings for skirts on container chassis based on fleet tests, although logistical chassis management such as vertical storage at shipyards, horizontal stacking for transport, and variable-length chassis may be problematic.20 One report on fuel savings from using side skirts on a flatbed trailer said there was a 4 percent reduction in fuel consumption,21 but loaded product size and shape were unspecified. Flatbeds and container chassis each account for about 7 percent of new trailer sales (ICCT, 2013). An in-depth discussion of benefits
______________
18 California Air Resources Board (CARB), “Existing and Future Trailer Regulations,” personal communication to Tom Cackette and Chuck Salter, committee members, July 30, 2013.
19 Sean Graham, Freight Wing, Inc., personal communication to Chuck Salter, committee member, August 26, 2013.
20 Further information is available at http://www.freightwing.com/chassis_fairing.php. Accessed November 18, 2013.
21 Further information is available at http://freightwing.com/custom_fairing.php. Accessed November 18, 2013.
TABLE 6-5 Characterizing the Experience of Van Trailer Manufacturers Producing SmartWay-Specified Trailers (North America)
| Responses from Companies | S/W Fuel Reduction Performance | Typical Responses | ||
| Customer interest in S/W specs | CARB | Yes | - | |
| ROI | No | - | ||
| Aero-device volume and prices | Skirts |
Total all vans: 40%; all dry vans (range): 25-60%; all reefers (range): 25-40% | ≥4% and 5% | $750 and up |
| Underbody |
Ranges from some to none | 5% | $1,000 and up |
|
| Tails |
Ranges from some to none | ≥1% and 5% | $800 and up |
|
| Gap | None | ≥1% | $650 |
|
| Aero other than 53 ft vans? | 28’ vans; 45’ vans; and/or tankers | None | Average. Twin 28′ pups performance 7-9% | |
| Customers seek weight reduction? | Yes | - | Yes, for high gross weight operations, not fuel consumption | |
| Collaboration w/tractor OEMs? | Yes, on S/T projects | - | ||
| S/W TP commentary | Level playing field needed; need to specify a standard test tractor; need track round-robin to validate precision | - | ||
| LRR tires usage | LRR duals are offered standard by manufacturers on some trailers (as many as 75%) | ≥1.5% | Slightly lower cost than standard but less tread depth | |
| WBST usage | 2-10% | ≥1.5% | High gross weight; average tandem cost: +$360 w/Fe wheel; +$768 w/Al wheel | |
NOTE: Al, aluminum; Fe, ferrous; S/W, SmartWay; S/T DOE SuperTruck projects; ROI, return on investment; TP, test procedure; and OEM, original equipment manufacturer.
a Skirt data for A,B,C,D combined.
bThese SmartTruck underbody devices are S/W classified as “advanced trailer end fairings.”
cS/W categories “trailer boat tails” and “advanced trailer end fairing.”
d Depending on design, mounting.
SOURCE: Data collected by the committee, August 2013.
and complications associated with other trailer types can be found at NRC (2010, pp. 99-107).
Those manufacturers of trailer tail devices for van trailers that were surveyed by the committee report they sold many fewer such devices than skirts; this was confirmed by the committee’s on-road observations. However, one manufacturer reported a 200 percent year-over-year increase in sales. This aerodynamics solution may become the next low-hanging fruit to harvest since fuel savings from these devices is approximately the same as that from side skirts. Fuel savings from trailers equipped with both side skirts and a trailer tail device were reported as 9-10 percent.22 The tail manufacturer producing a tail-fold-flat feature when the rear doors open claims there are no systematic issues once drivers are properly trained on tail device operation. The fold-flat tail autodeploys when doors are closed by the driver. Figures 6-7, 6-8, and 6-9 show examples of aerodynamic devices.
CARB provided information on the industry that provides aerodynamic devices for trailers. The data in Table 6-6 show that over the past 5 years both the number of companies making aerodynamic devices and the number of devices have increased more than sixfold. Cumulative nationwide sales exceed 400,000 devices, over 90 percent of which are side skirts. Notably, the installed price for trailer side skirts has decreased from $2,800 to less than $1,000, with an ROI break-even point for the truck operator due to fuel savings of less than 11 months.
______________
22 Jeff Grossman, ATDynamics, personal communication to Chuck Salter, committee member, August 28, 2013.
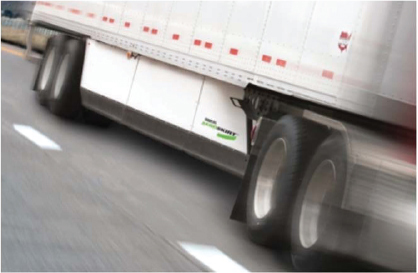
FIGURE 6-7 Wabash trailer skirt. Available at http://wabashcomposites.com/compositeshome/products/trailer-side-skirts/duraplate-aeroskirt-for-truckload-applications. Accessed November 14, 2013.
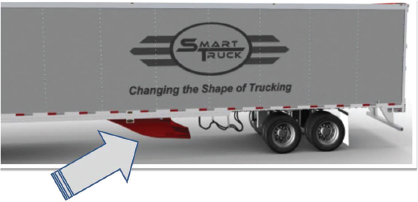
FIGURE 6-8 SmartTruck undertray: UT-1. Available at http://smarttrucksystems.com/undertray-UT1Base.php. Accessed November 14, 2013.
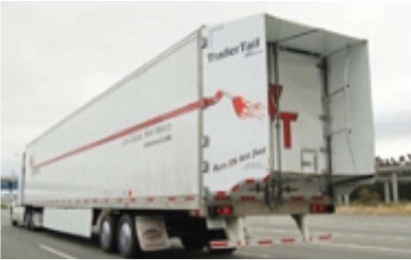
FIGURE 6-9 ATDynamics trailer tail. Available at http://www.atdynamics.com/trailertail.htm. Accessed November 14, 2013.
TABLE 6-6 Trailer Aerodynamic Device Industry
| Metric | January 2008 | April 2012 | June 2013 | |
| Companies making SmartWay devices | 5 | 21 | 33 | |
| Number of device types available | 11 | 59 | 76 | |
| Devices sold |
>2,200 | >180,000 | >400,000 | |
| Installed cost, average | $2,800 | $1,250 | <$1,000 | |
| Break-even period (months) |
30 | 11 | <11 | |
a Not all manufacturers contributed data.
b Assumes 2.5 trailers per tractor and 105,000 tractor highway miles per year.
SOURCE: California Air Resources Board, “Existing and Future Trailer Regulations,” personal communication to Tom Cackette and Chuck Salter, committee members, July 30, 2013.
SmartWay and the CARB regulation apply to the most common tractor and trailer types that are likely to accumulate high mileage at mainly highway speeds, thus taking maximum advantage of aerodynamic improvements. SmartWay verification is limited to high-roof sleeper-cab tractors and 53+ ft dry van trailers, while the CARB regulation also applies to refrigerated 53+ ft van trailers. CARB’s requirement to use LRR tires extends to day cabs.
Table 6-7 gives the percentage of trailers that are subject to the SmartWay voluntary program and CARB’s regulation of those that are trailers 41 ft and longer and dry van trailers 24 ft and longer, based on new sales in 2012 (ICCT, 2013). About 60 percent of the group of trailers that could benefit from aerodynamic devices and better tires are impacted by these government programs. The other 40 percent of trailers that could benefit from aerodynamic devices such as side skirts and LRR tires include the shorter dry van trailers often used in dual trailer applications, flatbeds, and container chassis (both sea and domestic). The data in the table show that the share of all trailers that could benefit from the use of aerodynamic devices could be as high as 80 percent. Side skirt manufacturers have developed and are marketing skirts for non-van trailers, as discussed previously. Further, smart speed recorders, described at the end of the section “Tractors,” might serve to establish if certain of these non-van combination trucks actually operate in a relatively high aerodynamic requirement (one with higher average speeds and annual vehicle miles traveled).
Barriers to Increased Use of Trailer Aerodynamic Devices
Although the fuel savings of pulling a high-use 53+ ft van trailer equipped with side skirts are only about 5 percent at 65 mph, this translates to an annual fuel savings of over $3,500
TABLE 6-7 Trailers Types Not Affected by Government Voluntary and Regulatory Programs
| Included in |
||||
| Trailer Category | Length (ft) | SmartWay | CARB | Cumulative Share of Trailer Sales (%) |
| Dry van trailer | ≥53 | ✓ | ✓ | 44 |
| Above plus refrigerated van trailers | ≥53 | ✓ | 47 | |
| Above plus midlength van trailers | ≥41 | 54 | ||
| Above plus short dry van trailers | ≥24 | 66 | ||
| Above plus flatbed, container, tank trailers | ≥41 | 80 | ||
a The data shown here include trailers regardless of what type of tractor pulls them.
b Of all 41+ foot trailers and 24-40 foot dry van trailers.
c New trailer sales in 2012.
SOURCE: ICCT, 2013.
(100,000 mi/year, 5.5 mpg,, and $4/gal). Even if the truck owner has 2.5 trailers per tractor, as is typical, the payback in fuel savings exceeds the cost of installing the side skirts in about 1 year. (A more conservative set of assumptions such as 3 percent fuel savings at 55 mph and 3 trailers per tractor would result in a 16 month payback period, which is still favorable.) So why aren’t all trailers, especially new trailers, equipped with fuel-saving devices?
One reason is that the trailer owner may not own the tractor that pulls its trailer. In this situation, the capital cost of trailer modification is borne by the trailer owner, but the fuel savings benefit the tractor owner. Until shipping rates begin to recognize and differentiate the fuel consumption of pulling a trailer with aerodynamic devices and the same consumption without such devices, there is no incentive for a trailer owner who does not own a tractor to purchase aerodynamic-equipped trailers or add aerodynamic devices to existing trailers.
A recent study based on a survey of truck fleet owners and operators and other stakeholders in the supply chain shed additional light on this question. Respondents to the survey identified five main barriers to increased use of more efficient trailers (NACFE and Cascade Sierra Solutions, 2013). These include
- Lack of credible information on fuel savings;
- Uncertainty regarding payback period (capital cost vs. fuel savings);
- Lack of access to capital;
- Questions regarding the reliability of the fuel-saving technologies; and
- No fuel-saving technologies available from preferred trailer or component suppliers.
Lack of credible information was the overarching barrier, which affects the rest of the perceived barriers and in particular the payback period. Small-scale operators were more concerned about the availability of capital than were big fleets operators, as would be expected. The end users were outspoken about the unavailability of product from preferred suppliers, whereas truck and trailer manufacturers did not see this as a significant issue.
Forward trailer bogie positions require shortening skirt length, which reduces aerodynamic performance. This results when trailers are required to meet varying state regulations related to the “bridge formula.”
The tractor manufacturers surveyed by the committee (Table 6-4) report that over 60 percent of new tractors are sleeper cabs and nearly two-thirds of those are SmartWay-labeled, thus equipped as required with SmartWay-verified LRR tires. Of the remaining one-third not S/W labeled, 84 percent are still ordered with verified LRR tires. This shows that carriers ordering new tractors are aware of and understand the fuel savings from using LRR tires.
The prevalence of WBSTs on sleeper cabs is about 17 percent. There are two incentives for ordering these more efficient tires: further fuel consumption reduction (1-1.5 percent) and weight reduction. Weight reduction due to use of lighter wide-base wheels (aluminum) and tires is especially beneficial in refrigerated (“reefer”) trailer applications where high gross weights are typical.
The committee’s collection of information from trailer manufacturers (Table 6-5) indicates that LRR tires are standard equipment on a high percentage of new van trailers. Use of WBSTs on new van trailers is in the range of 2 to 10 percent. Trailer manufacturers report that weight reduction is the principal incentive for WBSTs on trailers.
Replacement tire sales in the total commercial MHDV industry outpace those for original equipment application by a factor of three. Sales of replacement tires in 2012 were 15.8 million, while tractor and trailer OEMs purchased 5.1 million (RMA, 2013). Given the great popularity of LRR tires with OEMs, NHTSA should investigate the rolling resistance characteristics of replacement tires sold for these classes of trucks. If a substantial portion of higher rolling resistance replacement tires are in the current sales mix, and if LRR tires are not specified for the operational needs of the legacy fleet, additional fuel savings would accrue if replacement tires had lower rolling resistance.
The committee also sought input from tire manufacturers on the market for LRR truck tires. A questionnaire was developed focusing on tires used on Class 7 and Class 8 combination trucks. The intent was to update the committee’s knowledge of the tire industry’s contribution and ongoing needs in order to illustrate their valuable role. The industry uptake of WBSTs has been relatively cautious. The committee also sought to better understand the barriers to more widespread adoption of these tires, which typically provide lower rolling resistance than standard width tires.
The Rubber Manufacturers Association (RMA) provided information on conventional tires and WBSTs for both tractors and trailers (Table 6-8), as requested.
For conventional (not wide-base) tires shipped for use on new equipment, the RMA data show about a third lower use of SmartWay LRR tires on new tractors than reported by the tractor OEMs. In any event, the use of LRR tires on new tractors is substantial and is expected to increase significantly as the Phase I Rule requiring GHG emission reductions from new tractors begins. Likewise, many trailer manufacturers report use of SmartWay LRR tires on 75 percent or more of their trailer production, which comports with the RMA data.
The share of SmartWay-verified conventional replacement tires is similar to the share used on new equipment—42 percent of replacement shipments are SmartWay—with greater acceptance on trailers than tractors, according to the RMA data. The committee recognizes there are other operational needs (e.g., traction, scrub resistance, tread life, retreadability) that play a critical role in a carrier achieving lowest life-cycle cost for its tire environment.
WBSTs account for about 3 percent of new tire shipments, for both OEM equipment use and replacements, as shown in Table 6-9. This is lower than reported by OEM tractor manufacturers (approximately 10 percent, see Table 6-4) but within the range of use reported by trailer manufacturers (2 to 10 percent; see Table 6-5). Considering the reported fuel saving of 3 percent or more from replacing conventional narrow tires with wide-base tires (turning an 18-wheeler into a 10-wheeler), the adoption of WBSTs has been slow.
TABLE 6-8 Shipments of New Conventional Narrow Profile Tires for Tractors and Trailers, October 2012 to September 2013 (percent of shipments)
| Application of Conventional Narrow Tires That Are SmartWay-LRR-Verified |
||||
| New Equipment | Replacement Tires | New + Replacement | ||
| Tractor | 40 | 37 | 38 | |
| Trailer | 79 | 70 | 74 | |
| Total tractor + trailer | 52 | 42 | 45 | |
aRepresents 97 percent of total tire shipments.
SOURCE: Tracey Norberg, Rubber Manufacturers Association.
TABLE 6-9 Shipments of Conventional (Narrow) and Wide-Base Single Truck Tires, October 2012 to September 2013 (percent of shipments)
| Application | Conventional Tire | Wide-Base Tire |
| Tractor (new OE) | 97 | 3 |
| Tractor (replacement tire) | 98 | 2 |
| Trailer (new OE) | 96 | 4 |
| Trailer (replacement tire) | 93 | 7 |
| Tractor + trailer (new OE) | 97 | 3 |
| Tractor + trailer (replacement) | 97 | 3 |
SOURCE: Tracey Norberg, Rubber Manufacturers Association.
The tire and carrier industry identified the following as issues that may be impeding the greater use of LRR truck tires:
- Because carriers drive tire selection more than do tractor and trailer manufacturers, their highly varying experiences are what most influences purchases.
- The SmartWay program drives industry to seek reduced fuel consumption. However, the current comparative performance data available to carriers may not be precise enough to motivate the purchase of LRR tires.
- Although the ISO28580 rolling resistance test procedure calls for the correlation of measurement results, the industry lacks a master equipment correlation lab that would help assure consistent Crr values are achieved across the industry.
- WBSTs are designated in the United States by the metric sizes 445/50R22.5 and 455/55R22.5. These sizes need to be specified so as to differentiate them from early “super singles,” which performed poorly. Super-single issues are discussed in NRC (2010, p. 113).
- At least 50 percent of long-haul tires are retreads. SmartWay retread performance levels were specified by EPA in June 2012. Yet retread Crr performance hurdles (i.e., the maximum value allowed by EPA SmartWay specifications) are higher by 9 to 17 percent than new tire hurdles. And manufacturing and audit controls are believed more lax than for original equipment tires. This represents another opportunity for reducing fuel consumption.
Some barriers to WBST adoption were also identified. Those believed most significant are the following:
- Inability to run flat. Automatic tire inflation systems can significantly reduce this potential hazard. See the next section, “Tire Pressure Systems.” (Note that
-
operating on a flat tire is not allowed by FMCSR 393.75.)
- Life-cycle cost remains unsure if the various components such as tread life or downtime due to flats, as well as the comparability of the Crrs themselves, are not correctly estimated.
- Tread life, which—as noted elsewhere—may be as much as a third shorter than that of dual tires.
- The number of allowable retreads is usually one, compared to two and sometimes three for duals.
Overall, about half of SmartWay-verified LRR tire usage is for new equipment and 42 percent for replacement tires. Greater use of LRR tires on new tractors could occur as a result of the Phase I Rule. It is uncertain if greater use of LRR tires on new trailers and for replacement tires will occur in the absence of requirements or incentives.
There are two primary types of tire pressure systems: tire pressure monitoring systems (TPMS), which use sensors in various configurations and locations to sense and communicate tire pressure, and automatic tire inflation systems (ATIS), which inflate tires when pressure is low and, in some cases, can deflate tires to correct for pressure rises when the temperature increases. One tire manufacturer remarked that tire pressure systems may be nearly as significant for GHG reduction as lower Crr. One trailer manufacturer reported that 60 percent of its van trailers had been equipped with these systems over the most recent 12 months of production. Likewise, one tire manufacturer reported 40 percent of its trailer tires were equipped with TPS sensors.
These industry reports are corroborated by a U.S. Department of Transportation (DOT) study (2008) on the effectiveness of TPMS. These are some of its findings:
- Improper tire inflation leads to accelerated tire wear (which subsequently leads to compromised braking, poor handling, and reduced stability); increased fuel consumption; greater propensity for catastrophic tire failures (blowouts); more dangerous roadside debris; and an increased number of road calls to repair deflated tires.
- Approximately 7 percent of all tires are underinflated by 20 psi or more. Only 44 percent of all tires are within 5 psi of their target pressure.
- Tire-related costs are the single largest maintenance cost item for commercial vehicle fleet operators.
- Improper tire inflation reduces fuel economy by about 0.6 percent.
Another DOT study (2007) included these important observations:
- Tire pressure monitoring and inflation systems greatly simplify the task of checking and maintaining tire pressure.
- There is significant diversity in the design and technological approach of the marketplace’s offering of tire inflation and monitoring systems.
- Commercial vehicle tire inflation and condition directly link to stopping distance and handling and thus to overall safety. Properly maintained and performing tires aid drivers in preventing and mitigating crash situations.
There are 18 or more manufacturers of various types of commercial vehicle tire pressure monitors in North America. Monitor systems are generally characterized by the location of their sensor mounting: on the valve stem (currently the most prevalent in company offerings), on the wheel, or in the tire. Inflation systems are characterized by the nature of the air supply and variable or constant inflation, with the latter the most prevalent in company offerings. Variable inflation pressure is typically utilized to facilitate increased traction, particularly in off-road situations or certain reduced-speed applications. At least a dozen companies offer these products. Both handheld and in-cab readouts are offered.
The North American Council for Freight Efficiency (NACFE) published a report on these systems in August 2013, in which it concluded there are three benefits to carriers for the introduction of such systems, including the decrease in roadside breakdowns due to blowouts caused by underinflation, longer life for the tires, and improved fuel efficiency. These benefits depend on the effectiveness of a fleet’s manual tire pressure maintenance system before a device is installed, but the investment in such systems for trailers was recouped in about 8 months. Finally, NACFE estimates that 40 percent of new trailers are being manufactured with TPS, with ATIS outnumbering TPMS by about 3 to 1.
There is a huge body of experience with TPMS in the U.S. light-duty vehicle category. Beginning on October 5, 2005 (and phased in through September 1, 2007), such systems (TPMS) have been required on all four-wheel vehicles up to 10,000 lb GVWR (DOT, 2007).
Following a meeting in the spring of 2011 of ATA’s Technology and Maintenance Council, an article appeared in TireBusiness.com entitled “Time for feds to act on truck TPMS.”23 It noted that fleets were continuing to adopt TPMS and ATIS on both tractors and trailers, in acknowledgment that they increase the life of tires and improve fuel economy (test fleets reported a 1.4 percent increase). These improvements came in addition to the safety enhancements reported by the aforementioned DOT study (2007).
The industry article encouraged the FMCSA to soon issue a recommendation for the use of TPMS on commercial
______________
23TireBusiness.com, Crain Communication, Inc., “Time for feds to act on truck TPMS,” Detroit, Mich., March 28, 2011.
vehicles. That would give fleets direction as to which type of products they should or must use to better monitor and maintain their tires.
The author concluded that by integrating tire monitoring and inflation systems with telematics24 systems, fleets will greatly improve their tire maintenance, fuel economy, and safety and will reduce their tire costs-per-mile and in-route breakdowns.
A recent response from NHTSA is its solicitation of input on truck tire maintenance practices to help determine the impact of TPS on commercial vehicle fuel economy. This information solicitation is to support its study on feasible fuel-economy standards for medium and heavy-duty trucks for MY2019 and beyond. 25
Finding: When a trailer is not owned by the tractor owner-operator (who pays for fuel), there is no incentive for the trailer owner to purchase fuel-saving devices.
Finding: In a survey of trailer manufacturers responsible for two-thirds of industry sales, it was found that only 40 percent of new van trailers come equipped with fuel-saving aerodynamic devices such as side skirts, which suggests that fuel saving is not a dominant consideration in purchasing a new van trailer.
Finding: Only a few van trailer manufacturers promote use of aerodynamic-device-equipped trailers on their websites; others will install devices if requested by the customer, who chooses from an option list.
Finding: The benefits and favorable return on investment that result from more efficient van trailers have been demonstrated by testing and fleet feedback. Use of trailer aerodynamic devices on van trailers, in particular side skirts, provides a full return on investment through fuel savings in about 1 year, on average. Yet the majority of both new and in-use van trailers currently do not use these fuel-saving devices.
Finding: A California regulation requires operators of van trailers to use aerodynamic devices to reduce the energy required to pull them. Observations made in California and Arizona showed a greater proportion of trailers with aerodynamic devices than did those observations made in Oregon, Texas, Michigan, Pennsylvania, and Maryland. Side skirts were overwhelmingly the predominant aerodynamic devices strategy. Other strategies (underbody fairings and rear fairings) were observed in relatively few instances.
Finding: Trailer manufacturers report that compliance with California’s regulation is of greater interest than fuel savings when decisions are made on new van trailer purchases. This suggests it is doubtful that the U.S. fleet’s use of fuel-efficient trailers will become universal in the absence of a regulation or other strong incentive.
Recommendation 6.1: NHTSA, in coordination with EPA, should adopt a regulation requiring that all new, 53 ft and longer dry van and refrigerated van trailers meet performance standards that will reduce their fuel consumption and CO2 emissions. The lead time to implement this regulation should be evaluated independently from lead time requirements applicable to the next set of standards for new engines and tractors, because less time is needed to perform compliance testing and install aerodynamic devices on new trailers. The agencies should also collect real-world data on fleet use of aerodynamic trailers to help inform the regulation.
Finding: The current SmartWay program and CARB regulation address only the most commonly used trailer, the 53 ft or longer van trailer, which, among those manufacturers surveyed by the committee, accounts for about 60 percent of the trailers that could benefit from the use of aerodynamic devices. Use of aerodynamic devices on other types of trailers, such as container/chassis and shorter vans, including dual trailers (“pups”), could provide additional fuel savings of 4 to 9 percent per tractor-trailer, according to industry estimates. Fuel savings from the use of side skirts have also been demonstrated on flatbed trailers. The cost-effectiveness of using aerodynamic devices on these additional categories of trailers depends on their annual mileage and average speed, among other considerations such as access to the trailer underbody, and needs further assessment and quantification.
Recommendation 6.2: NHTSA, in coordination with EPA, should determine whether it would be practical and cost-effective to include along with the regulation of van trailers the regulation of other types of trailers such as pups, flatbeds, and container carriers, as doing so could substantially increase overall fuel savings.
Finding: Both trailer and aerodevice manufacturers report that based on replicate tests and testing across different facilities, fuel consumption results determined by the SAE J1321 test procedure lack the necessary precision for accurately assessing the small incremental improvements provided by aerodynamic devices. Depending on the device evaluated, the procedure-specified precision range can be as much as 100 percent of the result.
______________
24 Denotes the use of devices that incorporate both telecommunications and informatics. See, for example, www.telematics.com.
25TireBusiness.com, “NHTSA to Study Mileage Impact of Truck TPMS,” December 14, 2012.
Finding: The relative fidelity of test results from the coast-down procedure as opposed to results from a powered on-track test is not known. Fidelity is believed to be the critical parameter in test procedure selection for trailer regulation.
Finding: Aerodynamic practitioners recognize that both wind tunnel testing and computational fluid dynamics (CFD) simulation can provide a good basis for development of aerodynamic surfaces and devices. Both wind tunnel and CFD methods can reduce the cost of development, may avert the building of multiple full-size prototypes, and can shorten development time for the final product.
Finding: The committee’s discussions with trailer manufacturers indicate that not all end users are confident of the fuel savings that will be realized from using aerodynamic devices on trailers. Improvement of test precision and repeatability may help address this concern.
Recommendation 6.3: NHTSA should evaluate the relative fidelities of the coast-down procedure and candidate powered procedures to define an optimum prescribed full-vehicle test procedure and process and should validate the improved procedure against real-world vehicle testing. Further, the Agencies should assess if adding yaw loads to the validation process provides significantly increased value to the Cd result. In addition, the Agencies should disseminate to end users updated test data and fuel savings of efficient trailers, aerodynamic devices, and tires, especially to those not participating in the SmartWay program. This should increase end user confidence in fuel savings and device reliability.
Finding: Among those manufacturers surveyed by the committee, nearly 60 percent of tractors sold are fully equipped sleepers whose fuel consumption already benefits from SmartWay specification. Because federal regulations that mandate improvements in tractor efficiency begin in 2014, the fraction of efficient tractors sold will likely quickly increase.
Finding: Tire pressure monitoring systems (TPMS) and automatic tire inflation systems (ATIS)—collectively, “tire pressure systems,” or TPS—are being increasingly accepted by fleets for their operational benefits (fewer flats, reduced fuel consumption, and longer tire life) and considerable safety benefits (uncompromised vehicle stability and short stopping distances).
Finding: The commercial vehicle industry has no standards for any of the following: TPS designation, minimum performance for various system types, driver displays, and testing procedures for system validations.
Recommendation 6.4: The lack of standardization of TPS for commercial vehicles might be appropriately remedied by professional or industry organizations such as the Society of Automotive Engineers or the Technology and Maintenance Council, or by a collaboration of such organizations. In support of that activity, it would be beneficial for NHTSA to prepare a white paper to clarify the minimum TPS performance needed from a safety perspective.
Finding: Many new tractors and most new trailers are equipped with low-rolling-resistance tires that meet the SmartWay performance standard, and the share of vehicles so equipped is likely to increase owing to regulatory requirements. However, 70 percent of new tires sold in 2012 for use on tractors and trailers were for replacement of existing tires, and only 42 percent of these were SmartWay verified. There is no assurance that replacement tires will one day be as energy efficient as the original equipment tires they replace.
Recommendation 6.5: NHTSA, in coordination with EPA, should further evaluate and quantify the rolling resistance of new tires, especially those sold as replacements. If additional cost-effective fuel savings can be achieved, NHTSA should adopt a regulation establishing a low-rolling-resistance performance standard for all new tires designed for tractor and trailer use.
Finding: Crr measurement in tires will have to be precise given the relatively modest fuel savings achievable with low-rolling-resistance tires. Further, while the ISO28580 test procedure is given good grades by most in the industry, there does not exist a robust machine cross-correlation for commercial vehicle tires in the United States. Carriers cannot depend on the comparability of Crr measurements from the approximately 60 tire suppliers verified by SmartWay.
Recommendation 6.6: NHTSA, supported by EPA, should expeditiously establish and validate the equipment and process for a tire industry machine alignment laboratory and mandate the use of that laboratory by each tire manufacturer seeking Crr validation for any tires being offered as candidates in the GEM computation process, just as the Crr’s of light-duty-vehicle tires were validated.
Corbett, J.J., and J.J. Winebrake. 2007. Sustainable movement of goods: Energy and environmental implications of trucks, trains, ships, and planes, Environmental Management (November): 8-12.
Cummins, Inc. 2009. Framework for the Regulation of GHGs from Commercial Vehicles.
Department of Transportation (DOT). 2007. Tire Pressure Monitoring and Maintenance Systems Performance Report, FMCSA-PSV-07-001. Washington, D.C.: U.S. Department of Transportation, January.
DOT. 2008. Commercial Vehicle Safety Technologies: Applications for Tire Pressure Monitoring and Management. Paper Number 09-0134. Washington, D.C.: U.S. Department of Transportation.
EPA and NHTSA. 2011. Federal Register, Vol. 76, No.179, pp. 57106 to 57513. September 15.
Federal Highway Administration (FHWA). 2006. Freight Performance Measure: Travel Time in Freight Significant Corridors. Washington, D.C.: U.S. Department of Transportation.
International Council on Clean Transportation. 2013. Trailer technologies for increased heavy-duty vehicle efficiency—Technical, market, and policy considerations. White Paper. June.
National Research Council (NRC). 2010. Technologies and Approaches to Reducing the Fuel Consumption of Medium- and Heavy-Duty Vehicles. Washington, D.C.: The National Academies Press.
NRC. 2012. Review of the 21st Century Truck Partnership, Second Report. Washington, D.C.: The National Academies Press.
North American Council for Freight Efficiency (NACFE) and Cascade Sierra Solutions. 2013. Barriers to the Increased Adoption of Fuel Efficiency Technologies in the North American On-Road Freight Sector. Fort Wayne, Ind.: NACFE. July.
NACFE. 2013. Tire Pressure Systems—Confidence Report. Fort Wayne, Ind.: NACFE. August.
Rubber Manufacturers Association (RMA). 2013. 2012 Tire shipments unchanged. Dan Zielinski, Washington, D.C., April 3.
Society of Automotive Engineers. Undated. “Fuel Consumption In-Service Test Procedure Type III.” Warrendale, Pa.: SAE International.
TIAX. 2009. Assessment of Fuel Consumption Technologies for Medium- and Heavy-Duty Vehicles. Report prepared for the National Academy of Sciences by TIAX LLC, Cupertino, Calif. July 31.
Winebrake, J.J., J.J. Corbett, A. Falzarano, J.S. Hawker, K. Korfmacher, S. Ketha, and S. Zilora. 2008. Assessing energy, environmental, and economic tradeoffs in intermodal freight transportation. Journal of the Air and Waste Management Association 58(8): 1004-1013.
ANNEX 6A QUESTIONS POSED TO VAN TRAILER MANUFACTURERS TO GATHER INFORMATION FOR TABLE 6-5
Briefly describe your product type(s), sales volumes, and typical selling price (OE and retrofit) for each (perhaps you want to report the highest 1 or 2 performing devices in each SmartWay category in which you produce).
Identify sales volumes driven by (1) Customers’ Expected ROI, (2) Compliance to California Regulation, (3) Unknown.
For described products, report SmartWay aerodynamic performance (and test procedure used for each: J1321 track, wind tunnel, coast-down, other):
Customer acceptance. Please comment on what you believe are the biggest barriers to acceptance of each product type—customers lacking credible performance information; installed cost (customer uncertainty of information for ROI calculation; poor ROI), cost of performance certification; interference with normal driver functions; existing government regulations; other (specify) (list in approximate descending order). Include customer feedback.
Describe any customer feedback you have received on maintenance or reliability issues. Are they resolved?
What safety concerns or experiences have been reported by customers?
Do you anticipate further performance improvements for any of the described product types in the next 5+ years? (Please be as specific as you can.)
Are you collaborating with tractor OEMs in product development?
Which corporate entity do you think should be responsible for trailer performance certification in the event of a greenhouse gas regulation that includes trailers? Tractor, trailer, or device manufacturer? Please explain your thinking.
Are your products applicable to trailer types other than 53 ft vans? What marketing incentives are absent that currently restrict those developments? Will you share aerodynamic performance results with your products on trailer types other than 53 ft vans?
This annex reports the raw data from the observations of van trailers observed by 12 experts during August 2013 (Annex Table 6B-1). The contributors made these observations working at 10 locations, individually or in teams. The day and time of the observations was at the discretion of these individuals and did not follow a pre-set sampling plan, so the results of this informal survey cannot be generalized. The accuracy of these observations was not verified. The locations were chosen to include five locations in or near California; the major cross-country routes into California (e.g., I-80, I-15) and another route leading into California from Arizona (I-10); and five locations in different parts of the continental United States. The purpose was to explore the hypothesis that van trailers operating in, or destined for, California, which is the only state currently requiring the use of aerodynamic devices, would have a higher observed incidence of aerodynamic trailer fittings than those in other parts of the country.
ANNEX TABLE 6B-1 Observations Made on the Use of Aerodynamic Devices on 53+ ft Dry or Refrigerated Vans Pulled by Sleeper Cab Tractors
| Location |
No. of Trailers in Sample | Side Skirts | Underbody Fairings | Rear Fairing | Trailer w/ Device |
| CA, I-5, Sacramento, NB, SB | 565 | 199 | 11 | 0 | 210 |
| CA, I-10, 90 mi E of LA, WB | 1,068 | 371 | 42 | 10 | 414 |
| CA, I-15, 87 mi E of LA, SB | 944 | 392 | 55 | 8 | 450 |
| CA, I-80, 93 mi E of Sacramento, WB | 497 | 206 | 15 | 2 | 216 |
| AZ, I-10, 10 mi W of Phoenix, EB, WB | 300 | 119 | 10 | 6 | 130 |
| OR, I-84, 5 mi E of Portland, EB, WB | 100 | 23 | 1 | 1 | 24 |
| TX, I-35, 30 mi N of San Antonio, NB, SB | 215 | 45 | 4 | 3 | 49 |
| MI, I-94, 26 mi W of Ann Arbor, EB, WB | 289 | 64 | 2 | 0 | 66 |
| PA, I-81, 29 mi S of Harrisburg, NB, SB | 662 | 170 | 11 | 0 | 181 |
| MD, I-95, 25 mi N of Washington DC, NB, SB | 300 | 68 | 6 | 0 | 74 |
NOTE: See note in text regarding the design of the observations. AZ, Arizona; CA, California; DC, District of Columbia; MD, Maryland; MI, Michigan; PA, Pennsylvania; and OR, Oregon.
a WB, SB, and so on indicate the direction on the freeway surveyed. Some surveys were in only one direction.
b Trailers using one or more devices. The sum of columns 3, 4, and 5 does not agree with the final column because a small number of trucks use two devices.
This page intentionally left blank.


