
F
Presentation Slides on Career Outcomes of Women Engineering Bachelor’s Degree Recipients
Gail Greenfield
THE CAREER OUTCOMES OF FEMALE ENGINEERING BACHELOR’S DEGREE RECIPIENTS:
A STUDY USING THE BACCALAUREATE & BEYOND (B&B) LONGITUDINAL STUDY
Gail Greenfield, Ph.D. The National Research Council
What is the B&B Longitudinal Study?
![]() Conducted by U.S. Department of Education’s National Center for Education Statistics (NCES)
Conducted by U.S. Department of Education’s National Center for Education Statistics (NCES)
![]() Examines post-graduation experiences - e.g., education, employment, and family — of those who have graduated with a bachelor’s degree
Examines post-graduation experiences - e.g., education, employment, and family — of those who have graduated with a bachelor’s degree
![]() Captures information on degree recipients’undergraduate experiences and key demographic information
Captures information on degree recipients’undergraduate experiences and key demographic information
![]() Follows multiple cohorts of students over time
Follows multiple cohorts of students over time
B&B Cohort 1 (1992-1993)
![]() Nationally representative sample of approximately 11,000 students who graduated with a bachelor’s degree during the 1992-1993 academic year
Nationally representative sample of approximately 11,000 students who graduated with a bachelor’s degree during the 1992-1993 academic year
![]() Students were surveyed in their last year of college, with follow-up surveys conducted one year after graduation (1994), four years after graduation (1997), and ten years after graduation (2003)
Students were surveyed in their last year of college, with follow-up surveys conducted one year after graduation (1994), four years after graduation (1997), and ten years after graduation (2003)
B&B Cohort 2 (1999-2000)
![]() Nationally representative sample of about 10,000 students who graduated with a bachelor’s degree during the 1999-2000 academic year
Nationally representative sample of about 10,000 students who graduated with a bachelor’s degree during the 1999-2000 academic year
![]() A follow-up survey was conducted one year after graduation (2001)
A follow-up survey was conducted one year after graduation (2001)
B&B Cohort 3 (2007-2008)
![]() Nationally representative sample of close to 19,000 students who graduated with a bachelor’s degree during the 2007-2008 academic year
Nationally representative sample of close to 19,000 students who graduated with a bachelor’s degree during the 2007-2008 academic year
![]() A follow-up survey was conducted one year after graduation (2009)
A follow-up survey was conducted one year after graduation (2009)
![]() Another follow-up survey is in progress
Another follow-up survey is in progress
The study emphasizes Cohort 1
![]() Cohort 1 provides a picture of the career paths of college graduates over a ten year period after graduation, while Cohorts 2 and 3 provide a picture of college graduates only one year after graduation
Cohort 1 provides a picture of the career paths of college graduates over a ten year period after graduation, while Cohorts 2 and 3 provide a picture of college graduates only one year after graduation
![]() Cohorts 2 and 3 are used primarily for cross-cohort comparisons
Cohorts 2 and 3 are used primarily for cross-cohort comparisons
Key questions study addresses
![]() What are the career outcomes of women who receive bachelor’s degrees in engineering?
What are the career outcomes of women who receive bachelor’s degrees in engineering?
![]() How do these career outcomes compare to men who receive bachelor’s degrees in engineering and to women who receive bachelor’s degrees in other “career-oriented” majors (e.g., business and management, education, and health)?
How do these career outcomes compare to men who receive bachelor’s degrees in engineering and to women who receive bachelor’s degrees in other “career-oriented” majors (e.g., business and management, education, and health)?
![]() What factors help explain these observed career outcomes?
What factors help explain these observed career outcomes?
Primary limitations of the B&B data
![]() Limited number of engineers represented in each survey
Limited number of engineers represented in each survey
![]() For example, of the approximately 8,000 in Cohort 1 who responded to all four surveys, fewer than 7% graduated with a degree in engineering
For example, of the approximately 8,000 in Cohort 1 who responded to all four surveys, fewer than 7% graduated with a degree in engineering
![]() Of these, only about 80 are women
Of these, only about 80 are women
![]() The online tool that provides access to the data does not permit the pooling of cohorts and limits the ways in which variables can be used and created
The online tool that provides access to the data does not permit the pooling of cohorts and limits the ways in which variables can be used and created
Cases for each cohort and survey
| Engineering graduates responding to the survey | ||||
| Cohort | Survey Year | All | Male | Female |
| 1 | 1994 | 640 | 550 | 90 |
| 1997 | 625 | 535 | 90 | |
| 2003 | 575 | 490 | 85 | |
| All surveys* | 520 | 440 | 80 | |
| 2 | 2001 | 580 | 480 | 100 |
| 3 | 2009 | 930 | 750 | 180 |
For confidentiality purposes, B&B does not reveal exact sample sizes. Numbers in the table are approximate.
*Includes the base year survey in 1993.
Another limitation of the B&B data
![]() Survey does not allow us to identify those who have progressed to engineering managers and supervisors
Survey does not allow us to identify those who have progressed to engineering managers and supervisors
![]() Rather, individuals are recorded as managers or supervisors, with no information provided on the nature of the work overseen
Rather, individuals are recorded as managers or supervisors, with no information provided on the nature of the work overseen
![]() This limitation is most problematic for Cohort 1 since one might expect a sizable number of these graduates to have progressed to manager or supervisor by ten years after graduation
This limitation is most problematic for Cohort 1 since one might expect a sizable number of these graduates to have progressed to manager or supervisor by ten years after graduation
Methodology
Key career outcomes examined
![]() Percentage of graduates in the labor force (“labor force participation”)
Percentage of graduates in the labor force (“labor force participation”)
![]() Percentage of employed graduates working in the field of their major (“retention”)
Percentage of employed graduates working in the field of their major (“retention”)
Two types of analyses are utilized:
1. Descriptive comparisons
![]() To the extent that the B&B surveys are representative, descriptive comparisons describe the population of individuals receiving undergraduate degrees in engineering in the graduation year under consideration (e.g., 1992-1993)
To the extent that the B&B surveys are representative, descriptive comparisons describe the population of individuals receiving undergraduate degrees in engineering in the graduation year under consideration (e.g., 1992-1993)
![]() Such statistics are useful in understanding the gender similarities and differences in career outcomes for those with bachelor’s degrees in engineering
Such statistics are useful in understanding the gender similarities and differences in career outcomes for those with bachelor’s degrees in engineering
Two types of analyses are utilized:
2. Multiple regression
![]() Enables us to gain insights into what might explain observed differences in career outcomes
Enables us to gain insights into what might explain observed differences in career outcomes
![]() Use to examine the relationship between an outcome of interest — e.g., labor force participation — and a variable that is hypothesized to be related to this outcome — e.g., gender — holding constant other factors that may also be related to the outcome — e.g. age, marital status, undergraduate debt
Use to examine the relationship between an outcome of interest — e.g., labor force participation — and a variable that is hypothesized to be related to this outcome — e.g., gender — holding constant other factors that may also be related to the outcome — e.g. age, marital status, undergraduate debt
Results of analysis
Descriptive comparisons: Labor force participation
Labor force participation
![]() Upon graduating with a bachelor’s degree, one key decision a graduate makes is whether to join the labor force
Upon graduating with a bachelor’s degree, one key decision a graduate makes is whether to join the labor force
![]() Those who choose not to join the labor force do so for a variety of reasons, such as attending school, family responsibilities, health problems, and the like
Those who choose not to join the labor force do so for a variety of reasons, such as attending school, family responsibilities, health problems, and the like
![]() This section compares the labor force participation rates (LFPR) of male and female bachelor’s degree recipients at various points after graduation
This section compares the labor force participation rates (LFPR) of male and female bachelor’s degree recipients at various points after graduation
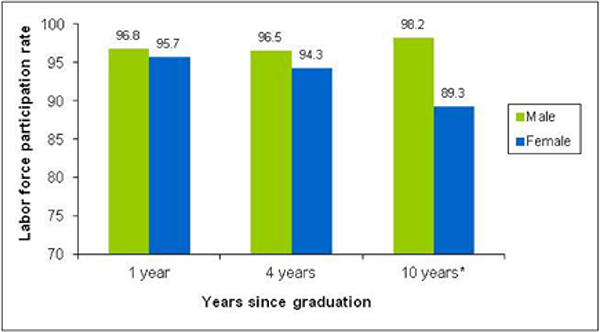
LFPR by gender for engineering bachelor’s degree recipients, B&B Cohort 1
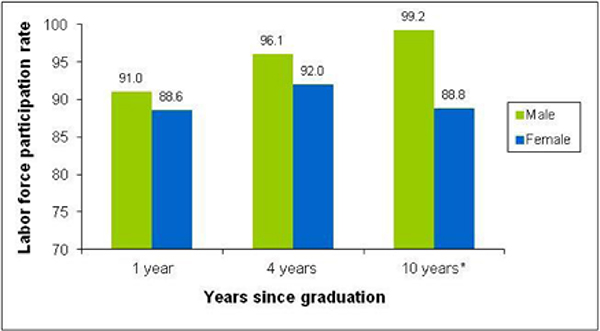
*Difference between mole rate and female rate is statistically significant at the 5% level.
Note: The increases in LFPR over time for moles are statically significant at the 5% level.
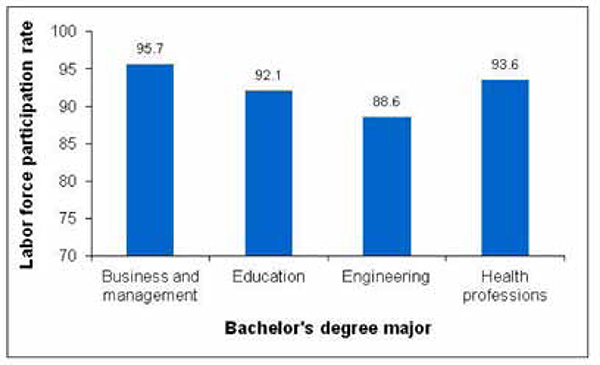
LFPR one year after graduation for female bachelor’s degree recipients, B&B Cohort 1
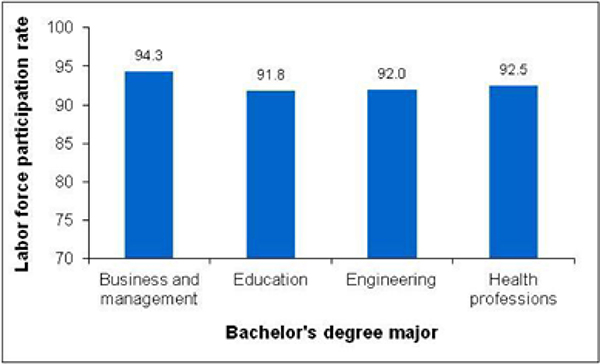
LFPR four years after graduation for female bachelor’s degree recipients, B&B Cohort 1
LFPR ten years after graduation for female bachelor’s degree recipients, B&B Cohort 1
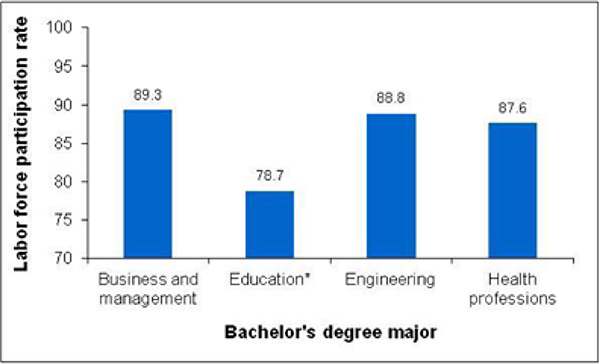
*Difference between this major and engineering major is statistically significant at the 5% level.
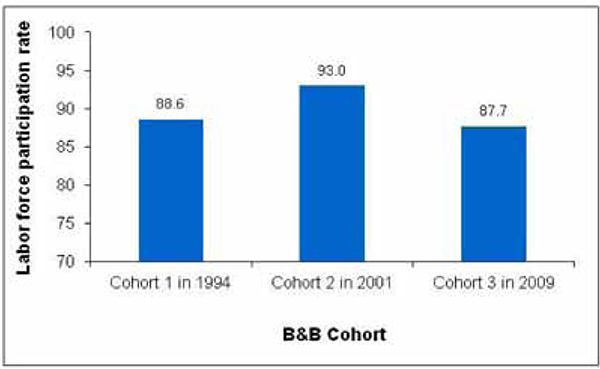
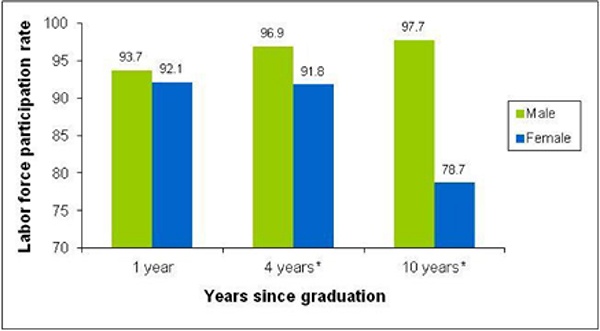
LFPR one year after graduation for female engineering bachelor’s degree recipients, by B&B cohort
LFPR one year after graduation for male engineering bachelor’s degree recipients, by B&B cohort
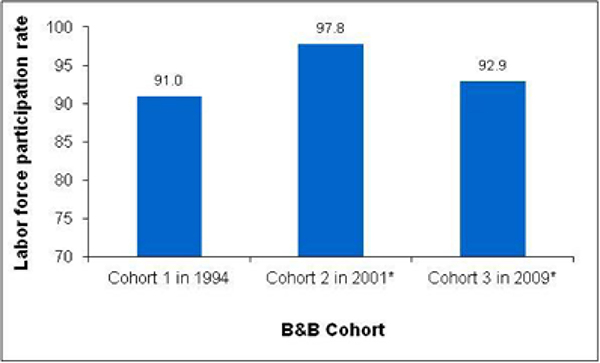
*Difference between this cohort and prior cohort is statistically significant at the 5% level.
LFPR summary of findings
![]() For engineering bachelor’s degree recipients in Cohort 1, the male LFPR increases with increases in time since graduation; this pattern is not seen for female graduates
For engineering bachelor’s degree recipients in Cohort 1, the male LFPR increases with increases in time since graduation; this pattern is not seen for female graduates
![]() Moreover, by ten years after graduation, the LFPR for females is more than 10 percentage points lower than the rate for males
Moreover, by ten years after graduation, the LFPR for females is more than 10 percentage points lower than the rate for males
![]() However, the female LFPR ten years after graduation remains high (~89%)
However, the female LFPR ten years after graduation remains high (~89%)
LFPR summary of findings
![]() For this same cohort, the LFPR for female engineering bachelor’s degree recipients is similar to the rates for female graduates with business/management and health-related majors
For this same cohort, the LFPR for female engineering bachelor’s degree recipients is similar to the rates for female graduates with business/management and health-related majors
![]() Across B&B cohorts, the LFPR for male engineering bachelor’s degree recipients one year after graduation increased from Cohort 1 to Cohort 2 and then fell from Cohort 2 to Cohort 3; a similar (but not statisticaliy significant) pattern can be seen for female engineering bachelor’s degree recipients
Across B&B cohorts, the LFPR for male engineering bachelor’s degree recipients one year after graduation increased from Cohort 1 to Cohort 2 and then fell from Cohort 2 to Cohort 3; a similar (but not statisticaliy significant) pattern can be seen for female engineering bachelor’s degree recipients
Results of analysis
Descriptive comparisons: Retention
Retention
![]() For those graduates who choose to be in the labor force, a key decision is whether to work in an occupation that is in the field of their major
For those graduates who choose to be in the labor force, a key decision is whether to work in an occupation that is in the field of their major
![]() This section compares the “retention” rates of employed male and female bachelor’s degree recipients at various points after graduation
This section compares the “retention” rates of employed male and female bachelor’s degree recipients at various points after graduation
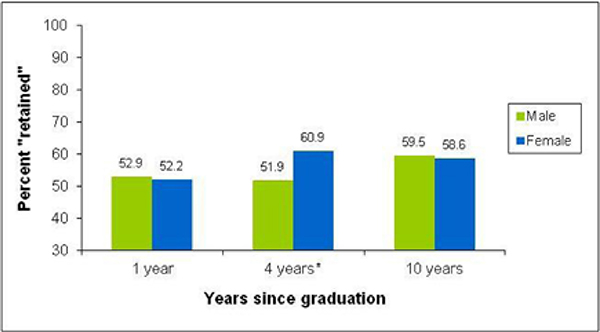
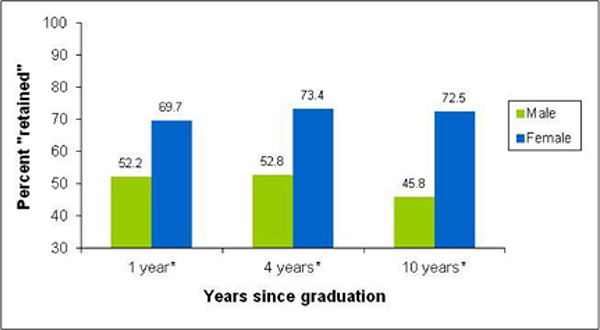
Employed engineering bachelor’s degree recipients in an engineering/architecture occupation, B&B cohort 1
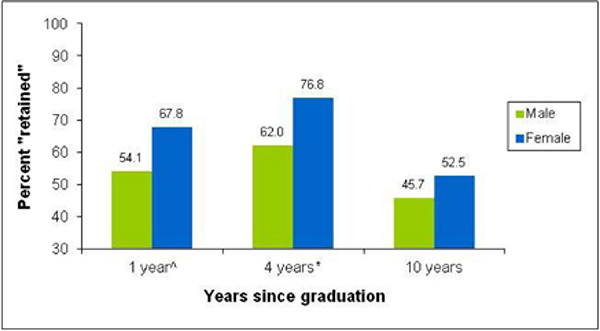
*Difference between the male and female figures is statistically significant at the 5% level.
^Difference between the male and female figures is statistically significant at the 10% level.
Note: The decline in the percent retained from four to ten years after graduation is statistically significant at the 5% level for both males and females.
Employed female bachelor’s degree recipients working in field of major one year after graduation, B&B cohort 1
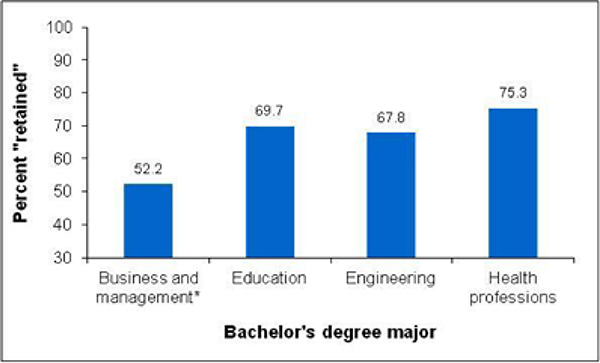
*Difference between this major and engineering major is statistically significant at the 5% level.
Employed female bachelor’s degree recipients working in field of major four years after graduation, B&B cohort 1
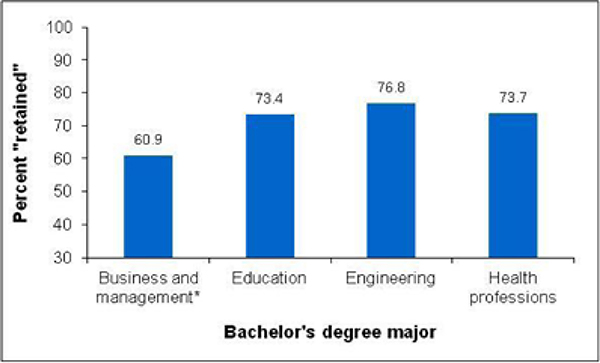
*Difference between this major and engineering major is statistically significant at the 5% level.
Employed female bachelor’s degree recipients working in field of major ten years after graduation, B&B cohort 1
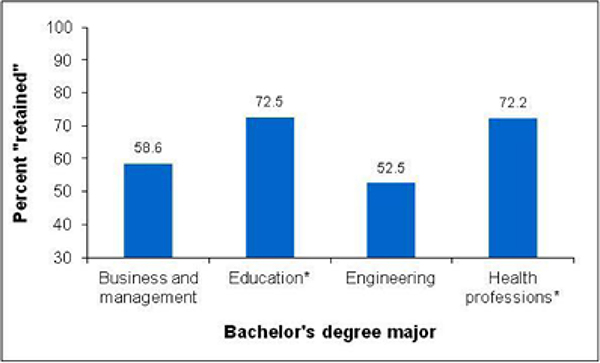
*Difference between this major and engineering major is statistically significant at the 5% level.
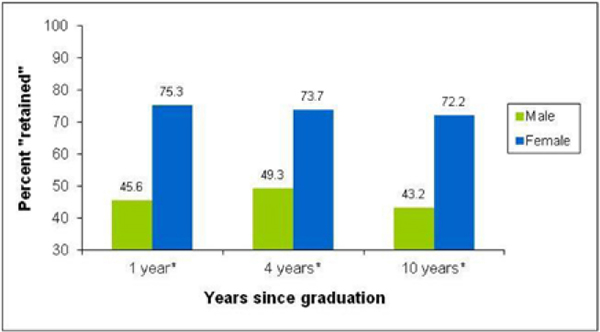
Employed female bachelor’s degree recipients working in field of major one year after graduation, by B&B cohort
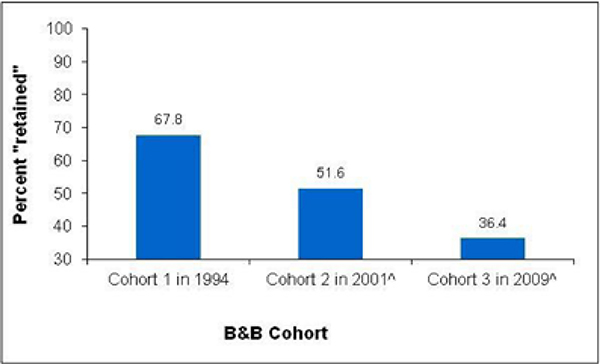
^Difference between this and prior cohort is statistically significant at the 10% level.
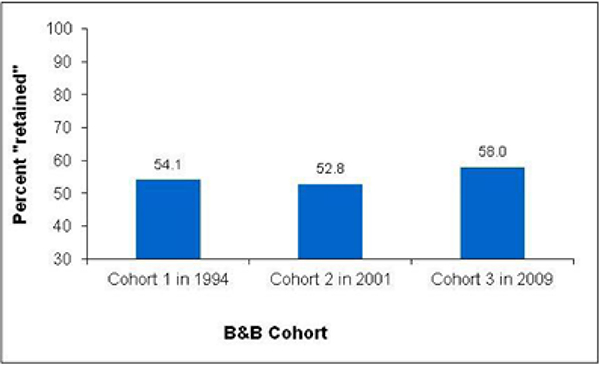
Employed male bachelor’s degree recipients working in field of major one year after graduation, by B&B cohort
Cohort 3 engineering majors were asked for the primary reason for working outside their degree field
|
Females
|
Males
|
Retention summary of findings
![]() For Cohort 1, the retention rate at each post- graduation follow-up is higher for female engineering bachelor’s degree recipients than male engineering bachelor’s degree recipients, although the difference is not statistically significant ten years after graduation
For Cohort 1, the retention rate at each post- graduation follow-up is higher for female engineering bachelor’s degree recipients than male engineering bachelor’s degree recipients, although the difference is not statistically significant ten years after graduation
![]() Moreover, for both males and females, there is a statistically significant decline in retention rates between four and ten years after graduation
Moreover, for both males and females, there is a statistically significant decline in retention rates between four and ten years after graduation
Retention summary of findings
![]() Until ten years after graduation, the retention rate for female engineering bachelor’s degree recipients is similar to the rates for education and health- related majors (and higher than that for management/business majors)
Until ten years after graduation, the retention rate for female engineering bachelor’s degree recipients is similar to the rates for education and health- related majors (and higher than that for management/business majors)
![]() However, by ten years after graduation, the retention rate for female engineering bachelor’s degree recipients is significantly lower than the rates for education and health-related majors (and comparable to that for management/business majors)
However, by ten years after graduation, the retention rate for female engineering bachelor’s degree recipients is significantly lower than the rates for education and health-related majors (and comparable to that for management/business majors)
Retention summary of findings
![]() Across cohorts, the percent of female engineering bachelor’s degree recipients “retained” has fallen significantly from one cohort to the next
Across cohorts, the percent of female engineering bachelor’s degree recipients “retained” has fallen significantly from one cohort to the next
![]() The decline in the retention rate is more than 30 percentage points between Cohort 1 in 1 994 and Cohort 3 in 2009
The decline in the retention rate is more than 30 percentage points between Cohort 1 in 1 994 and Cohort 3 in 2009
![]() This same pattern of decline is not seen for male engineering bachelor’s degree recipients, although both males and females in Cohort 3 report that the primary reason for working outside their degree field is because a job in their field was not available
This same pattern of decline is not seen for male engineering bachelor’s degree recipients, although both males and females in Cohort 3 report that the primary reason for working outside their degree field is because a job in their field was not available
Results of analysis
Multiple regression results
Logistic regression
![]() Logistic regression is used when the outcome examined is categorical (e.g., yes/no; high/medium/low)
Logistic regression is used when the outcome examined is categorical (e.g., yes/no; high/medium/low)
![]() Model predicts the likelihood of an outcome based on a series of explanatory or predictor variables
Model predicts the likelihood of an outcome based on a series of explanatory or predictor variables
![]() Here two outcomes are modeled for Cohort 1:
Here two outcomes are modeled for Cohort 1:
![]() Likelihood that a graduate is participating in the labor force (“participation”)
Likelihood that a graduate is participating in the labor force (“participation”)
![]() Likelihood that a graduate is working in the field of their major (“retention”)
Likelihood that a graduate is working in the field of their major (“retention”)
Predictors considered
![]() Gender
Gender
![]() Age at graduation
Age at graduation
![]() Ethnicity
Ethnicity
![]() Undergraduate GPA
Undergraduate GPA
![]() Undergraduate degree specialty/sub-field
Undergraduate degree specialty/sub-field
![]() Undergraduate debt
Undergraduate debt
![]() Undergraduate Carntegie code
Undergraduate Carntegie code
![]() Parental education
Parental education
![]() Marital status
Marital status
![]() Parental status
Parental status
![]() Citizenship status
Citizenship status
![]() Spousal employment
Spousal employment
![]() Spousal income
Spousal income
![]() Graduate degree
Graduate degree
![]() Enrollment status
Enrollment status
Not alt predictors are included in the final set of models
Characteristics of engineering bachelor’s degree recipients, B&B Cohort 1
| Male | Female | ||
| Age at graduation | Average | 24.3 | 23.6 |
| Ethnicity | Minority(%) | 19.5 | 26.1 |
| Undergraduate GPA | Average | 2.97 | 3.12 |
| Undergraduate debt | graduate with debt(%) | 52.8 | 60.0 |
| Average debt($) | 10,583 | 10,534 | |
| Parental education | High school or less | 23.5 | 23.5 |
| Post-secondary but less taen Bachelor’ degree | 17.3 | 29.3 | |
| Bachelor’s degree | 29.8 | 19.1! | |
| Advanced degree | 29.5 | 28.1 | |
! Interpret data with caution because the standard error represent more than 30 percent of the estimate.
Characteristics of engineering bachelor’s degree recipients, B&B Cohort 1
| Years since graduation | |||||||
| 1 year | 4 year | 10 year | |||||
| Male | Female | Male | Female | Male | Female | ||
| Marital status | Married(%) | 28.6 | 29.3 | 47.4 | 51.3 | 75.0 | 77.7 |
| *Parental status | Has children (%) | 11.9 | 7.0! | 19.9 | 17.0! | 53.5 | 65.3 |
| Spousal employment | Employed (%) | 89.6 | ‡ | 80.4 | 87.0 | 66.7 | 96.5 |
| Spousal income | Average($) | 16,470 | ‡ | 26,822 | 31,477 | 28,274 | 66,655 |
| Graduate degree | Has graduate degree (%) | 3.6 | 2.1 | 17.5 | 20.2 | 26.9 | 27.7 |
| Has graduate degree in engineering, match, or computer since (%) | 2.9 | 1.1 !! | 14.4 | 16.7 ! | 15.3 | 18.0 ! | |
| Enrolled in school | Enrolled in school (%) | 20.8 | 23.7 | 18.7 | 15.2 ! | 7.4 | 8.1 !! |
! Interpret data with caution because the standard error represents more than 30 percent of the estimate.
!! Interpret data with caution because the standard error represents more than 50 percent of the estimate.
* For 10 year survey, figure includes only dependent children under the age of 18.
‡ Reporting standards not met.
Interpreting regression results
![]() If “P” is the probability that a graduate is in the labor force (or working in the field of their major), then the odds of the graduate being in the labor force are P/(l-P)
If “P” is the probability that a graduate is in the labor force (or working in the field of their major), then the odds of the graduate being in the labor force are P/(l-P)
![]() E.g., if P = .75, then the odds are .75/.25 = 3
E.g., if P = .75, then the odds are .75/.25 = 3
![]() Results from these logistic regression models illustrate how a change in a predictor variable changes the odds of a graduate being in the labor force (or working in the field of their major), holding constant all other predictors in the model
Results from these logistic regression models illustrate how a change in a predictor variable changes the odds of a graduate being in the labor force (or working in the field of their major), holding constant all other predictors in the model
Key models examined
| Models | ||||||||||
|---|---|---|---|---|---|---|---|---|---|---|
| Outcome | Study population | 1 year after graduation | 4 year after graduation | 10 year after graduation | ||||||
| Males | Females | Males & Females | Males | Females | Males & Females | Males | Females | Males & Females | ||
| Participation | Engineering graduates | Too few males not in LF | Too few female grades | Too few males not in LF | Too few males not in LF | Too few female grades | Too few males not in LF | Too few males not in LF | Too few female grades | Too few males not in LF |
| Engineering & other career-oriented graduates | ■ | ■ | ■ | ■ | ■ | ■ | ■ | ■ | ■ | |
| Retention | Engineering graduates | ■ | Too few female grades | ■ | ■ | Too few female grades | ■ | ■ | Too few female grades | ■ |
| Engineering & other career-oriented graduates | N/A | N/A | N/A | N/A | N/A | N/A | N/A | N/A | N/A | |
Participation model: Female engineering and other career-oriented graduates, Cohort 1
| A blank cell indicates that the predictor was not included in the model. A cell highlighted green indicates that the variable is statistically significant at the 10% level. Only a subset of predictors included in the model are shown in the table. | Years since graduation | ||
| 1 year | 4 year | 10 year | |
| Percentage difference in odds ratio | Percentage difference in odds ratio | Percentage difference in odds ratio | |
| Age when received bachelor's degree | 3% | 4% | -1% |
| White, non-Hispanic (vs. minority) | 148% | 12% | -34% |
| Has children (vs. no children) | -67% | -73% | -74% |
| Married (vs. not married) | 19% | ||
| Married with spouce not employed (vs. not married) | -40% | -36% | |
| Spouce income from work < $50,000 (vs. not married) | 18% | -30% | |
| Spouce income from work ≥ $50,000 (vs. not married) | -50% | ||
| Spouce income from work ≥ $50,000-$100,000 (vs. not married) | -83% | ||
| Spouce income from work ≥ $100,000 (vs. not married) | -93% | ||
| Incurred debt in undergrad (vs. no debt) | 107% | 51% | -10% |
| Undergraduate GPA is 3.0-3.5 (vs. < 3.0 GPA) | -21% | 66% | 9% |
| Undergraduate GPA is 3.5 or higher (vs. < 3.0 GPA) | -19% | 7% | 12% |
| Business and management (vs. engineering) | 154% | 73% | -26% |
| Education (vs. engineering) | 60% | 37% | -74% |
| Health professions (vs. engineering) | 47% | 82% | -34% |
| Enrolled (vs. not enrolled) | -89% | -61% | 90% |
| Has graduate degree (vs. no graduate degree) | -44% | -8% | 155% |
Participation model: Key findings
![]() Women engineering graduates are generally no more or less likely to be participating in the labor force than graduates in other career-oriented majors
Women engineering graduates are generally no more or less likely to be participating in the labor force than graduates in other career-oriented majors
![]() Women graduates in engineering and other career-oriented majors:
Women graduates in engineering and other career-oriented majors:
![]() Are less likely to be in the labor force if they have children
Are less likely to be in the labor force if they have children
![]() Are less likely to be in the labor force four years and ten years after graduation if their spouse’s income is relatively high
Are less likely to be in the labor force four years and ten years after graduation if their spouse’s income is relatively high
Participation model: Key findings
![]() Women graduates in engineering and other career-oriented majors:
Women graduates in engineering and other career-oriented majors:
![]() Are more likely to be in the labor force one year and four years after graduation if they incurred debt in college
Are more likely to be in the labor force one year and four years after graduation if they incurred debt in college
![]() Are less likely to be in the labor force one year and four years after graduation if they are enrolled in school, but are more likely ten years after graduation
Are less likely to be in the labor force one year and four years after graduation if they are enrolled in school, but are more likely ten years after graduation
![]() Are more likely to be in the labor force ten years after graduation if they have a graduate degree
Are more likely to be in the labor force ten years after graduation if they have a graduate degree
Retention model: Employed male and female engineering graduates, Cohort 1
| A blank cell indicates that the predictor was not included in the model. A cell highlighted green indicates that the variable is statistically significant at the 10% level. Only a subset of predictors included in the model are shown in the table. | Years since graduation | ||
| 1 year | 4 year | 10 year | |
| Percentage difference in odds ratio | Percentage difference in odds ratio | Percentage difference in odds ratio | |
|---|---|---|---|
| Age when received bachelor's degree | 1% | -1% | -3% |
| White, non-Hispanic (vs. minority) | 87% | 12% | 26% |
| Has children (vs. no children) | -8% | -13% | 19% |
| Married with spouce employed (vs. married) | 43% | 17% | |
| Married with spouce not employed (vs. unmarried) | 16% | 30% | |
| Incurred debt in undergrad (vs. no debt) | 10% | -6% | -4% |
| Undergrad GPA is 3.0-3.5 (vs. < 3.0 GPA) | 30% | 47% | 47% |
| Undergrad GPA is 3.5 or higher (vs. < 3.0 GPA) | 128% | 35% | 76% |
| Enrolled (vs. not enrolled) | -64% | -31% | |
| Graduate degree in engr/math/cs (vs. no graduate degree) | -12% | ||
| Graduate degree in other FOS (vs. no graduate degree) | -81% | ||
| Female (vs. male) | 88% | 93% | 47% |
Retention model: Key findings
![]() Employed female engineering graduates are not retained in the field of engineering at lower rates than male engineering graduates
Employed female engineering graduates are not retained in the field of engineering at lower rates than male engineering graduates
![]() In fact, female engineering graduates are more likely than male graduates to be working in the field of engineering four years after graduation
In fact, female engineering graduates are more likely than male graduates to be working in the field of engineering four years after graduation
Retention model: Key findings
![]() Employed male and female engineering graduates:
Employed male and female engineering graduates:
![]() Are more likely to be working in the field of engineering one year and ten years after graduation if their undergraduate GPA was 3.5 +
Are more likely to be working in the field of engineering one year and ten years after graduation if their undergraduate GPA was 3.5 +
![]() Are less likely to be working in the field of engineering ten years after graduation if they have a graduate degree in a non-engineering field
Are less likely to be working in the field of engineering ten years after graduation if they have a graduate degree in a non-engineering field
Implications
Implications
![]() It’s not about participation in the labor force
It’s not about participation in the labor force
![]() Female engineering graduates in all three cohorts are participating in the labor force at high rates
Female engineering graduates in all three cohorts are participating in the labor force at high rates
![]() Retention in engineering appears to be an issue for both male and female graduates
Retention in engineering appears to be an issue for both male and female graduates
![]() Retention for male and female Cohort 1 graduates fell to around 50% by ten years after graduation
Retention for male and female Cohort 1 graduates fell to around 50% by ten years after graduation
![]() Male and female Cohort 3 graduates say that the primary reason for working outside engineering is a lock of jobs in their field
Male and female Cohort 3 graduates say that the primary reason for working outside engineering is a lock of jobs in their field
Implications
![]() The retention issue appears to be worsening for women
The retention issue appears to be worsening for women
![]() The one-year retention rate for female graduates has fallen dramatically from one cohort to the next (more than 30 percentage points between Cohort 1 in 1994 and Cohort 3 in 2009)
The one-year retention rate for female graduates has fallen dramatically from one cohort to the next (more than 30 percentage points between Cohort 1 in 1994 and Cohort 3 in 2009)
Appendix
LFPR by gender for business/management bachelor’s degree recipients, B&B Cohort 1
*Difference is statistically significant at the 5% level.
LFPR by gender for education bachelor’s degree recipients, B&B Cohort 1
*Difference is statistically significant at the 5% level.
LFPR by gender for health-related bachelor’s degree recipients, B&B Cohort 1
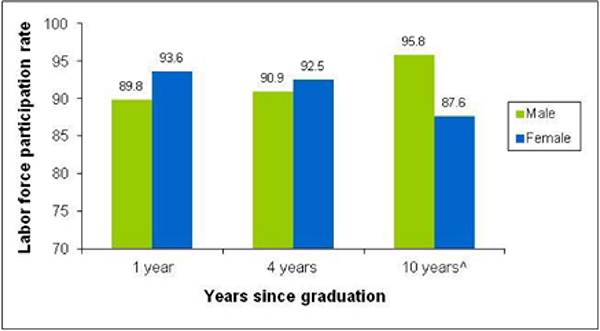
^Difference is statistically significant at the 10% level.
Employed bus/mgmt bachelor’s degree recipients in a bus/mgmt occupation, B&B cohort 1
*Difference between the mole and female figures is statistically significant at the 5% level.
Employed education bachelor’s degree recipients in an education occupation, B&B cohort 1
*Difference between the male and female figures is statistically significant at the 5% level.
Employed health-related bachelor’s degree recipients in a health occupation, B&B cohort 1
*Difference between the male and female figures is statistically signifiant at the 5% level.
B&B majors and their sub-fields*
|
Engineering
|
Business/management
|
*As reported in variable list for B&B Cohort 1.
B&B majors and their sub-fields*
|
Education
|
Health**
|
*As reported) in variable list for B&B Cohort 1.
**Due to the large number of sub-fields in Health, only a subset are shown.
B&B occupational categories*
![]() Engineering/architecture
Engineering/architecture
![]() Eng, architects, software/sys engineers
Eng, architects, software/sys engineers
![]() Business/management
Business/management
![]() Business/financial support services
Business/financial support services
![]() Financial services professionals
Financial services professionals
![]() Executive manager
Executive manager
![]() Midlevel manager
Midlevel manager
![]() Supervisory, office, and other admin
Supervisory, office, and other admin
![]() Business - other
Business - other
![]() Managers - other
Managers - other
*As reported in variable list for B&B Cohort 1.
B&B occupational categories*
![]() Education
Education
![]() K- 12 teachers
K- 12 teachers
![]() Instructors other than K- 12
Instructors other than K- 12
![]() Education - other
Education - other
![]() Health (Medical professionals)
Health (Medical professionals)
![]() Medical practice professional
Medical practice professional
![]() Medical licensed professional
Medical licensed professional
![]() Medical services
Medical services
![]() Medical - other
Medical - other
*As reported in variable list for B&B Cohort 1.


