
Resource Distribution and Global Inequality
The session on Resource Distribution and Global Inequality was chaired by steering committee member B.L. Turner II (Arizona State University), with presentations by Branko Milanović (World Bank), Parfait Eloundou-Enyegue (Cornell University), and Wolfgang Lutz (International Institute for Applied Systems Analysis). Their presentations and the ensuing discussion are summarized below.
GLOBAL INCOME INEQUALITY: HISTORICAL TRENDS AND POLICY IMPLICATIONS FOR THE FUTURE
Branko Milanović, Lead Economist, World Bank
Branko Milanović explained that he would talk about inequality, both global (among countries) and within single countries. To measure inequality, Milanović used data from the International Comparison Program, which is a large undertaking that assesses purchasing power in different nations.1 While details of this project’s results are subject to debate, he said, the project provides a comparison of prices across nations that can be used as a baseline metric. The International Comparison Program developed a price index normalized to the United States, in which a score
__________________
1For more information about the International Comparison Program, see http://go.worldbank.org/X3R0INNH80 [February 2014].
of 1 indicates purchasing power equivalent to that of the United States. China rated 0.4, meaning that goods and services in China cost 40 percent of what they cost in the United States. Norway rated 1.3, or 130 percent of the United States’ costs. The International Comparison Project index can be used to normalize the per capita income of each nation.
Milanović defined three different concepts of inequality (Milanović, 2005):
- Concept 1: The mean per-capita income for each country is compared to the others. This disregards the overall population size of the nation and merely looks at the mean income value. Economists commonly use this metric to discuss income convergence.
- Concept 2: The mean per-capita income is used, but the statistics are weighted by each nation’s population. In other words, every person is counted, but each is “assigned” the mean income for his or her nation.
- Concept 3: Comparisons are made using each person’s individual income, without linkage to the national average. In this case, there is much more variation. Milanovi stated that in this concept, it becomes clear that there is little overlap between the income distribution of a wealthy nation and that of a poor nation—poor people from a rich country are still relatively rich overall. For instance, the mean poverty line globally is $1.25 per day, but in the United States the mean poverty line is $14–15 per day; this amount is equal to the 75th percentile of world income distribution.
Milanović then presented data showing how these different inequality concept measurements have changed in time, shown in Figure 6-1, where the inequality measure is expressed as a Gini coefficient.2 Under Concept 1, income has diverged, particularly in the period of globalization from 1980–2000. He explained that, in those two decades, Africa and Latin America experienced a net loss of growth. Most of the factors during globalization were working in favor of global inequality. Richer nations and China, however, fared very well. The data for Concept 2, Milanović explained, are driven by China, which brings the overall inequality measure down. China is contradictory, however; while its growth was the sole factor driving down global inequality, it was also experiencing an internal increase in inequality. In other words, China’s increasing population and increasing average income contributed to lower global Gini coefficients under Concept 2. However, the Gini coefficient within China was
__________________
2The Gini coefficient is a statistical measure of inequality, represented as a measure between 0 (complete equality) and 1 (complete inequality).
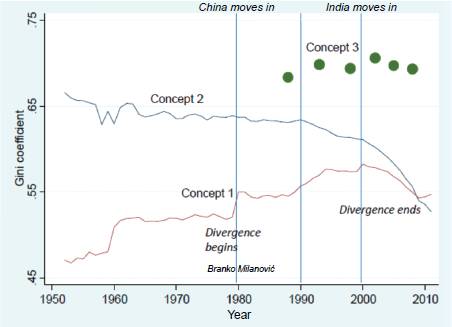
FIGURE 6-1 Inequality, measured by the Gini coefficient, as a function of time for three different inequality concepts.
NOTES: Concept 1 calculates the Gini coefficient using mean per-capita income for each nation, compared against the others. Concept 2 uses mean per-capita income, weighted by each nation’s population. Concept 3 uses individual income data. Concept 3 is represented by a small set of discrete dots because survey results on individual income are not consistently available across time and nations. As poorer nations typically do not provide survey results as often as developed nations, the data for Concept 3 should be considered a lower bound estimate.
SOURCE: Milanović presentation, slide 3.
increasing for that same time period. In 2000, India also began a period of development, bringing the Concept 2 measure of inequality down even further. In contrast to the first two measures, the data for Concept 3 are fairly level; the increase in inequality among the other nations offsets the growth of China and India.
Milanović showed that the final Concept 3 “dot” in Figure 6-1 declines slightly, by about a total of one Gini point. While this is a small fraction of the total (1 point in 70), such a decline would be a historic and positive development. The Concept 3 measure of inequality rose from around 50 in the year 1820 to around 70 in 1960, where it has remained since. Reversing this curve would be a huge evolution in the international measures of inequality.
Milanović explained that the pattern of global inequality change differs from patterns of national inequality changes. In the past, the greatest inequality has been within nations (for example, a country with rich nobility and poor peasants), with the average ratio of inequality within a nation 4:1. However, inequality is now mostly disparate among nations. Today, income is largely determined by where an individual lives, in that 70 percent of income variability is based on global rather than national inequalities. This shift is largely the result of increasing population sizes in Southeast Asia, notably China and India. Milanović noted that one could look at inequality of carbon emissions as well: Because consumption patterns vary by income level, it should be possible to assess overall emission concentrations by measuring income levels in different areas.
A participant asked Milanović if the ideal situation would be one in which everyone in the world would have the same income, and therefore there would be no inequality. He replied the Gini coefficient is a measurement tool, and he attempted to present the measurements in a neutral way, without giving opinions. The ideal Gini coefficient is more a philosophical or political issue, not a demographic one, he explained.
POPULATION-INEQUALITY-SUSTAINABILITY: BEYOND IPAT
Parfait Eloundou-Enyegue, Professor,
Department of Development Psychology, Cornell University
Parfait Eloundou-Enyegue began his presentation by stating that the options for a 10-billion-person planet in the classic population-sustainability debate have usually been taken to one of two extremes: an apocalypse scenario (the Cassandra viewpoint) or a blissful scenario (the Pollyanna or Cornucopian viewpoint). He proposed searching for middle-ground options. He referred to one option suggested in a previous session, when it was stated the entire population of 10 billion could live in the state of Texas if humans lived more simply. In other words, the entire world population could survive but not thrive. Another scenario, which Eloundou-Enyegue pursued, was that consequences could be highly differentiated: apocalypse for some, bliss for others. He posited that in 2050, there may be significantly more competition and inequality. In that perspective, greater attention should be paid to inequality and to a framework that goes beyond the classic impact, population, affluence, and technology (IPAT) model.
Eloundou-Enyegue then discussed the limitations and restrictions of the commonly used IPAT model. (See the summary of Turner’s presentation in Chapter 2 for an introduction to IPAT.) While IPAT is a useful tool,
Eloundou-Enyegue argued that its utility is somewhat narrow, for the following reasons:
- IPAT restricts sustainability to its environmental dimension, and does not include other socioeconomic factors.
- IPAT is restricted to population growth, and does not consider demographic distinctions such as age, fertility, or family structure.
- IPAT focuses attention mostly to high fertility countries.
- IPAT’s main rationale is Malthusian.
He proposed a new conceptual framework for thinking about sustainability, which he referred to as PIES (for Population-Inequality-Environmental and Economic Sustainability). He explained that PIES has three basic tenets:
- There is more to population than size. In other words, factors such as the population’s age distribution, differential fertility behavior, and family structure and formation are also important to model.
- Sustainability goes beyond just environmental factors, and includes socioeconomic factors as well.
- Global inequality is a mediator of population effects.
Eloundou-Enyegue pointed out that the PIES model contains nothing new, but is a different way to assemble the pieces. In the IPAT framework, he said, attention is focused primarily on the poor high-fertility nations, as they contribute the most to the population variable. He characterized this as a politically sensitive issue, as IPAT can “blame” the poorer nations for unsustainable practices. Under the PIES model, population concerns extend to all nations, although the issues facing each one are different. Central to the PIES model is the importance of population distribution, and connecting population inequality and sustainability. Eloundou-Enyegue represented problematic situations in population, consumption, or equality as a triangle; the large base of the triangle represents the population concentrated in adverse conditions.
Eloundou-Enyegue then turned to the challenge of measuring global inequality. It is difficult for people to recognize signs of inequality except in the simplest of circumstances. Often it can be difficult to distinguish inequality from other related concepts such as inequity, mobility, justice, difference, and stratification. It can also be challenging to identify the appropriate comparison group—whether to compare with one’s neighbors, age group, compatriots, co-workers, or the world. Eloundou-Enyegue also explained there are many types of inequality, such as income vs. outcomes, differentials vs. inequality, inequality vs. inequity
(endowments and rewards), inequality vs. mobility, local vs. global, actual vs. perceived, gross vs. net, and current vs. lifetime income inequality. He used actual vs. perceived inequality as an example by asking which would be better: a situation with a lot of inequality but no one was aware of it, or a situation with little inequality but it is felt more acutely. He suggested that while between-nation inequality tends to be larger in size, within-nation inequality is perceived more acutely by its citizens.
Eloundou-Enyegue identified two components when computing inequality: income (relative differences in income across groups being compared) and demographics (relative size of groups). Decomposing inequality into these two components can reveal what has driven historical trends.
Eloundou-Enyegue then briefly discussed trends and prospects in global inequality. He said that a major trend in global inequality is a “turning inward,” or involution, which is a simultaneous decline in nation-to-nation inequality and increase in within-nation inequality. Given the greater salience of within-country inequality for most people, this pattern is likely to lead to a decrease in global well-being. Eloundou-Enyegue briefly touched on Kuznets’s (1955) thesis, which stated that there is an inverted U-curve between per capita income and inequality. Kuznets’s assumptions of inequality may no longer hold, Eloundou-Enyegue said, as there is now an increase observed in internal inequality across the world and a decrease in social mobility.
Eloundou-Enyegue then turned to the consequences of global inequality, asking if countries with greater inequality also have greater levels of consumption. He postulated that countries with more inequality tend toward poor stewardship and less interest in preserving the natural environment. However, they also tend to have less to consume. He also asked if countries with greater inequality have greater socioeconomic instability. Citing work done in 2011, Eloundou-Enyegue stated that health and social problems increase with increasing income inequality (Ortiz and Cummins, 2011).
In the final section of his talk, Eloundou-Enyegue discussed the demographic causes of inequality. In examining current population trends in global inequality, he looked at a number of possible factors. Between countries, he examined relative population growth, age structure, and migration and remittances. Age structure proved to be the largest contributor to inequality. Within countries in high-fertility settings, he examined differential fertility, fosterage, and teen pregnancy. Among those variables, differential fertility was the greatest contributing factor to inequality; there were significant differences between birth rates in the upper quintile and lowest quintile. In low-fertility settings, he examined
increased homogamy and family formation. There, marriage rates and premarital fertility rates were the largest contributing factors.
Eloundou-Enyegue pointed out that in the classic IPAT decomposition, GNP per capita and the relative size of a country’s population are the variables considered. However, overall population is not a significant variable, representing only about 1.5 percent of the contribution to global trends in between-country inequality between 1980 and 2010. This is not a surprising result, he commented, as the relative size of any given country does not tend to change much over time. Eloundou-Enyegue said in an expanded decomposition of the trends in global between-country inequality (one that includes variables such the adult per capita income, age structure, and country size), international differences in age structure turn out to be crucial. Economic trends and performance still account for most of the inequality, but a population’s age structure plays a larger role than generally acknowledged. The IPAT model and Malthusian principles emphasize population size and growth, but he argued that demographic distribution matters more.
Eloundou-Enyegue said inequality trends are likely to continue, and social capital, family trends, and the life chances of children born to diverse circumstances are profoundly different. Also, increasing differences in premarital fertility, as well as an increasing tendency to marry as one’s educational level increases, will also lead to greater inequality.
Eloundou-Enyegue concluded by noting that previous conversations about population and sustainability, framed by the IPAT model, reduce the population variable too much by exclusively focusing on size or growth. The PIES model is a broader framework that allows for an expanded analysis. Returning to his introductory point about the two extremes for the 10-billion-person scenario, he said that the likely scenario is that the future will be a cornucopia for a few and a disaster for many. It is a matter of policy to determine what happens, he suggested.
Wolfgang Lutz, Program Director, World Population,
International Institute for Applied Systems Analysis
Wolfgang Lutz began his presentation by commenting that intergenerational justice is a hard concept to operationalize. A focus on intergenerational trade-offs rather than on justice could be easier, but it is still difficult because the preferences of unborn generations remain unknown. It is more pragmatic to focus on trade-offs between different age cohorts
already alive. In all these cases, conventional economics is not helpful. Instead, Lutz said that there should be a metric for well-being that is consistent for people who have lived at different points in history—a figure of merit that is equally valued across time. This figure of merit should incorporate aggregate indicators of well-being, which for sustainable development would not decline over time or for any subpopulation. The figure of merit should also include the depletion of natural stock and how that depletion feeds back to the future well-being of humankind. A simple metric to use is that of survival and avoiding premature death—as he pointed out, all people agree that staying alive (in good health) is a good thing. Another option for a figure of merit is the Human Development Index,3 which also includes education and material standard of living and thus broadens the choices people have beyond simply survival (United Nations, 2013).
Lutz then introduced the concept of demographic metabolism, which models how societies change through intergenerational replacement. It can be used to model the future composition of a population according to relevant characteristics that persist over life (such as higher level of education, certain opinions, and identity). These cohort effects are in addition to age effects (changes that everyone experiences as a function of age) that can also be modeled. Demographic metabolism, therefore, can be seen as a predictive theory of socioeconomic change. It was originally introduced as a concept by Ryder (1965) but not operationalized until more recently. Demographic metabolism provides a useful analytical handle to understand intergenerational trade-offs by focusing on stable characteristics, and it can be used to forecast information about populations into the future. Lutz illustrated demographic metabolism with the example of the changing educational attainment distribution in South Korea. In South Korea in 1985, a significant part of the population was uneducated, but these people tended to be in the older age categories. In addition, within the older population, many more women than men were uneducated. Because of South Korea’s increase in its education policies in the 1950s, the 1985 demographic data show that few people (men or women) under the age of 35 remained uneducated. Lutz presented South Korea’s demographic and education data from 1985 through 2010, which clearly demonstrated demographic metabolism: As time progressed, the uneducated older people were replaced with the more educated next generation. In addition, as educational levels increased, fertility decreased, and fewer
__________________
3The Human Development Index is a single composite metric that combines indicators of life expectancy, educational attainment, and income to measure development (United Nations Development Reports, see http://hdr.undp.org/en/statistics/hdi [February 2014]).
people were born into successive generations. Using this information, one can project future populations and their education levels.
Lutz said that at the global level, the most profound differential across societies is the average level of a mother’s education; an increase in education contributes more than income or any other variable to the decline of both fertility and infant mortality. He cited a Science article (Lutz and Samir, 2011) that discusses maternal education and population, and cited evidence with respect to the causality between increased maternal education and slower population growth. He stressed that education is not merely a proxy for socioeconomic status; there is strong evidence that it has direct functional causality. There is also evidence to support a linkage between maternal education and poverty reduction in Latin American countries. Figure 6-2 shows the population fraction living in poverty in Latin America as a function of the proportion of women with secondary education or greater.
Lutz then explained the scenarios used for the Intergovernmental Panel on Climate Change (IPCC) analysis since 2000.The IPCC Special
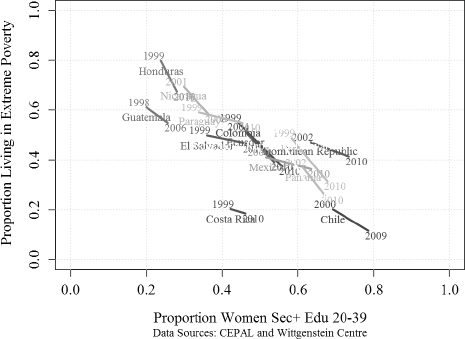
FIGURE 6-2 The population fraction living in poverty in Latin America as a function of the proportion of women with secondary education or greater.
NOTE: Each nation is plotted with a different color, showing results across time in the 1998–2010 time frame.
SOURCE: Lutz presentation, slide 22.
Report on Emissions Scenarios (SRES) only included total population size and GDP. In 2013, new shared socioeconomic pathways (SSPs) scenarios were developed. They offer much more social detail and include age, gender, and education in addition to urbanization and GDP. The SSP scenarios are based on the understanding that education is the third most important source of observable population heterogeneity, following age and gender.
Lutz then described population and its interactions with climate change. The human population affects climate change via consumption (energy usage and land use changes) as well as via innovation and technology (solutions for greenhouse gas emissions). He pointed out that much less is known about the effects of climate change on future human well-being, and the most relevant and critical question is to understand how dangerous climate change will be for humankind. While the IPCC reports give detailed information about likely future climate conditions with uncertainty margins, much less is known about the future adaptive capacity of societies to cope with these changes. There is also a differential effect on people and their health and mortality rates, depending upon their demographic characteristics. According to Lutz, a frequent mistake is to match future climate conditions to today’s society and health capabilities; in reality, one must project both into the future.
Lutz then looked at the five SSP scenarios, including population and age- and education-pyramid information for each scenario. (The five SSPs are defined and described in the presentation by James A. Edmonds; see Chapter 4.) Under SSP2 (known as the “business-as-usual” or “middle-of-the-road” scenario), population peaks at 9.4 billion around the year 2070, with an expansion of the higher educated population and a shrinking of the uneducated population. Lutz referred to a Science article (Lutz et al., 2008), in which, based on age specific education data, he and his colleagues showed that the distribution of education within a society is a key driver for economic growth. Furthermore, a more educated population is linked to decreased disaster mortality and increases the population’s adaptive capacity to respond to climate change.
Lutz closed by reiterating the importance of understanding how dangerous climate change is to human well-being. Without an analytic answer to that question, he said it is hard to respond appropriately to the challenges posed by climate change.
During the discussion period, a participant asked if inequality is bad for health—or, alternatively, if there is an absolute poverty level that is bad for health. The participant pointed out that focusing on absolute
poverty levels focuses on the lowest populations. She pointed out that the past few talks have seemingly focused instead on relative outcomes (such as the Gini coefficient) and not absolute levels. Lutz responded by saying that instead of looking for a desired level of inequality, one should focus on desired outcomes across an array of issues (such as education, land use, and income). Inequality can then be assessed in the context of those outcomes, to avoid setting any intrinsic desirable level. Eloundou-Enyegue pointed out that, in a previous discussion, some inequality was suggested as fundamentally good to spur innovation and effort, although others might argue that inequality is on principle a negative characteristic. He broke the idea up into three tiers of thinking. In the first tier, one thinks about the consequences of inequality on humanitarian grounds and concern for the poor. In the next tier, one thinks about matters of economic efficiency. In the third tier, one focuses on status and stress—even the very rich cannot shield themselves from social unrest associated with uncertainty and inequality. Thus, he said, inequality is a concern for everyone at every tier of thinking. Milanović said that inequality does have a precise definition, such as the Gini coefficient. He pointed out that Wilkinson and Pickett (2009) found a strong correlation between increasing inequality and other negative outcomes, such as increased health and mortality rates. The danger with the Gini coefficient approach, he suggested, is that it focuses entirely within national borders, and in so doing equates a rich American with a rich African and a poor American with a poor African, when in reality those populations are not at all the same.
A participant asked the speakers to draw links between the current and future intergenerational inequality, in terms of human capital, natural capital, and other capabilities. Lutz said the first step is to find one broad metric by which to assess whether intergenerational inequality is improving. He said currently the best metric is survival (life expectancy at birth), as it is universally accepted, but a more meaningful and direct metric may exist. Eloundou-Enyegue suggested a look at current patterns. Unequal societies today are likely to bifurcate further—some in the population will have the incentive to reduce fertility rates, while others will invest in larger families. The inequality of the two groups will continue to drift even further apart. The risk is that this pattern will continue indefinitely. Milanović said that migration is a tool that has the potential to significantly reduce inequality. Currently, about 3 percent of the population migrates, but 8 percent of the population would like to do so; thus, he said, there is a pent-up demand for migration.
A participant asked about the probability of escaping the lowest quintile of income—in other words, the likelihood of rising out of poverty. The participant stated that the current data in the United States vary by city; in cities such as New York and Boston, one has a 12 percent chance of
leaving poverty. In Atlanta, the chance drops to 4 percent. The participant asked if absolute inequality is the only metric or if another metric can measure social mobility. Milanović responded that data on intergenerational mobility show a correlation between current inequality and lack of mobility. This is particularly true in the United States, where there is high inequality and low intergenerational mobility. Milanović said the correlation between parent and child income is quite high, around 0.5. In European countries, the number is closer to 0.3. He stated that the lack of social mobility in the United States conflicts with Americans’ self-perception; they believe their children have the opportunity to move up quickly in the world (known as the “Great Gatsby curve”). Eloundou-Enyegue said that mobility in the United States has been structural in nature—that new “slots” in the middle class have opened up in addition to merely replacing someone in the middle class. If these opportunities vanish, so does mobility. Lutz pointed out that by far the most important path to upward social mobility is education, and this is true in every country in the world. The Nordic countries have high-quality public education and a correspondingly high level of social mobility. In countries where the best education is private, mobility is significantly lower. Eloundou-Enyegue countered that only so much inequality can be addressed by education alone, however, and there needs to be concerted cultivation—a deliberate attempt to invest in children beyond the classroom. Milanović noted, for example, that the average family income for a student attending Harvard University is in the second highest percentile of average American income—yet another indicator of lack of mobility.


