
3
Program Outcomes—Quantitative Assessment
This chapter utilizes available data from DoD and from the NRC Award Recipient Survey of DoD SBIR winners to analyze outcomes related to the Congressional mandate described in Chapter 1, as well as counterfactuals based on responses to the survey. It also provides insights into program operations drawing in particular on company comments provided through the survey.
THE FOCUS ON COMMERCIALIZATION OUTCOMES
Although the statutory goals of the SBIR program are fourfold, subsequent legislation passed by Congress, as well as administrative policies pursued by DoD and the agencies, focus mainly on the commercialization of SBIR technologies.1 Moreover, given that commercialization is among the more measurable outcomes of the SBIR program, it has become the benchmark for program performance. The focus on commercialization, however, should not be allowed to obscure the fact that the program is designed to meet all four Congressionally mandated objectives. This chapter provides an update of the commercial outcomes of the DoD SBIR program, as well as outcome measures related to meeting agency mission, expanding the US science and engineering base, and increasing the participation of women and minorities.
SOURCES OF DATA
To develop an effective quantitative analysis of the outputs of the DoD SBIR program, we have drawn on data from the Department of Defense (DoD). We have also drawn from responses to a large-scale survey of SBIR recipients at DoD. This 2011 survey is based on the 2005 survey deployed by the National
__________________
1SBA Section 1.(c) SBIR Policy Directive, October 18, 2012, p. 3.
Research Council (NRC), with some additions and modifications.2 This 2011 survey was sent to two distinct populations: all principal investigators who received DoD Phase II SBIR awards between fiscal year (FY) 1999 and FY2008 inclusive; and all principal investigators who received a Phase I SBIR award and whose company did not receive a Phase II award during the same period. Results from this survey provide the quantitative foundation for much of the analysis in this chapter. Appendix A provides a detailed description of the survey methodology, including discussion of the response rate and discussions of potential survey bias. The 2011 Survey questionnaire is reproduced in Appendix E.
COMPARISON ANALYSIS
We sought to develop a useful comparison group for the data collected through the 2011 NRC Survey, but encountered substantial difficulties in finding matching firms—similar in their demographics, market orientation, industry sector, age, size etc.—that have not received SBIR funding. We then sought to develop a comparison group from among Phase I awardees that had not received a Phase II award from the three surveyed agencies (DoD, the National Science Foundation, and NASA) during the award period covered by the survey (1999-2008). After considerable review, we concluded that the Phase I-only group was also not appropriate for use as a statistical comparison group. In the interests of providing researchers with a full view of the data collected, Appendix G of this report includes tables showing both the Phase I only and Phase II survey responses for questions where both groups were surveyed.
COMMERCIALIZATION
Several important conceptual challenges emerge when seeking to define “commercialization” for the purposes of the SBIR program. Like many apparently simple concepts, commercialization becomes progressively more difficult and complex as it is subjected to further scrutiny. For example:
- Should commercialization include just sales or other kinds of revenue, such as licensing fees and funding for further development?
- Should commercialization include only sales to DoD or other kinds of sales as well?
- What is the appropriate benchmark for sales? Is it any sales whatsoever, sufficient sales to cover the costs of awards, sales that lead to breaking even on a project, or sales that reflect a commercial level of
_______________
2See National Research Council, An Assessment of the SBIR Program, C.W. Wessner, ed., Washington, DC: The National Academies Press, 2008, Appendix A.
-
success and viability? The latter at least would likely be different for each project in each company.
- Should commercialization include sales by licensees, which may be many multiples of the revenues provided to, but are largely reported by, the licensors?
- Should commercialization metrics focus only on formally recognized Phase III contracts,3 or should they more widely cover follow on sales and development activities across the entire defense sector even where not formally recognized as Phase III?
In practice, these issues resolve in a variety of ways, depending on the DoD component involved.
For the purposes of this study, the committee deployed a broad net to capture a range of potentially useful data. Once acquired, these data can be analyzed in a variety of ways to provide multiple insights into this complex topic.4
Revenues
Perhaps the single most used metric for assessing SBIR-type programs is revenue from sales and licensing fees. In its previous SBIR assessments, the NRC warned extensively against overuse of this metric. Although the committee heeded these warnings by adopting a wide range of metrics for this assessment revenues remain an important consideration.
The 2011 survey excluded data that have been collected about licensee activities in the past. Although these activities can be important, SBIR companies have little information regarding the activities of their licensees, other than those that generated revenue for the companies themselves, which are included in baseline sales and revenue data. Descriptions of licensee activities are also in many cases subject to nondisclosure provisions. Hence, given the limitations of the data provided, it did not seem appropriate to include questions about licensee activities in the updated survey.
Reaching the Market
As summarized in Table 3-1, 46 percent of Phase II projects reported some sales or licensing revenues. In and of itself, this is an important finding, because it shows that a substantial number of projects have been sufficiently successful to the point of generating sales revenues. A further 26 percent of Phase II respondents expected to generate sales in the future—a percentage that
__________________
3“Phase III” is in the context of DoD a technical term for contracts that are officially recognized as following from an SBIR or STTR Phase II award. Not all follow-on contracts are so recorded.
4For an overview of the commercialization metrics and survey used in this study, see Appendix A.
TABLE 3-1 Sales (Percent of respondents)
| DoD SBIR Phase II (Percent) | |
| No sales to date, no sales expected | 28.1 |
| No sales to date, but sales expected | 26.4 |
| Any sales to date | 45.5 |
| 100.0 | |
| N= | 765 |
NOTE: Data collected 2011. Data covers awards 1998-2007 inclusive.
SOURCE: 2011 NRC Survey, Question 35.
in part reflects the relatively recent date of some awards in the sample and the potentially extended timelines needed to reach required Technology Readiness Levels (TRLs) at DoD. These percentages are substantially in line with results from the 2005 NRC survey and from previous analyses of DoD commercialization datasets.5
Amount of Sales and Licensing Revenues
The percentage of projects reaching the market is an important metric, but it is not a sufficient determinant of success. It is important to also understand the distribution of sales. The survey asked respondents who reported sales to also report the amount of sales, grouped into tiers that reflect different levels of revenue. About 30 percent of Phase II respondents with some sales reported sales of $1M or more; and 8 percent respondents reported sales of $5 million or more (see Table 3-2).
TABLE 3-2 Distribution of Total Sales (Includes only companies with at least some sales)
| DoD SBIR Phase II (Percent) | |
| Under $100,000 | 23.4 |
| $100,000-$499,999 | 33.2 |
| $500,000-$999,999 | 13.2 |
| $1,000,000 or more | 30.2 |
| 100.0 | |
| N (companies with sales)= | 325 |
SOURCE: 2011 NRC Survey, Question 36, B1.
______________
5National Research Council, Assessment of the SBIR Program at the Department of Defense, C. W. Wessner, ed., Washington, DC: The National Academies Press, 2009, pp. 89-91.
Markets by Sector
The survey asked respondents about the market sectors in which sales were made. Overall, about 59 percent of sales were made directly to DoD or DoD primes (see Table 3-3).
The low percentage for export sales is also not surprising because DoD work is usually subject to International Traffic in Arms Regulations (ITAR), which restricts the export of defense-related articles and services.
The fact that on average nearly 60 percent of Phase II projects with sales reported sales to DoD or DoD primes suggests that the program is meeting agency needs, particularly because this percentage does not capture sales to other (non-prime) businesses in the defense sector.
Use by Federal Systems or Acquisition Programs
As with previous surveys, respondents were asked whether the funded project was currently in use by a Federal System or Acquisition Program. More than one-fifth of all Phase II respondents report projects whose technology has
TABLE 3-3 Markets for DoD SBIR Products and Services (Percentage of total sales) (Includes only companies with at least some sales)
| Phase II (Percent) | |
| DoD | 37.3 |
| Domestic private sector | 21.4 |
| Primes for DoD | 21.6 |
| Export markets | 4.5 |
| Other federal agencies | 4.1 |
| NASA | 2.4 |
| State or local governments | 1.6 |
| Prime contractor for NASA | 1.3 |
| Agency that awarded the Phase II (if not NASA or DoD) | 0.9 |
| Other (specify) | 5.0 |
| 100.0 | |
| N= | 348 |
NOTE: For this question, each respondent reported a percentage distribution. Values above were calculated by deriving the mean value for all the responses received for each category.
SOURCE: 2011 NRC Survey, Question 37.
been adopted for federal use. 6This is a positive outcome, again underscoring ways in which the SBIR program meets agency needs. These data also reveal a substantial increase from 2007, when respondents reported that 12 percent of Phase II projects were in use in federal systems. This increase may be due to enhanced efforts to connect the SBIR program and acquisitions programs (see Chapter 5).7
Employment
The SBIR program is often cited as a source of direct employment creation, particularly in high-value Science, Technology, Engineering and Mathematics (STEM) occupations. This firm and job growth in turn can support other economic activity, creating a multiplier effect. As with prior surveys, respondents were asked about the size of the company at the time of the award and at the time of the survey, in terms of number of employees.
The data in Table 3-4 show that among Phase II respondents, the most common company size reported was 20 to 49 employees, although awards were made to a wide range of companies by size, reflected in the distribution shown in Table 3-4. The substantial difference between the mean and median is due to outliers, that is, a few companies with large numbers of employees.
Respondents also provided the current number of employees. Although the results may be affected by selection bias toward surviving companies, the comparisons may be useful. The median size for Phase II companies grew from
TABLE 3-4 Employment at Time of Award
| Number of Employees | DoD SBIR Phase II (Percent) |
| Under 5 | 19.0 |
| 5 to 9 | 17.6 |
| 10 to 19 | 16.8 |
| 20 to 49 | 23.7 |
| 50 to 99 | 11.4 |
| 100 or more | 11.5 |
| 100.0 | |
| Mean | 41 |
| Median | 17 |
| N= | 727 |
SOURCE: 2011 NRC Survey, Question 18A.
__________________
62011 NRC Survey, Question 57.
7National Research Council, Assessment of the SBIR Program at the Department of Defense, op. cit., p. 217.
17 to 24 (see Table 3-5). These data are broadly in line with the median employment numbers reported in 2009.8
The percentage of Phase II respondents reporting 100 or more employees also increased—from 11.5 percent of Phase II respondents at the time of award to 15.8 percent at the time of reporting.
The committee concludes that, although they revealed some job growth at many companies, overall the evidence indicates that receiving Phase II awards is not associated with high levels of job growth. It should be noted that employment effects are likely to grow over time and that this analysis does not adjust for the differing elapsed periods between the start of Phase II and the time of the survey.
Further Investment
The ability of SBIR projects and companies to attract further investment has traditionally been an important defining metric for SBIR outcomes.9 According to the survey results, 61 percent of Phase II projects received additional funding (compared to 54 percent in 200910), which again indicates that SBIR funded projects generate sufficient value to persuade non-SBIR sources to invest funds in them (see Table 3-6).
As with prior surveys, the amount of additional funding received from non-SBIR federal sources is considerably skewed (see Table 3-7). Thirty-six percent of Phase II respondents reported receipt of non-SBIR funding of $1 million or more, while about 18 percent reported funding of less than $100,000.
TABLE 3-5 Employment at Time of Reporting
| Number of Employees | DoD SBIR Phase II (Percent) |
| Under 5 | 16.0 |
| 5 to 9 | 14.5 |
| 10 to 19 | 15.2 |
| 20 to 49 | 25.1 |
| 50 to 99 | 13.4 |
| 100 or more | 15.8 |
| Mean | 66 |
| Median | 24 |
| N= | 739 |
SOURCE: 2011 NRC Survey, Question 18B.
__________________
8Ibid, pp. 260-261.
9National Research Council, An Assessment of the SBIR Program, op. cit.
10Ibid, p. 262.
TABLE 3-6 Additional Investment after SBIR Award
| DoD SBIR Phase II (Percent) | |
| Yes | 61.0 |
| No | 39.0 |
| 100.0 | |
| N= | 765 |
SOURCE: 2011 NRC Survey, Question 33.
Phase II respondents, more than half reported funding from their own company and from federal non-SBIR. This is especially important in the DoD context, where further funding from acquisition-related sources is a key metric for a technology-related project’s progress. Other companies were the next most important source, which also has significant meaning in the DoD context, where links to primes may be captured to some degree in this metric. Personal funds accounted for 10.7 percent of responses, and no other sources were mentioned by more than 7 percent of all respondents. Venture funding accounted for only 2.8 percent of all responses (see Table 3-8).
It is worth highlighting a shift in funding sources since 2009, when only 20 percent reported using non-SBIR federal funding, , because it strongly suggests that connections between SBIR projects and other parts of DoD are becoming closer.11
TABLE 3-7 Additional Investments by Non-SBIR Federal Sources by Phase and Amount
| DoD SBIR Phase II (Percent) | |
| Under $100,000 | 17.8 |
| $100,000-$499,999 | 31.2 |
| $500,000-$999,999 | 15.0 |
| $1,000,000 or more | 36.0 |
| 100.0 | |
| N= | 253 |
NOTE: N=Those reporting additional funds >$0. Table excludes companies with no additional investments.
SOURCE: 2011 NRC Survey, Question 34.1.
__________________
11Ibid, p. 263.
TABLE 3-8 Sources of Additional Funding
| Phase II (Percent) | |
| Own company | 54.6 |
| Federal non-SBIR funding | 54.2 |
| Other companies | 16.3 |
| Personal funds | 10.7 |
| State/local government | 6.4 |
| Private equity/angels | 3.6 |
| Venture capital | 2.8 |
| Foreign private | 3.0 |
| Universities/colleges | 2.4 |
| N= | 467 |
NOTE: Table excludes companies with no additional investments. Responses do not sum to 100 percent because respondents could select more than one response.
SOURCE: 2011 NRC Survey, Question 34.
Company-Level Development
SBIR companies often commercialize their technology through mergers or other company-level activities. However, evidence from the survey suggests that this was not an especially important outcome for respondents. More than 80 percent of Phase II respondents reported none of the company-level changes listed in Table 3-9: large majority of respondents indicated that their companies had not been acquired, implemented or planned an Initial Public Offering (IPO), or established a spin-off.
Respondents reported on a range of market-related activities involving agreements between their company and other organizations, which can again be taken as an indication of commercial activity. About half of all Phase II respondents reported completion of at least one R&D agreement with U.S.based companies or investors; slightly more than one-quarter reported customer alliances, and slightly less than one-quarter reported licensing agreements; 19 percent reported manufacturing agreements and 17 percent reported marketing and distribution agreements.
Commercialization Training and Marketing
Federal agencies have in recent years increased the amount of commercialization training for SBIR awardees. In some cases, this training has been mandatory. At DoD, commercialization training is the separate responsibility of each component and is typically delivered through third-party
TABLE 3-9 Company-Level Changes as a Result of the SBIR Funding
| Phase II (Percent) | |
| Established one or more spin-off companies | 16.1 |
| Been acquired by/merged with another company | 3.5 |
| Made an IPO | 1.4 |
| Planning to make an IPO in 2011-2012 | 0.9 |
| None of the above | 80.1 |
| N (unique companies) = | 386 |
| N (unique respondents) = | 659 |
NOTE: Responses do not sum to 100 percent because respondents could select more than one answer. Because multiple responses were received from some companies (those with more than one PI or with PIs who provide more than one responses, multiple responses from a single company were averaged to generate data by company. The table includes this averaged data.
SOURCE: 2011 NRC Survey, Question 10.
contractors such as Dawnbreaker, which provides these services to Navy SBIR awardees. Questions focused on this area were added to the 2011 Survey (see Table 3-11), and responses indicate that about 30 percent of companies had participated. Agency efforts in this area focus heavily on Phase II awardees (see Chapter 6).
TABLE 3-10 Market-Oriented Activities—Finalized Agreements with U.S. Companies and Investors
| Phase II (Percent) | |
| R&D agreement(s) | 49.2 |
| Customer alliance(s) | 27.0 |
| Licensing agreement(s) | 24.2 |
| Manufacturing agreement(s) | 18.9 |
| Marketing/distribution agreement(s) | 16.8 |
| Joint venture agreement | 7.4 |
| Sale of technology rights | 6.6 |
| Sale of company | 2.9 |
| Company merger | 3.3 |
| Partial sale of company | 2.9 |
| Other | 4.9 |
| N (those reporting at least one such activity) = | 244 |
NOTE: Responses do not sum to 100 percent because respondents could select more than one answer.
SOURCE: 2011 NRC Survey, Question 38.1.
TABLE 3-11 Participation in Commercialization Training
| DoD SBIR Phase II (Percent) | |
| Yes | 30.2 |
| No | 69.8 |
| 100.0 | |
| N= | 761 |
SOURCE: 2011 NRC Survey, Question 17.
A new question to the survey asked whether companies had at least one full-time staff member for marketing; about 40 percent of Phase II respondents indicated that they had at least one full time marketing staffer (see Table 3-12). The relatively small size of the median company may help to explain the limited resources devoted to marketing.
ADDITIONAL EVIDENCE FROM THE CCR DATABASE
As part of its research for this study, the committee reviewed Company Commercialization Register (CCR) data provided by DoD on 18,450 awards. Of these, about half of the awardees had commercialized by generating either sales or additional funding.
Basic Commercialization Metrics
The CCR and the NRC survey provide useful cross-checks on basic commercialization outcomes. They are collected using entirely different mechanisms, and, given the current focus in the NRC survey on responses from principal investigators (PIs), they even draw from a different pool of respondents at SBIR companies.
The most basic metric of SBIR commercialization is whether the project generated sales or additional investment. CCR data as of July 2013 on this core metric (see Figure 3-2) show that for all components just over 50 percent reported some sales, which is consistent with the NRC survey results presented earlier in this chapter which showed that 45 percent of survey respondents had already generated sales. The delays involved in SBIR commercialization (see section on Delays below) illustrates further congruence between NRC and CCR data, as shown in figure 3-2. Similarly, a review of commercialization by component shows that projects at different components largely reach the market at similar rates (Figure 3k-2). These comparisons indicate that the results generated from the NRC survey can he viewed with a higher degree of confidence in light of the similar results form the different methodology employed for collecting the CCR data set.
TABLE 3-12 Full-Time Marketing Staff (One or more)
| Phase II (Percent) | |
| Yes | 39.0 |
| No | 61.0 |
| Total | 100.0 |
| N (unique respondents) = | 670 |
SOURCE: 2011 NRC Survey, Question 12.
Although reaching the market is an important milestone of commercialization, it is not sufficient to describe commercial outcomes. For that we also need some sense of scale—how large was the commercialization outcome? Therefore, the second core commercialization metric is “What is the level of commercialization?”
Much work within DoD focuses on the total amount of commercialization, especially the amount reported through FPDS and to a lesser
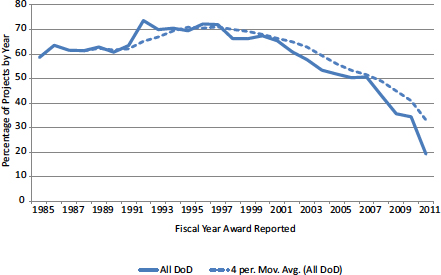
FIGURE 3-1 Cumulative commercialization12 of DoD Phase II projects over time (projects with returns >$0).
SOURCE: DoD Company Commercialization Record database, August 2013.
__________________
12DoD CCR database contains self-reported data from SBIR recipients. All SBIR applicants with previous awards at DoD must update the record for each prior project before they can be awarded a contract. The CCR reports both sales and additional investment as commercialization.
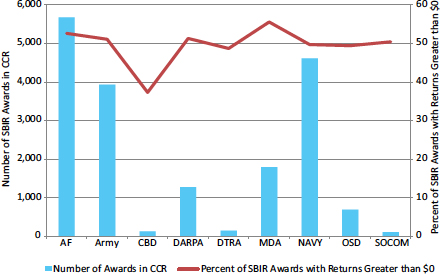
FIGURE 3-2 Commercialization by number and percentage of awards at DoD by component.
SOURCE: DoD CCR database, August 2013.
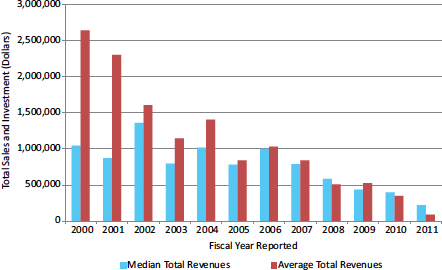
FIGURE 3-3 Average and median total revenues by fiscal year reported.
SOURCE: DoD CCR database, August 2013.
degree CCR. However, this focus—with attendant emphasis on average return on investment (ROI) per project—can be skewed by outliers. For example, a single massive success awarded in 1993 led to mean revenues more than seven times median revenues. Figure 3-3 shows both the median reported revenues and the average reported revenues by fiscal year reported.
The median return once products completed their cycles was about $1 million, for all projects entered into the CCR database, which includes projects returning zero dollars.13 This median holds when year-by-year fluctuations are disregarded, even if earlier years are reviewed, for example dating back to 1994.
These data provide some evidence about the life cycle of SBIR projects, which appears to end approximately 8 years after the date of award. As a result, aggregate revenue for a project on average continues to increase until 8 years after the award. It should be expected, therefore, that projects awarded in 2013, will—at the median—complete their commercialization cycle by approximately 2021.
The data also suggest that we have not yet seen conclusive quantitative results of policy changes made late in the 2000s, or systematic results from the more recent commercialization initiatives described in Chapter 4.
This finding has important implications for policy analysis. Most notably, efforts to assess commercialization on a shorter time scale—for example, 2 to 4 years after the end of projects—will likely overlook the steady increase in commercialization that occurs over time. Furthermore, when making policy adjustments to the SBIR program, focusing exclusively on short-term outcomes, or, conversely, overlooking longer-term outcomes, is a mistake. While it is possible to develop intermediate metrics, policymakers should understand that commercialization is, in the end, a long-term process that must be addressed through analysis covering a considerable span of years.
However, if reliance on short-run data would be a mistake, and products take many years to move through their life cycles, then it will be important for DoD to develop systematically measurable quantitative milestones prior to commercialization.
Commercialization by Component
The summary numbers for commercialization published by DoD and its components have focused to a considerable degree on total commercialization, usually expressed by year. Although DoD itself in most cases relies on utilizes the FPDS database, the data from the CCR database provide similar insights. Figure 3-4 aggregates all revenues generated by all projects in the CCR database.
__________________
13According to Office of Small Business (OSB) staff, the database contains all DoD SBIR projects awarded since FY2002, and a large preponderance of awards from before that date. So the median figure above is for all projects, including those with zero returns.
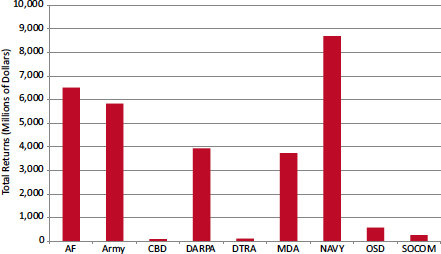
FIGURE 3-4 Aggregated additional revenues and investments for SBIR projects, by component, for Phase II awards, 1992-2013.
SOURCE: DoD CCR database, August 2013.
However, this simple approach is misleading. Figure 3-5 shows that median returns by component were quite similar, unlike average returns, and
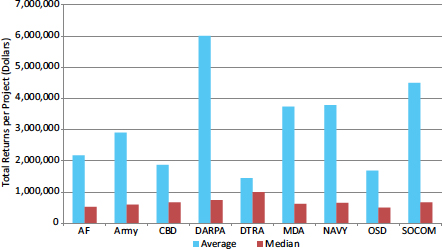
FIGURE 3-5 Average and median total returns for awards by component, FY 1992-2013.
SOURCE: DoD CCR database, August 2013.
that returns at DARPA in particular were positively affected by a single very large project in a portfolio containing a relatively small number of projects.
CONCLUSIONS: COMMERCIALIZATION
Evidence from the NRC survey provides useful insight into the commercialization record of SBIR companies at DoD, on a number of dimensions. Most importantly, the data confirm that a substantial percentage of projects do indeed commercialize through sales of products or services and/or through the receipt of additional development funding.
Forty-five percent of Phase II respondents indicated that their company had already recorded sales of products or services derived from the awarded project. A further 25 percent were expecting sales in the future. Given the relatively short time between the award date and the survey date, these expectations are not unreasonable. The NRC survey and the CCR database reported similar levels of market reach for Phase II awards.
SBIR commercialization is also associated with take-up by DoD. About 60 percent of Phase II projects with some revenues recorded sales to DoD or DoD primes. Further investment is another important metric for commercialization. Many Phase II projects are not yet ready for the marketplace at the end of the award period, especially at DoD, where careful technology readiness assessment must occur before interest emerges from acquisitions groups. Slightly more than 60 percent of Phase II respondents reported that the project acquired additional funding, and about 9 percent reported receiving $5 million or more.
Of the subset of Phase II projects that received additional funding, more than one-half received it from federal non-SBIR sources, which reflects linkages between the SBIR program and federal acquisition programs, while 16 percent received funding from other private companies, which may include DoD primes. This figure may reflect difficulties in dealing with the primes—see Chapter 6.
Finally, the source of additional investment has shifted. In the current survey, almost three times as many Phase II respondents reported that their company acquired non-SBIR federal funding as did those reporting in the previous survey. This shift may reflect the substantial efforts within DoD to more closely link the SBIR program with the acquisition programs that are the primary source of additional development funding.
Clearly, Phase II SBIR funding is strongly correlated with positive market outcomes, and with links into the DoD acquisition programs either directly or through subcontracts with the DoD primes.
KNOWLEDGE EFFECTS
One of the four congressionally mandated objectives for the SBIR program is to “stimulate technological innovation,” which is often equated to
patenting activity. However, in the context of small business, this standard metric of innovation does not capture the entire story: patenting is important, but it is also expensive, and there is some uncertainty across DoD components and services whether SBIR funds can be legally be used for this purpose.14 In addition, many companies interviewed for this report indicated that they preferred to keep their technology secret, or to rely on first-mover advantages and other market-based leverage to defend their technologies.
However, standard metrics provide at least a starting point for quantitative analysis. Consequently, the survey addressed several metrics related to intellectual property (IP): patents, trademarks, copyrights, and peer-reviewed papers.15
Patents
Because patents at small companies often result from multiple contracts in multiple projects, it is important to capture patents related to the surveyed project surveyed and as well as patents more generally attributable to SBIR-funded research.
Overall, about 60 percent of Phase II respondents who answered questions about patents claimed to have been awarded at least one patent related to any SBIR-funded technology, and 10 percent reported at least 10 SBIR-related patents (see Table 3-13), results that are almost identical to those from NRC’s Company Survey in 2009.16 We note however that a considerable number of respondents (approximately 343 out of 765—or more than 50 percent) did not answer this question. It seems plausible that respondents with no patents to report may have been more likely to have skipped this section, so these results should be viewed with an appropriate degree of caution.
So far as the specific project being surveyed is concerned, about 30 percent of respondents reported that their company had received at least one patent related to the surveyed project (see Table 3-14). Again, this finding is very close to that reported in 2009.17
__________________
14DCAA does sometimes allow patent costs in the General and Administrative rates (G&A) for SBIR companies. An active discussion, whether patents should be direct or indirect costs, is now taking place between small businesses and DCAA on allowing patent costs that arise from an SBIR invention.
15It is important to note that the value of these representations of intellectual property varies. Any unique item painting, photo, music score, can be copy-written for a modest fee. Trademarks include a bit more process, as registered trademarks need to be unique in their field so as not to impinge on another prior trademark’s domain. A patent can be valuable IP, and patents have been correlated with prosperity. Refereed journal articles as a metric are not as valued outside of academia as inside. There is no tenure track requirement to publish such articles. The university professors who participate in SBIR may be responsible for production of the number of such articles.
16National Research Council, Assessment of the SBIR Program at the Department of Defense, op. cit., p. 270.
17Ibid, p. 148.
TABLE 3-13 Number of Patents Related to All Company SBIR Awards
| Phase II (Percent) | |
| 0 | 42.0 |
| 1 or 2 | 24.7 |
| 3 or 4 | 12.1 |
| 5 to 9 | 11.3 |
| 10 or more | 10.0 |
| Total | 100.0 |
| At least 1 | 58.0 |
| N (unique companies) = | 374 |
| N (unique respondents) = | 643 |
NOTE: Because multiple responses were received from some companies (those with more than one PI or with PIs who provide more than one responses, multiple responses from a single company were averaged to generate data by company. The table includes this averaged data.
SOURCE: 2011 NRC Survey, Question 11.
There was limited interest among companies in either trademarks or copyrights, the two other primary forms of legal protection for intellectual property.
TABLE 3-14 Number of Patents Related to Surveyed Project
| Phase II (Percent) | |
| 0 | 68.2 |
| 1 | 17.3 |
| 2 | 9.2 |
| 3 | 2.6 |
| More than 3 | 2.6 |
| Total | 100.0 |
| At least 1 | 31.8 |
| N= | 422 |
NOTE: The number of respondents for this question is considerably lower than for many other questions. It is perhaps likely that respondents with no project related patents or related peer reviewed articles may have skipped this section, so responses should be analyzed bearing in mind this possibility.
SOURCE: 2011 NRC Survey, Question 39.1.2.
Peer-Reviewed Publications
Knowledge from publicly funded research is not primarily transmitted through patents. Peer-reviewed publications have become a standard metric for knowledge transfer. As the evidence below indicates, there are many incentives for small companies to publish their research. However, there are significant difficulties in applying these standards to small businesses whose technical knowledge is in many cases their only source of competitive advantage. For this reason, there are also significant disincentives to participate in peer-reviewed publication.
Data from the survey suggest that companies and their staff do widely participate in this knowledge transmission process. Almost 75 percent of the Phase II respondents who answered this question indicated that an author at the surveyed company had published at least one scientific paper related to the surveyed project, and more than a quarter reported publishing 3 or more (see Table 3-15).
Links to Universities
An additional metric for knowledge transfer is the development of linkages with universities, in both directions. Data from the survey indicate that SBIR projects often develop close university ties. For example, in response to questions about the use of university staff and facilities on the surveyed project, Just over one-third of respondents reported a university connection of some kind. This represents an increase from the 2007 survey, when one-quarter of respondents reported a university linkage.18 The most reported types of linkage were a faculty member working on the project but not as a PI; graduate students employed on the project; and a university or college as a subcontractor on the project. (see Table 3-16).
Respondents were also asked to identify the universities with which they worked in various capacities on this project. Overall, 211 different universities and colleges were identified. Those mentioned by 10 or more respondents are listed in Table 3-17 (see Appendix C for the complete list of universities).
Many of the universities are large state universities, a number of which have in recent years focused on technology transition as well as basic research. The University of California system had 56 mentions and the University of Texas system had 22. (See Appendix C.) Although far from a perfect metric, these data provide an initial picture of the connections between specific universities, university systems, and the DoD SBIR program.
Finally, 60 percent of the companies in the sample had at least one
__________________
18Ibid, p. 265.
TABLE 3-15 Number of Scientific Publications Related to the Surveyed Project
| DoD SBIR Phase II (Percent) | |
| 0 | 25.6 |
| 1 | 18.0 |
| 2 | 17.8 |
| 3 | 12.7 |
| More than 3 | 25.8 |
| Total | 100.0 |
| At least 1 | 74.4 |
| N= | 488 |
NOTE: The number of respondents for this question is considerably lower than for many other questions. It is perhaps likely that respondents with no project related patents or related peer reviewed articles may have skipped this section, so responses should be analyzed bearing in mind this possibility.
SOURCE: 2011 NRC Survey, Question 39.4.2.
founder with an academic background19 and about 25 percent had at least one founder who was most recently employed at a college or university.20
TABLE 3-16 Links to Universities
| Phase II (Percent) | |
| Faculty member(s) or adjunct faculty member(s) worked on this project in a role other than PI | 18.8 |
| A university or college was a subcontractor on this project | 19.7 |
| Graduate students worked on this project | 17.7 |
| The technology for this project was originally developed at a university or college by one of the participants in this project | 7.7 |
| The PI for this project was an adjunct faculty member | 3.3 |
| The technology for this project was licensed from a university or college | 3.1 |
| The PI for this project was a faculty member | 1.7 |
| Any of the above | 34.8 |
| N= | 750 |
SOURCE: 2011 NRC Survey, Question 59.
__________________
19The definition of “academic background” is left to the recipient, following previous GAO and NRC survey practices.
202011 NRC Survey, Question 4D.
TABLE 3-17 University Participants Mentioned by 10 or More Respondents
| Number of Mentions | |
| University of Colorado | 28 |
| MIT | 24 |
| Georgia Institute of Technology | 23 |
| University of Florida | 22 |
| Pennsylvania State University | 21 |
| Purdue University | 19 |
| University of Maryland | 17 |
| University of Michigan | 17 |
| Stanford University | 14 |
| UC Berkeley | 14 |
| University of Minnesota | 14 |
| University of Illinois | 13 |
| Dartmouth College | 11 |
| Ohio State University | 11 |
| University of Alabama | 11 |
| University of Arizona | 10 |
| University of Central Florida | 10 |
| University of Massachusetts | 10 |
| University of Texas at Austin | 10 |
SOURCE: 2011 NRC Survey, Question 60.
Conclusions: Knowledge Effects
The data reveals that small companies are key drivers of technological knowledge and innovation, a considerable amount of which is protected through the patent system. About 60 percent of Phase II respondents who answered the question about patents reported that their company had received at least one patent based on its work under SBIR contracts, while about one-third reported at least one patent related to the surveyed project alone.
SBIR companies participate at a high level in the standard form of technical knowledge dissemination: publishing in peer-reviewed journals. About 75 percent of Phase II respondents who answered questions about peer reviewed articles reported that their company published at least one article based on the SBIR-funded work, and 25 percent reported publication of at least three such papers.
BOX 3-1
Workshop on Improving University-SBIR Linkages
On February 5 2014, the committee convened a workshop at the National Academies on Universities and the SBIR/STTR.a Participants at this workshop considered a range of issues including:
- Improving linkages between SBIR programs at agencies and the universities;
- Aligning with university accelerator initiatives;
- Supporting improved links between state and local innovation and entrepreneurship programs and the universities; and
- Supporting shifts in culture at universities to incentivize faculty to pursue SBIR/STTR funding.b
__________________
a<http://sites.nationalacademies.org/PGA/step/sbir/PGA_086819.htm>.
bThese issues and others related to the SBIR/STTR program and universities will be addressed in detail in the upcoming NAS report on the STTR program.
Finally, some SBIR companies are closely connected to the universities. About one-third of Phase II respondents reported a university connection on the surveyed project, and 19 universities were specifically mentioned as playing a role in at least 10 reported projects. This suggests that SBIR plays a potentially important role in supporting the practical implementation of university research.
COUNTERFACTUALS
It is always difficult to tightly determine the impact of a given SBIR award. Many factors affect the success and failure of companies and projects, and determining whether a specific factor was a necessary condition for success is challenging. Furthermore, the large number of factors and the multiple paths to success and failure lessen the ability to state with confidence that a particular intervention—in this case an SBIR award—constitutes a sufficient condition for a project’s success.
One approach has been to ask recipients for their own views on the program’s impact on their project or company. What would have happened to the project absent the SBIR award? Would it have proceeded anyway, and, if so, in what form? This section addresses these questions.
Project Go-Ahead Absent SBIR Funding
The survey asked whether the project would have been undertaken absent SBIR funding, and, if so, whether the scope and timing would have been affected. The results strongly support the view that SBIR funding affected the decision to move or not move forward (see Table 3-18). Slightly less than 8 percent of the Phase II respondents indicated that there was even a probability that the project would have proceeded without SBIR funding. In contrast, more than 80 percent thought the project would most likely not have proceeded absent SBIR funding: 38 percent were definite that the project would not have proceeded, and 43 percent thought it unlikely. Responses in 2007 were similar, although fewer respondents believed the project would not have proceeded (70 percent).21 These data highlight interesting wider implications for the debate about early-stage funding: they suggest a weakness in the “crowding out” hypothesis, because it would appear that awardees—presumably those with the closest knowledge of funding prospects for the project—overwhelmingly believed it unlikely that funding alternatives to SBIR could be found.22
Project Scope Absent SBIR Funding
SBIR funding may also have affected project scope: additional funding through the SBIR program may have led to an expansion of project scope. However, because DoD awards SBIR funding to proposals that closely meet agency criteria for a specific topic (which can be very tightly drawn), tailoring a project to the demands of a particular solicitation could also potentially reduce its scope.23
The committee’s analysis focused only on the responses indicating that the project would have definitely proceeded absent program funding. Most respondents indicated that the absence of SBIR funding would have limited the project scope. Interestingly, however, about 13 percent indicated that SBIR funding would have limited the project’s scope, most likely because of the need to meet the specific SBIR award criteria (see Table 3-19).
Project Delays Absent SBIR Funding
As with project scope, the immediate supposition is that, absent SBIR funding, projects would have been delayed while other funding was identified
__________________
21National Research Council, Assessment of the SBIR Program at the Department of Defense, p. 259.
22See discussion of crowding out in Dirk Czarnitzki and Andreas Fier, Do Innovation Subsidies Crowd out Private Investment? Evidence from the German Service Sector, ZEW Discussion Papers, No.02-04, 2002.
23SBIR topics posted by DoD vary substantially, and there is no requirement or standard that each topic should contain a certain amount of specificity. Over the past 15 years, the character of topics in the DoD solicitation has perceptibly changed, becoming more specific, according to companies interviewed for this project as well as interviews with agency staff.
TABLE 3-18 Project Undertaken in the Absence of SBIR Funding
| Phase II (Percent) | |
| Yes | 7.8 |
|
Definitely yes |
1.2 |
|
Probably yes |
6.7 |
| Uncertain | 11.5 |
| Probably not | 42.9 |
| Definitely not | 37.8 |
| Total | 100.0 |
| N= | 765 |
SOURCE: 2011 NRC Survey, Question 24.
and acquired. However, as we shall see when considering program operations later in this report, SBIR awards involve delays of their own, which can in some cases be substantial. This question addresses the balance between delays imposed by the need to seek alternative funding and delays inherent in the SBIR program.
A majority of respondents who were certain that the project would have proceeded absent SBIR funding agreed that the absence of SBIR funding would have delayed the project (see Table 3-20). Seventy-five percent reported that the project would have been delayed by at least 12 months—up from the 50 percent reported in 2009.24 Given that gaps and delays can significantly impact the viability of small companies with limited resources to retain technical teams, this would seem to be an important consideration.
TABLE 3-19 Project Scope in the Absence of SBIR Funding
| Phase II (Percent) | |
| Broader | 13.3 |
| Similar | 26.7 |
| Narrower | 60.0 |
| Total | 100.0 |
| N= | 60 |
NOTE: Based on responses from 60 companies who were certain that the project would have proceeded even without the SBIR award.
SOURCE: 2011 NRC Survey, Question 25.
__________________
24National Research Council, Assessment of the SBIR Program at the Department of Defense, op. cit. p. 260.
TABLE 3-20 Likely Project Delay in the Absence of SBIR Funding
| Phase II (Percent) | |
| < 12 months | 25.0 |
| 12-23 months | 50.0 |
| 24 to 35 months | 14.3 |
| ≥36 months longer | 10.7 |
| Total | 100.0 |
| N= | 56 |
NOTE: Based on responses from 60 companies who were certain that the project would have proceeded even without the SBIR award.
SOURCE: 2011 NRC Survey, Question 26B.
SBIR Funding and Project Duration
The survey also asked respondents to determine how the absence of SBIR funding would have affected the project duration. More than 80 percent reported that the project would have taken longer (see Table 3-21). This is also a potentially important finding, in that delays in bringing projects to conclusion, and hence to the point of potential market entry, can have a negative effect on company prospects, because the window for market entry can be a narrow one.
Long-Term Impacts on the Recipient Company
Although SBIR awards have direct effects on specific projects, they can also have a powerful longer-term effect on the trajectory of company development, creating capacity and, in some cases, providing a critical input that transforms long-term outcomes.
The survey asked respondents about this issue directly. The results are striking: they demonstrate a clear positive long-term impact on recipient companies (see Table 3-22). Overall, 20 percent of Phase II respondents
TABLE 3-21 Project Longevity in the Absence of SBIR Funding
| Phase II (Percent) | |
| Longer | 83.3 |
| The same | 15.0 |
| Shorter | 1.7 |
| Total | 100.0 |
| N= | 60 |
NOTE: Based on responses from 60 companies who were certain that the project would have proceeded even without the SBIR award.
SOURCE: 2011 NRC Survey, Question 26B.
TABLE 3-22 Long-Term Impacts of SBIR Funding on Recipient Companies
| DoD SBIR Phase II (Percent) | |
| Had a transformative effect | 20.2 |
| Had a substantial positive long-term effect | 56.8 |
| Had a small positive effect | 17.2 |
| Had no long-term effect | 3.8 |
| Had a negative long-term effect | 1.9 |
| Total | 100.0 |
| N (unique companies) = | 416 |
| N (unique respondents) = | 762 |
NOTE: Because multiple responses were received from some companies (those with more than one PI or with PIs who provide more than one responses, multiple responses from a single company were averaged to generate data by company. The table includes this averaged data.
SOURCE: 2011 NRC Survey, Question 45.
indicated that SBIR funding had a transformative effect on their company, and a further 56 percent reported a substantial positive effect. Only 2 percent reported negative effects.
Key Aspects of SBIR-Driven Transformation
It is not easy to summarize the numerous ways in which DoD SBIR awards helped to transform recipient companies. The key aspects of SBIR-driven transformation are explored in more detail in Chapter 5, which draws extensively on the numerous open-ended comments received in response to this question. What follows, therefore, is a limited list of impacts:
- provided first dollars;
- funded areas that did not interest venture capital and other funders;
- created connections to acquisition programs;
- opened doors to many potential stakeholders in specific technologies, including agencies, primes, investors, suppliers, subcontractors, and universities;
- assisted entry into niche markets too small for major players/funders;
- funded technology development;
- enabled projects with high levels of technical risk;
- supported adaptation of technologies to new uses, markets, and industry sectors;
- diversified expertise and allowed hiring of specialists;
- replaced private capital funding during downturns;
- attracted and developed young researchers;
- redirected company activities to new opportunities;
- developed connections to primes;
- reduced costs;
- helped address needs that require high technology at low volume and relatively low cost;
- moved technology up to technology readiness level (TRL) 7-9 (at which point acquisition funding becomes more possible);
- provided new companies with immediate credibility;
- funded researchers to enter business full time;
- helped university researchers manage IP and ITAR problems;
- transformed company culture to become more market driven;
- drove researchers to focus on technology transition;
- created new companies and kept companies in business (that would not exist without SBIR funding); and
- supported feasibility testing for high-risk, high-payoff projects (Phase I).
Overall, the strongest conclusion drawn from these responses is that small innovative companies are highly sensitive to the impact of exogenous variables. The sudden withdrawal of a sponsor can crush a company; a single contract can provide funding for 2 or 3 years of growth. And above all, these small companies are highly path dependent: what happens to them at a given moment can have long lasting effects.
In the end, SBIR was in many cases a profoundly positive exogenous variable: one that provides funding, validation, and market access that are otherwise not available. Although it is difficult to link one SBIR award to the eventual success of a large corporation, in fact, SBIR awards played a key role in enabling some very small companies to grow into larger ones.
COMPANY AND PROJECT CHARACTERISTICS: INDEPENDENT VARIABLES
The outcomes section above strongly suggests that, overall, Phase II SBIR funding at DoD correlates with commercial success. However, a variety of other factors may play a role, which the survey sought to identify.
Founders and Company Foundation
Venture investors focus heavily on the composition of the company team when deciding whether to make an investment. Accordingly, it seemed appropriate to explore the characteristics of company founders.
About 41 percent of Phase II respondents indicated that the company had one founder, 31 percent reported two founders, 28 percent reported more than two founders. (see Table 3-23).
TABLE 3-23 Number of Founders
| DoD SBIR Phase II (Percent) | |
| 1 | 41.8 |
| 2 | 30.8 |
| 3 | 16.1 |
| 4 | 7.7 |
| 5 or more | 3.5 |
| 100.0 | |
| N (unique companies) = | 382 |
| N (unique respondents) = | 660 |
NOTE: Because multiple responses were received from some companies (those with more than one PI or with PIs who provide more than one responses, multiple responses from a single company were averaged to generate data by company. The table includes this averaged data.
SOURCE: 2011 NRC Survey, Question 4A.
Venture investors also consider previous experience in founding companies, on the theory that some mistakes will have been made and lessons learned. Pursuing this line of questioning enabled the committee to estimate the use of SBIR by serial company founders. about 60 percent of Phase II respondents indicated that their companies did not have a founder who had previously founded a company. About 7 percent of Phase II respondents reported founders of three or more companies (see Table 3-24).
TABLE 3-24 Number of Previous Companies Started by Founders
| DoD SBIR Phase II (Percent) | |
| 0 | 62.0 |
| 1 | 17.8 |
| 2 | 12.9 |
| 3 | 4.2 |
| 4 | 1.3 |
| 5 or more | 1.8 |
| 100.0 percent | |
| N (unique companies) = | 382 |
| N (unique respondents) = | 660 |
NOTE: Because multiple responses were received from some companies (those with more than one PI or with PIs who provide more than one responses, multiple responses from a single company were averaged to generate data by company. The table includes this averaged data.
SOURCE: 2011 NRC Survey, Question 4B.
Slightly less than one-half of Phase II respondents reported at least one founder with a business background (see Table 3-25), and just over 60 percent of all respondents reported at least one founder with an academic background (see Table 3-26). Although almost three-quarters of founders were previously employed at other private companies, more than a one-quarter of respondents reported at least one founder previously employed at a college of university.
Previous studies from the NRC have asserted that for at least some companies, SBIR funding provided opportunities that led directly to company formation. Here, more than one-third of respondents indicated that the surveyed award contributed to some degree to the formation of the company (see Table 3-28).
Industry Sector
Previous analyses of SBIR did not address a potentially important intervening variable: industry sector. It is quite possible that commercialization outcomes may be affected by the average cycle time of product development in different sectors. For example, product cycle time is much shorter in software than in materials or medical devices. Table 3-29 shows the distribution of responses by sector and phase.
TABLE 3-25 Number of Founders with Business Backgrounds
| DoD SBIR Phase II (Percent) | |
| None | 51.7 |
| 1 | 32.2 |
| 2 | 11.0 |
| 3 | 2.9 |
| 4 | 1.4 |
| 5 or more | 0.7 |
| Total | 100.0 |
| At least 1 | 48.2 |
| N (unique companies) = | 382 |
| N (unique respondents) = | 660 |
NOTE: Because multiple responses were received from some companies (those with more than one PI or with PIs who provide more than one responses, multiple responses from a single company were averaged to generate data by company. The table includes this averaged data.
SOURCE: 2011 NRC Survey, Question 4C.
TABLE 3-26 Number of Founders with Academic Backgrounds
| DoD SBIR Phase II (Percent) | |
| None | 38.8 |
| 1 | 39.9 |
| 2 | 12.2 |
| 3 | 4.2 |
| 4 | 3.6 |
| 5 or more | 1.4 |
| Total | 100.0 |
| At least 1 | 61.3 |
| N (unique companies) = | 382 |
| N (unique respondents) = | 660 |
NOTE: Because multiple responses were received from some companies (those with more than one PI or with PIs who provide more than one responses, multiple responses from a single company were averaged to generate data by company. The table includes this averaged data.
SOURCE: 2011 NRC Survey, Question 4D.
This question was designed to provide an approximate map of activities by sector. There is considerable overlap between some categories, and respondents had substantial leeway to define sectors, so these data should be viewed as highly preliminary. However, several key points emerged from the data:
- Defense-orientation. About 70 percent of Phase II respondents indicated that their project was in defense-specific products and services.
TABLE 3-27 Prior Employment of Founders
| DoD SBIR Phase II (Percent) | |
| Other private company | 73.1 |
| College or university | 27.6 |
| Government | 9.2 |
| Other | 4.8 |
| N (unique companies) = | 391 |
| N (unique respondents) = | 671 |
NOTE: Because multiple responses were received from some companies (those with more than one PI or with PIs who provide more than one responses, multiple responses from a single company were averaged to generate data by company. The table includes this averaged data.
SOURCE: 2011 NRC Survey, Question 5.
TABLE 3-28 Company Founded Because of SBIR Program
| DoD SBIR Phase II (Percent) | |
| Yes | 17.9 |
| In part | 17.5 |
| No | 64.7 |
| Total | 100.0 |
| N= | 673 |
SOURCE: 2011 NRC Survey, Question 6.
- Dominant sectors. Engineering and aerospace were the two dominant sectors (at 52 percent and 46 percent of Phase II responses respectively), followed by materials (23 percent) and IT (18 percent).
Project Status and Review of Discontinued Projects
Because the survey covers 10 years of Phase II awards, projects were at different stages of completion at the time of the survey. As noted in previous NRC analyses, this implies that project outcomes were in aggregate substantially under-reported, because of the number of projects whose entire life cycle was not yet complete. Table 3-30 shows the current status of the projects surveyed.
For Phase II respondents, 28 percent reported products or processes in use, while about 30 percent reported projects had been discontinued and 27 percent reported projects still in development.25
About one-fifth of the Phase II projects with outputs in use recorded sales to customers not expected at the time of the award. This reflects the flexible path often necessary for technology-based commercialization in this sector.
The survey sought explanations as to why company efforts had been discontinued (see Table 3-31). For Phase II respondents, no single explanation dominated—none of the options was selected by at least one-quarter of respondents. Market-related categories together totaled about 25 percent, which was only slightly higher than the “other” category, and lack of funding accounted for about the same percentage of responses. However, the percentage of market-related failures suggests that many Phase II projects do not advance far enough on the production curve to reach a market in which they might succeed or fail.
__________________
25Sometimes SBIR-funded research is picked up later at another company. This survey focused on the original recipient.
TABLE 3-29 Distribution of Responses by Sector
| Technology Sector | DoD SBIR Phase II (Percent) |
| Aerospace | 46.3 |
| Defense-specific products and services | 71.6 |
| Energy and the environment | 10.7 |
|
- Sustainable energy production (solar, wind, geothermal, bio-energy, wave) |
2.2 |
|
- Energy storage and distribution |
2.0 |
|
- Energy saving |
2.5 |
|
- Other energy or environmental products and services |
3.0 |
| Engineering | 51.9 |
|
- Engineering services |
14.3 |
|
- Scientific instruments and measuring equipment |
12.6 |
|
- Robotics |
5.5 |
|
- Sensors |
24.0 |
|
- Other engineering |
10.6 |
| Information technology (IT) | 18.2 |
|
- Computers and peripheral equipment |
4.2 |
|
- Telecommunications equipment and services |
3.8 |
|
- Business and productivity software |
3.3 |
|
- Data processing and database software and services |
5.9 |
|
- Media products (including web-, print- and wireless-delivered content) |
1.3 |
|
- Other IT |
5.4 |
| Materials (including nanotechnology for materials) | 23.1 |
|
- Medical technologies |
2.1 |
|
- Pharmaceuticals |
0.7 |
|
- Medical devices |
5.9 |
|
- Other biotechnology products |
2.2 |
|
- Other medical products and services |
1.6 |
| Other (please describe) | 12.6 |
| N= | 765 |
| T (total responses)= | 2,650 |
NOTE: Answers do not sum to 100 percent because respondents could select more than one response.
SOURCE: 2011 NRC Survey, Question 20.
TABLE 3-30 Current Status of Surveyed Projects
| DoD SBIR Phase II (Percent) | |
| Project has not yet completed [SBIR] funded research | 2.4 |
| Efforts at this company have been discontinued | 30.7 |
|
Discontinued because no sales or additional funding resulted from this project |
20.8 |
|
Discontinued—The project did result in sales, licensing of technology, or additional funding |
9.9 |
| Project is continuing post-award technology development | 26.9 |
| Commercialization is under way | 12.4 |
| Products/Processes/Services are in use | 27.6 |
|
In use by target customers |
21.7 percent |
|
In use by customers not anticipated at the time of the award |
5.9 percent |
| Total (primary categories) | 100.0 |
| N= | 765 |
SOURCE: 2011 NRC Survey, Question 30.
TABLE 3-31 Primary Reason for Project Discontinuation
| DoD SBIR Phase II (Percent) | |
| Not enough funding | 24.8 |
| Project goal was achieved (e.g. prototype delivered for federal agency use) | 16.5 |
| Market demand too small | 13.0 |
| Company shifted priorities | 2.6 |
| Level of technical risk too high | 2.6 |
| Other reason mentioned: | 40.4 |
| 100.0 | |
| N= | 230 |
NOTE: N= Respondents with awards no longer active.
SOURCE: 2011 NRC Survey, Question 32.
Company Size by Revenue
SBIR is aimed at supporting small companies. As employment data show, most awardee companies are much smaller than the Small Business Administration (SBA) maximum size for small companies (500 employees in most sectors).26
At the time of the survey, about 24 percent of awardee companies responding to the 2011 survey had revenues of $5 million or more, and 1.4 percent had revenues of $100 million or more. Further, about 24 percent of Phase II respondents reported that their companies had less than $500,000 in revenues. (see Table 3-32).27
Company Activities and SBIR
The case studies conducted for this assessment reveal that in many cases the role of SBIR’s in the development of the small firm diminished over
TABLE 3-32 Company Annual Revenues by Phase (Most recent fiscal year)
| DoD SBIR Phase II (Percent) | |
| Less than $100,000 | 10.0 |
| $100,000-$499,999 | 13.9 |
| $500,000-$999,999 | 12.2 |
| $1,000,000-$4,999,999 | 37.6 |
| $5,000,000-$19,999,999 | 18.3 |
| $20,000,000-$99,999,999 | 6.7 |
| $100,000,000 or more | 1.4 |
| 100.0 | |
| N (unique companies) = | 385 |
| N (unique respondents) = | 659 |
NOTE: Because multiple responses were received from some companies (those with more than one PI or with PIs who provide more than one responses, multiple responses from a single company were averaged to generate data by company. The table includes this averaged data.
SOURCE: 2011 NRC Survey, Question 8.
__________________
26See SBA, Table of Small Business Size Standards Matched to North American Industry Classification System Codes, <http://www.naics.com/naicsfiles/Size_Standards_Table.pdf>. Accessed 10/20/13.
27The issue of potential non-respondent bias is addressed in Appendix A.
time as the company became less dependent on SBIR, that is, commercial products reached the market. The following section reviews survey data related to this issue. 28
SBIR Share of R&D Effort
The survey asked respondents to estimate how much of their company’s total R&D effort—defined as man-hours of work for scientists and engineers—was devoted to SBIR-funded projects.
Approximately two thirds of all Phase II companies were described by respondents as devoting 25 percent or less of their R&D effort to SBIR projects, while about 15 percent devoted more than 75 percent. (See Table 3-33).
These results correspond fairly closely to those from Question 9, which asked what percentage of company revenues during the current year were derived from SBIR projects (see Table 3-34).
TABLE 3-33 Percentage of R&D Effort Expended on SBIR Projects (Most recent fiscal year)
| DoD SBIR Phase II (Percent) | |
| 0% | 17.3 |
| 1%-10% | 14.5 |
| 11%-25% | 15.9 |
| 26%-50% | 19.5 |
| 51%-75% | 17.6 |
| 76%-100% | 15.2 |
| 100.0 | |
| N (unique companies) = | 387 |
| N (unique respondents) = | 660 |
NOTE: Because multiple responses were received from some companies (those with more than one PI or with PIs who provide more than one responses, multiple responses from a single company were averaged to generate data by company. The table includes this averaged data.
SOURCE: 2011 NRC Survey, Question 7.
__________________
28The contention that that there are a large number of companies that live off a stream of SBIR contracts with few if any commercialized products has been dispelled in previous NRC reports. See National Research Council, An Assessment of the SBIR Program, op. cit., p. 86. In addition, our review of agency practices shows that DoD program managers seek to exclude companies that seek additional awards but have a poor commercialization record.
Prior Use of the SBIR Program
The linear model of innovation implies that ideas are tested in Phase I, prototyped in Phase II, and commercialized in Phase III, 29 but there is considerable evidence to suggest that this model over-simplifies the process. Often, multiple iterations are required, or projects must restart with an earlier phase, or multiple efforts are needed to meet specific problems.
The survey asked respondents to indicate how many prior SBIR or STTR Phase I awards had been received by the company that were related to the project being surveyed. Nearly 80 percent of respondents overall reported receipt or one or more prior awards related to the same product/problem the surveyed award was intended to address. (See Table 3-34). This suggests that the norm is for companies to need several rounds of funding and research in the course of product development.
Prior Investment
One question surrounding the SBIR program is its role in the sequence of funding that leads from an idea to a product. As shown in Table 3-35, about two-thirds of respondents indicated that the company received investment funding for the surveyed technology prior to receiving the surveyed award.
TABLE 3-34 Number of Prior SBIR or STTR Phase I Awards Related to the Surveyed Project
| DoD SBIR Phase II (Percent) | |
| 0 | 20.0 |
| 1 | 34.4 |
| 2 | 17.3 |
| 3 | 11.5 |
| 4 | 6.5 |
| 5 or more | 10.2 percent |
| Total | 100.0 |
| 1 or more | 80.0 |
| N= | 704 |
SOURCE: 2011 NRC Survey, Question 40.1.1.
__________________
29For a review of the model and its intellectual history, see B. Godin, “The Linear Model of Innovation: The Historical Construction of an Analytical Framework,” Project on the History and Sociology of S&T Statistics Working Paper No. 30, 2005. Godin indicates that an important source for the model was Vannevar Bush’s famous paper, Science: The Endless Frontier, published in 1945.
TABLE 3-35 Sources of Funding, Prior to SBIR Award, for Related Technology
| DoD SBIR Phase II (Percent) | |
| Internal company investment (including borrowed money) | 52.7 |
| Prior [SBIR] (excluding the Phase I that preceded this Phase II) (a) | 53.3 |
| Prior non-[SBIR] federal R&D | 30.0 |
| Other private company | 14.0 |
| Private investor (including angel funding) | 9.5 |
| State or local government | 7.7 |
| Venture capital | 5.7 |
| College or university | 3.7 |
| Other (please specify) | 6.1 |
| N= | 493 |
SOURCE: 2011 NRC Survey, Question 21.
Overall, about two-thirds of respondents reported at least one source of additional funds. The largest source of prior funding was internal company funds, closely followed by previous SBIR awards.
Overall, 7.5 percent of Phase II respondents indicated that they had previously received venture capital (VC) funding.
CONCLUSIONS
Evidence reported in this chapter provides supports the conclusion that DoD is meeting Congressionally mandated objectives for the SBIR program with regard to commercialization and knowledge production. With regard to commercialization, projects funded by the SBIR program are reaching the market at - in the Committee’s judgment - an appropriate rate, and are also attracting substantial amounts of follow-on investment, which is in many cases a necessary next step toward commercialization. The data also show that knowledge effects from the SBIR program are positive, as funded projects generate a large number of patents and peer-reviewed articles.
There is only limited evidence from the 2011 NRC Survey and CCR database to indicate that projects are being taken up for use in DoD directly or indirectly through DoD primes in considerable numbers. We follow up on this point with a more detailed review of agency use of SBIR funded technologies in Chapter 4. Evidence from the 2011 NRC Survey about the fourth objective—support for women and minorities—is discussed in Chapter 6.


