
ANNEX 3: ATTAINING RECOMMENDED AMOUNTS OF FRUITS AND VEGETABLES IN THE AMERICAN DIET
Understanding the Consumption of Fruits and Vegetables Within the Context of a Complex System
The Dietary Guidelines for Americans encourage the U.S. population to consume more fruits and vegetables in order to maintain health and to prevent chronic disease. However, individual consumers make choices about what to eat within a broader context of what foods are available, affordable, and acceptable. This broader context is shaped by numerous actors and processes within the complex food system. Therefore, consideration of how the population could move toward increased consumption of fruits and vegetables is an ideal problem to be addressed with this framework.
The recommendation to consume more fruits and vegetables, although well intentioned, may not reach its goals if consideration is not given to the whole food supply chain and the associated environmental, social, and economic context in which consumers operate. This example explores the imbalance between dietary recommendations and consumption of fruits and vegetables and its implications for the food system, the environment, and society. An integrated assessment using the committee’s framework can provide insights into points along the supply chain where interventions would be most efficacious.
The importance of fruit and vegetable intake to the prevention of chronic disease has been long established through a large body of literature and confirmed through a series of systematic reviews (USDA, 2014; WCRF/AICR, 2007). Consistent evidence suggests fruit and vegetable intakes by adults are inversely associated with risk of myocardial infarction and stroke, especially with intakes above five servings per day. Also, evidence indicates that consumption of many fruits and vegetables decreases the risk of several types of cancer. Although limited, further evidence suggests that fruit and vegetable consumption also protects against adiposity in children and adolescents. The health-promoting properties of fruits and vegetables could stem from their high nutrient density (e.g., the amount of nutrients relative to energy) compared to other foods; their being rich sources of fiber or phytochemicals, which may be beneficial; and even their effects on the gut flora.
Although fruits and vegetables may be protective for a range of chronic diseases, the consumption of raw products may increase risk for foodborne illness. Raw vegetables, fruits, and nuts were major sources of foodborne illness for the years 1998-2008, leading to nearly half of all cases and nearly a quarter of deaths with identified etiology of disease (Painter et al., 2013). Although the number of illnesses and deaths are small in comparison to the numbers associated with coronary heart disease, cancer, and other chronic disease, the sudden onset of foodborne illness can have an immediate impact on consumption patterns, especially following large outbreaks. For example, following a 2006 E. coli O157:H7 outbreak associated with fresh, ready-to-eat spinach grown in California, the Texas spinach industry lost at least 20 percent in sales for all types of spinach—fresh and processed (CNAS and TAMU, 2007).
For the past 30 years, the Dietary Guidelines for Americans (DGA) have encouraged the population to increase their intakes of fruits and vegetables (HHS and USDA, 2014). The guidelines are a statement of federal nutrition policy and form the standards against which all federal nutrition programs are gauged. Their guidance for increasing fruit and vegetable consumption have always been made within the context of concomitant recommendations regarding other aspects of the diet, notably increased whole grains and decreased added sugars, solid fats, and sodium, and, in more recent editions, food safety. The implication has been that fruits and vegetables should be used as substitutes for less nutrient-dense foods because simply adding fruits and vegetables to an already energy-rich diet would aggravate the problem of overweight and obesity. The point of the guidelines has always been that the overall composition of the diet is critical.
Identify the Problem
As described in the committee’s framework, the first step of an assessment is to identify the problem. For this example, the problem is the imbalance between dietary recommendations and consumption of fruits and vegetables and its implications for the food system, the environment, and society.
Despite the continued federal guidance, fruit and vegetable intakes have remained well below recommendations over the past several decades (Krebs-Smith and Kantor, 2001; NCI, 2014). Recent estimates suggest that mean daily intakes for the whole population are slightly more than 1 cup of fruits and 1.5 cups of vegetables. As recommended intakes for the average 2,000 kcal diet are 2 cups and 2.5 cups, respectively, this suggests the average gap for each is approximately 1 cup per day. To conform to recommendations, the average person would need to nearly double fruit intake and increase vegetable intake by about 65 percent. Changes of this
magnitude on individual consumption would reverberate throughout the entire food supply chain.
Define the Scope of the Problem
Once a problem has been identified, the next step in an assessment is to frame its scope. This is done by characterizing the boundaries, components, processes, actors, and linkages encompassed by the system under consideration. This is particularly important for this example because the issue of fruit and vegetable consumption sits squarely along the entire supply chain portion of the food system, from “farm to fork” (see Figure 7-A-2). The aggregate supply of available fruits and vegetables falls short of the total needed for the entire population to eat the recommended amount per day (Buzby et al., 2006); many processed foods entering retail distribution channels contain little if any fruits or vegetables; many places where foods are sold do not offer fruits or vegetables in any form; and food service outlets tend to offer relatively few. Consumers, for their part, often choose other foods over fruits and vegetables, for reasons of cost, convenience, or preference. Thus, the mismatch between recommendations and availability/consumption occurs across the entire food chain.
Like any complex system, the key aspects of the U.S. food system in relation to fruits and vegetables include numerous drivers, actors, processes, outcomes, stocks, and flows. Supply and demand are the major drivers, with diverse external forces, such as weather, agricultural and immigration policies, and labor also exerting influences. Farmers, farm workers, food manufacturers, retailers, restaurateurs and chefs, school food service directors,
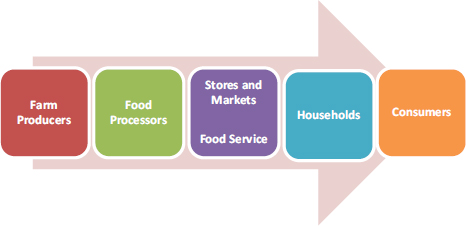
FIGURE 7-A-2 Fruits and vegetables supply chain and selected drivers.
and household food gatekeepers are all actors in this system, controlling the processes of planting, harvesting, transporting, processing, distribution, marketing, and preparation of fruits and vegetables. Figure 7-A-2 illustrates the main steps in the supply chain that can be influenced by various drivers.
Farm Level
Within the United States, fruit and vegetable production is a major business enterprise. Between 2000 and 2008, the sale of fruits and vegetables averaged about $35 billion annually (ERS, 2014a,b). Three-quarters of all fruit and vegetable production comes from irrigated land, which reflects a large capital investment and has implications for water ecology. Although less than 10 percent of all vegetable farms have sales exceeding $500,000, they account for about 90 percent of all vegetable sales. Most of the vegetable farms in this country are small, producing their yields on fewer than 15 acres.
Fruit and vegetable production comes from only 3 percent of U.S. cropland (UCS, 2013), but it accounts for about a third of all U.S. crop value (ERS, 2014a,b). Whether fruits and vegetables are destined for fresh markets or intended for future processing determines the varieties grown and the harvesting processes used. The Upper Midwest and some Pacific states are the largest producers of vegetables that go into processed foods, whereas Arizona, California, Florida, Georgia, and New York send more vegetables to markets as raw produce. California produces the largest share of fruit and vegetable crops among all of the states.
Market forces (supply and demand), productivity, and other external factors are key drivers in determining which crops are grown or imported. Oversupply at any point in time brings prices down, which decreases profitability. For this reason, the 2014 Farm Bill maintained a provision that prevents the planting of fruits and vegetables on acreage for which growers receive federal payments. Perishability of fruits and vegetables makes the timing of harvesting, distribution, and retail sales more important than for less perishable food products.
Regardless of the final use, fruit and vegetable production is labor intensive, and the produce industry in the United States pays higher wages than do many other countries (Calvin and Martin, 2010). This means the U.S. farming sector can attract the workers it needs. However, the work is seasonal and dependent on migrant labor. Changes in immigration policy could alter domestic production dramatically. As described below, for some crops, the cost of labor and land results in the movement of production out of the United States to other regions, especially for fruits and vegetables that are seasonal, frozen, canned, or dehydrated.
In addition to domestic output, international production is essential
to the aggregate U.S. fruit and vegetable supply. Imports of fruits and vegetables have risen substantially in the past 25 years, leading to a growing trade deficit in this sector of the economy (Johnson, 2014). Whereas the value of imports approximately equaled that of exports in the early 1990s, a trade deficit for fruits and vegetables of more than $11 billion had developed by 2011, despite the fact that exports have continued to grow. A number of domestic and global market conditions have affected this situation, including differences among countries in production costs, tariffs, and import requirements, and the increased demand in the United States for off-season produce.
Food Processors Level
Product innovation can have a major influence on demand. The introduction of pre-packaged, pre-cut, and other value-added raw, ready-to-eat fruit and vegetable products has boosted consumption. Examples of this are small-cut carrots, broccoli florets, bagged salads, and sliced apples.
Contrary to popular belief, fruits and vegetables do not need to be consumed raw or prepared from “fresh” to be healthy. The term “fresh” is often used to describe any raw produce, whereas it implies a reference to the time since harvesting. Ironically, frozen and canned fruits and vegetables are often processed closer to the point of harvest and thus frequently have greater nutrient retention than do so-called fresh items purchased from a grocery store for later preparation in the home. Fresh fruit and vegetable use far exceeds that of canned and frozen forms in the United States.
Marketing
Between the farm and consumer levels of the food supply chain is the essential influence of marketing, including product development, promotion, placement, and pricing. Promotion is a critical factor, as the food industry spends $11 billion per year on advertising, and grocery stores earn more from companies paying for optimal locations within the store to display their products than they do from customers (IOM, 2006). An example of an industry effort to promote fruit and vegetable consumption is the “Let’s Move Salad Bars to Schools” project, in which a coalition of private partners donates equipment required to display fresh salad components in a safe and hygienic manner to minimize food safety and regulatory compliance issues. To date, more than 2,600 schools have received donated salad bars for use in their school lunch program. However, the food and beverage industry also spent $149 million on marketing in schools in 2009, and advertising for sugar-sweetened beverages accounted for 90 percent of that (NPR, 2014). To the extent that industry efforts to promote less nutrient-
dense foods and beverages are successful, consumers may be influenced to choose relatively fewer fruits and vegetables.
In addition to the marketing efforts conducted by individual food companies, the U.S. Department of Agriculture (USDA) coordinates federally legislated promotion programs for various commodities (AMS, 2014b). Known as “check-off” programs, they are requested, administered, and funded by the industries themselves. They are designed to increase domestic demand and increase foreign markets for the relevant commodities. However, only a small fraction of these funds are appropriated to the promotion of fruits and vegetables; most of the funds go to the promotion of meats and dairy (Wilde, 2014).
Food Markets
Most fruits and vegetables are consumed at home, having been purchased in grocery stores or other markets. Since 1980, the number of produce items available in the average grocery store has doubled, and the availability of convenience items such as short-cut carrots, pre-packaged salads, and supermarket salad bars has expanded (Krebs-Smith and Kantor, 2001). Consumers now have a wide choice of fruits such as grapes, stone fruit, and berries that previously were available only in summer months due to increases in off-season imports of fruits from the southern hemisphere. In addition, since 1994, the number of farmers’ markets has increased several-fold in the United States to more than 8,000 in 2013 (AMS, 2014a).
Although supermarkets typically carry more than 400 produce items (Krebs-Smith and Kantor, 2001), it is important to note that, in many geographical areas, stores that sell food offer little, if any, fruits and vegetables. More than 40 percent of retail establishments in this country—including one in two hardware stores, and many auto repair shops, pharmacies, and furniture stores—sell food, and most of that is energy-dense and nutrient-deficient candy, snacks, and sugar-sweetened beverages (Cohen, 2014). This may be due to a number of factors, among them food safety concerns, regulatory requirements, profitability, turnover, ease of consumption, and other factors. These types of snacks are generally shelf-stable, single-serve items that have a low food safety risk profile.
When examined geographically, greater availability of such calorie-dense choices and restricted availability of fruits and vegetables seems to be of particular concern among lower-income and minority neighborhoods (Larson et al., 2009).
Fast-Food Outlets, Schools, and Other Food Service
Away-from-home food is a growing portion of all food ingested in this country. The overall number of restaurants has tripled in the past 40 years (Cohen, 2014), and if this trend continues, it could have a substantial impact on fruit and vegetable consumption because consumers are more likely to eat fruit and several healthful varieties of vegetables at home than away from home. Menu offerings from the country’s top fast-food restaurant chains in 2010 were low in overall diet quality and particularly out of line with dietary recommendations for fruits and vegetables (Kirkpatrick et al., 2014).
Several recent efforts have been launched to improve the availability of fruits and vegetables in America’s schools. USDA’s Farm-to-School Initiative was designed to help farmers in all 50 states sell fresh fruits and vegetables directly to local schools participating in the National School Lunch Program (NSLP). The Healthy Hunger-Free Kids Act of 2010 led to more stringent school meal nutrition standards, which were instituted in the 2012-2013 school year and included increased quantities of fruits and vegetables. Through its food distribution programs, USDA purchases a variety of foods, including fruits and vegetables, to help supplement the diets of children participating in the NSLP and Child and Adult Care Food Program. A recent evaluation of the foods distributed through these programs revealed that the overall quality of the mix of foods was considerably healthier than typical U.S. diets, including a greater proportion of fruits and vegetables (Zimmerman et al., 2012).
The prominence of healthy food offerings at schools and other food service operations is important because of the power of “optimal defaults.” This term refers to the provision of pre-selected, best interest options as the default, while still allowing free choice (Radnitz et al., 2013). It has long been known to be enormously influential in areas such as organ donation and retirement savings, and it has more recently been tried with success in schools by, for example, putting carrot sticks within easier reach than the French fries in the lunch line.
Consumers Level
Numerous economic, social, and behavioral factors affect consumers’ fruit and vegetable choices, only some of which are under their control. Spending on foods for at-home consumption is out of line with dietary recommendations: The average U.S. household underspends on vegetables (except potatoes) and whole fruits as well as whole grains, low-fat dairy, nuts, poultry and fish; it overspends on refined grains, fruit juices, whole-fat dairy, red meats, beverages, sugar, and candies (Volpe and Okrent, 2012).
Prices of fruits and vegetables have risen faster than has the Consumer Price Index, but the latest data from USDA indicate that $2.50 was sufficient to meet an individual’s daily recommendations for these foods in 2008.
Food prices are lower in suburban communities, where supermarkets are plentiful, and higher in central cities, where retail food stores tend to be smaller. Retail food prices are highest in the Northeast and West and lowest in the Midwest and South. The regional variation in food prices can be explained by differences in consumer demand, distribution, and operating costs, and the presence or absence of warehouse stores such as Costco and Walmart.
In addition to affordability, availability of fruits and vegetables where individuals live and work is an important factor that can affect decisions to consume healthful diets. Bodor et al. (2008) found that availability of vegetables within 100 m (300 ft) of a residence was positively associated with vegetable intake. Each additional meter of shelf space devoted to vegetables within the retail outlet was associated with one-third of a serving per day of increased intake.
Nutrition knowledge is positively associated with making healthful food choices, including more dark green and deep yellow vegetables and tomatoes and fewer fried potatoes (Guthrie, 2004). However, fewer than 2 percent of adults can correctly identify how much they should consume of all food groups. Use of food labels when buying food has declined since the mid-1990s. However, they do not indicate how many cups of fruits and vegetables are contained in a product.
Although the diets of nearly all Americans fare poorly when compared with recommendations (Krebs-Smith et al., 2010), some subgroups are doing worse than others. In an analysis comparing dietary intakes among income groups, adults in the high-income group generally had greater adherence to recommendations than did the low- and middle-income groups. Intakes of whole fruits, total vegetables, and some vegetable subgroups are especially concerning among lower-income groups and non-Hispanic blacks (Kirkpatrick et al., 2012). French fry consumption does not vary by income, but high-income consumers were found to eat more celery, garlic, cucumbers, peppers, mushrooms, and tomatoes than did other groups (Lin et al., 2004).
Obviously, the constraint of limited resources makes choosing a healthful diet that much less likely for low-income households. The minimal cost of a healthy diet, as estimated by USDA’s Thrifty Food Plan (TFP), was $146 per week for a four-person household in 2013 (CNPP, 2014). According to the TFP, nearly half of that should go toward fruits and vegetables, but in 2008 they accounted for only 16 to 18 percent of at-home food dollars for both low- and high-income households. Furthermore, low-income households spend less on total food purchases than the cost of the TFP. Low-income women who work full time spend an average of only
46 minutes per day on meal preparation (Hamrick et al., 2011), and foods requiring minimal preparation are more expensive. Although a wide variety of fruits and vegetables are eligible for purchase through the Supplemental Nutrition Assistance Program (SNAP), the allowed products require preparation time, and ready-to-eat meals are not allowed for purchase. The extra time for preparation and perhaps unfamiliarity with preparation techniques can be a disincentive for increased fruit and vegetable consumption in this population. This illustrates the need to account for social considerations when attempting to change health outcomes.
Identify the Scenarios
To understand the effects of a new intervention, policy, or technology, an assessment compares the performance of the current system as described in the scope—the baseline—with one or more alternative scenarios that reflect the proposed change. For this example, an assessment team would compare the current supply and consumption of fruits and vegetables (baseline) with an alternative scenario in which supply and consumption are in accordance with recommendations. It implies a hypothetical change in the distribution of many commodities in the American diet, because fruits and vegetables would be expected to replace other foodstuffs that are currently consumed in excess. The step also would involve identifying what elements of the food system could affect that change, and what the ripple effects would be in health, environmental, and social spheres. There is some question whether a change of the magnitude required for intakes to match recommendations is realistic.
Conduct the Analysis
In this step of an assessment, data, metrics, and analysis tools are used to examine the likely health, environmental, social, and economic effects associated with the alternative scenario. Before beginning an analysis, it is always a good idea to determine what types of assessments have been done previously related to the problem or question.
Previous Analyses
Previous assessments have been relatively few in number but may be useful in providing data that could be used as inputs for future simulations or other complex analyses. These analyses focused on three key questions.
What changes might be necessary to alter the inducements and barriers to fruit and vegetable consumption throughout the food system? The percep-
tion that fruits and vegetables are expensive relative to other foods has raised the question of whether increasing incomes might overcome the potential barrier of price. Frazao et al. (2007) examined how individuals might change their spending on different categories of food if provided with additional income, and how this might vary across income levels. They used the Bureau of Labor Statistics’ Consumer Expenditure Survey data on household food purchases and considered all forms of fruits and vegetables—fresh as well as canned, frozen, dried, and juice. Low-income households were found to spend 26 cents of every food dollar on food away from home; the remainder was spent on groceries, of which only 12 cents was spent on fruits and vegetables. As incomes rose, more money was spent on food in absolute terms, but the percentage of income spent on food declined. Furthermore, the greater spending on food with rising incomes was more likely to be on food away from home or non-staple foods, such as snack foods, sweets, fats and oils, and beverages. The authors concluded that additional income or untargeted food assistance was unlikely to improve fruit and vegetable consumption.
Another study examined the effect of targeted price incentives, which may have a different effect on consumer behavior than would increased income. The Healthy Incentives Pilot (HIP) was a relatively small-scale program (HIP, 2014) designed to determine whether point-of-sale incentives within SNAP would encourage the purchase of healthy foods. The treatment group received 30 cents back on their benefits card for every dollar spent on targeted fruits and vegetables, and their subsequent intakes of fruits and vegetables were compared to those of a control group. The treatment group consumed 25 percent more fruits and vegetables than did the control group, with more of the observed difference being due to vegetables (60 percent) than fruits (40 percent). Nearly all participants in the Healthy Incentives Pilot indicated they would like to continue in the program, and HIP households more frequently had fruits and vegetables available at home than did households in the control group.
The societal trend in consuming ever more food away from home also has been examined as a barrier to fruit and vegetable intakes. Todd et al. (2010) compared meals consumed away from home to those at home in terms of their influence on food group intakes among adults. They found that meals consumed away from home contained fewer servings of whole fruit and dark green and orange vegetables per 1,000 kcal, but that these effects varied by meal. The density of fruit in snacks eaten away from home was 9 percent less than those eaten at home, whereas breakfast, lunch, and dinner were 18, 22, and 16 percent less, respectively. Differences were more extreme for whole fruits. Differences in dark green and orange vegetables were greater at dinner (31 percent less) than at lunch (11 percent less).
What changes would be needed throughout the food supply chain in order for fruit and vegetable intakes of the U.S. population to conform to, or move in the direction of, guidance? The most recent assessment to have examined the divide between fruit and vegetable intakes and their recommendations was an examination of the 2007-2010 National Health and Nutrition Examination Survey (NHANES) (NCI, 2014) data, which reported on the distribution of intakes and the prevalence of intakes below the recommendation. That analysis indicated 25 percent of the population consumed less than half a cup of fruit per day, and 75 percent of the population had intakes below the minimum recommendation for their sex–age group. Considering vegetables, the usual intake at the 75th percentile for the entire population was two cups per day; 87 percent of the population had a usual intake below the minimum recommendation for their sex–age group, with percentages running even higher for adolescents and young adults. In short, nearly the entire U.S. population consumes a diet with fewer vegetables than recommended and a large majority underconsume fruits relative to recommendations.
A number of studies have examined the extent of change necessary for different levels of the food supply chain to realize concordance with fruit and vegetable recommendations. Kantor (1998) developed the Loss Adjusted Food Availability Data to examine the nation’s aggregate supply of food in relation to dietary guidelines. In an early analysis of those data, Young and Kantor (1999) found that if Americans were to follow dietary recommendations, changes would be needed in the type and quantity of food produced and where and how it is produced. Furthermore, adjustments would be needed in “agricultural production, trade, non-food uses and prices” as well as the “crop acreage devoted to food and feed.” Buzby et al. (2006) replicated that analysis in 2006 and reached similar conclusions. However, although these studies suggest that changes in production and trade of fruits and vegetables would be needed if the U.S. population were to follow dietary guidelines, they did not imply that such changes would be sufficient to induce the public to eat more fruits and vegetables. Understanding the impediments to eating more fruits and vegetables and determining how to overcome them would also be needed.
McNamara et al. (1999) took these analyses a step further by examining the gap between the current food supply and the estimated future demand for food commodities, based on a hypothetical population-wide adoption of the DGA and Census projections. The projected population growth over 20 years meant that supplies of commodities that people are advised to eat more of needed to increase dramatically. Substantial increases in supplies of fruit and most subgroups of vegetables were found to be needed to close the gap between then-current and future intakes. The magnitude of the gap between intakes and the projections suggested “the need
for continued increases in agricultural productivity, higher resource use, and greater levels of international trade.” Others have examined marketing and retail influences on the extent to which the food supply conforms to dietary guidelines, and they have concluded that lower prices for some commodities may be needed (Kinsey and Bowland, 1999).
What would be the expected environmental, social, and acute and chronic health effects of changes in fruit and vegetable consumption? In a landmark study, Doll and Peto (1981) estimated the number of avoidable cancer deaths in the United States if diets were to conform to dietary recommendations. The changes they considered included not just the addition of fruits and vegetables, but rather the substitution of fruits, vegetables, and whole grains for meat, refined grains, and sugars in the diet. Their estimate that about one-third of cancer deaths could be prevented with dietary changes was a revelation. Willett (1995) reexamined this issue and determined the original estimate was still appropriate, although he estimated that the confidence interval around the estimate could be narrowed. The World Cancer Research Fund and the American Institute for Cancer Research issued a comprehensive review of food, physical activity, and the prevention of cancer in 2007 (WCRF/AICR, 2007). Although that report did not provide an estimate of prevented cancers across all types, it found “probable” associations between many fruits and vegetables and the prevention of cancers of the mouth, pharynx, larynx, esophagus, and stomach.
Several studies have examined the environmental effects of widespread shifts away from a meat-centric diet toward a more plant-based diet. Peters et al. (2007) found that diets higher in meat generally increased land requirements, but this varied by the amount of fat in the diet, so that high-fat vegetarian diets had a greater environmental footprint than did lower-fat diets with a small amount of meat. Land-use requirements for different types of diets vary not only in quantity but in quality as well. Meat-centric diets rely on greater amounts of land that can be used for pasture or hay, whereas plant-based diets require relatively more land that is only suitable for cultivated crops. Individual food rankings regarding environmental impact can shift dramatically, depending on whether emissions generated as a result of production is measured per kilogram or per 1,000 calories (EWG, 2011; Haspel, 2014).
New Analyses
Each of these previous analyses has focused on relatively narrow sections of the food supply chain and thus provides only limited insights. A more holistic assessment would likely result in a more comprehensive
understanding of the nature of the problem, the viability of various solutions, and the trade-offs to be expected if change could be enacted.
One type of analysis suggested from the committee’s framework is agent-based modeling (ABM), which could be used to identify the inducements and barriers to fruit and vegetable consumption throughout the food system, and how consumption might respond to shifts. The individual-level focus of ABM and its ability to capture heterogeneity (e.g., in socioeconomic status [SES] or body mass index), spatial effects (e.g., food availability and advertising), and adaptation (e.g., formation of preferences or habits) would help to address important features of this question. An ABM might take as inputs starting distributions of consumption and SES, spatial configurations, and exposure conditions, and it might yield as outputs key metrics such as means and distributions of fruit and vegetable intakes across the population (and across subgroups).
Another type of analysis well suited for questions raised in this example is system dynamics modeling, which could be used to assess the magnitude and timing of changes that might be needed in order for fruit and vegetable intakes of the U.S. population to attain (or move in the direction of) guidelines. By capturing a broad set of factors in the system, along with dynamic processes like feedback and delay, a system dynamics model might provide system-level insights. Such a model might allow mapping of varying magnitudes of shifts in input assumptions (e.g., about production or advertising) into corresponding expected shifts in key outcome metrics like per-capita quantities of fruits and vegetables in the U.S. food supply.
A third type of an analysis—life cycle assessment—could be used to examine what the health, environmental, and social effects of such a change might be. The important feature of life cycle assessment is that it assesses impacts across the full spectrum of a product’s life cycle. In the case of fruits and vegetables, and other foods that would replace them in the diet, the life cycle coincides with the food supply chain. Starting with the seeds and other farm inputs, and ending with consumption and waste, the life cycles of various food commodities are associated with numerous health, environmental, social, and economic effects. Some of these, such as improved health outcomes as a result of dietary changes, can take many years to be realized (and measured). Key effects expected to emerge in this case would depend on the extent of the increase in fruit and vegetable intakes and the concomitant changes, if any, in the intakes of other food commodities. Analyses of this type would probably look for changes in:
- The health of the population (nutritional status, chronic disease incidence); incidence of foodborne illnesses; and health of farm workers and food producers (potentially greater risk of injury or exposure to harmful chemicals).
- Environmental effects (unless dominant farming practices changed, there would be greater use of fertilizers, pesticides, and other chemicals to produce the fruits and vegetables).
- Social and economic effects (fruit and vegetable production requires a supply of seasonal workers, so employment would be affected, and immigration policies could dramatically affect availability of workers). If fruits and vegetables replace other calories in the diet, sales of other foods would go down, which may have economic effects on other commodity markets. Also, there may be synergistic effects among the areas above.
REFERENCES
AMS (Agriculture Marketing Service). 2014a. National count of farmers market directory listing graph: 1994-2013. http://www.ams.usda.gov/AMSv1.0/ams.fetchTemplateData.do?template=TemplateS&leftNav=WholesaleandFarmersMarkets&page=WFMFarmersMarketGrowth&description=Farmers%20Market%20Growth (accessed March 21, 2014).
AMS. 2014b. Research and promotion programs. http://www.ams.usda.gov/AMSv1.0/lsmarketingprograms (accessed March 21, 2014).
Bodor, J. N., D. Rose, T. A. Farley, C. Swalm, and S. K. Scott. 2008. Neighbourhood fruit and vegetable availability and consumption: the role of small food stores in an urban environment. Public Health Nutrition 11(4):413-420.
Buzby, J. C., H. F. Wells, and G. Vocke. 2006. Possible implications for U.S. agriculture from adoption of select dietary guidelines. Agricultural Economic Report No. 31. Washington, DC: U.S. Department of Agriculture, Economic Research Service.
Calvin, L., and P. Martin. 2010. Labor-intensive US fruit and vegetable industry competes in a global market. Amber Waves. Washington, DC: U.S. Department of Agriculture, Economic Research Service.
CNAS and TAMU (Center for North American Studies and Texas A&M University). 2007. An initial assessment of the economic impacts of E. coli on the Texas spinach industry. CNAS Issue Brief. http://cnas.tamu.edu/Spinach%20E%20Coli%20Impacts%20Final.pdf (accessed December 30, 2014).
CNPP (Center for Nutrition Policy and Promotion). 2014. USDA food plans: Cost of food report for December 2013. http://www.cnpp.usda.gov/USDAFoodPlansCostofFood/reports (accessed December 30, 2014).
Cohen, D. A. 2014. A big fat crisis: The hidden forces behind the obesity epidemic—and how we can end it. New York: Nation Books.
Doll, R., and R. Peto. 1981. The causes of cancer: Quantitative estimates of avoidable risks of cancer in the United States today. Journal of the National Cancer Institute 66(6):1191-1308.
ERS (Economic Research Service). 2014a. Fruits and tree nuts: Overview. http://www.ers.usda.gov/topics/crops/fruit-tree-nuts.aspx (accessed March 21, 2014).
ERS. 2014b. Vegetables and pulses: Overview. http://www.ers.usda.gov/topics/crops/vegetables-pulses.aspx (accessed March 21, 2014).
EWG (Environmental Working Group). 2011. Meat eater’s guide to climate change and health. http://www.ewg.org/meateatersguide/ (accessed December 30, 2014).
Frazao, E., M. Andrews, D. Smallwood, and M. Prell. 2007. Can food stamps do more to improve food choices? An economic perspective—food spending patterns of low-income households: Will increasing purchasing power result in healthier food choices? Economic Information Bulletin No. EIB-29-4. Washington, DC: U.S. Department of Agriculture, Economic Research Service.
Guthrie, J. 2004. Understanding fruit and vegetable choices: Economic and behavioral influences. Agriculture Information Bulletin No. 792-1. Washington, DC: U.S. Department of Agriculture, Economic Research Service.
Hamrick, K. S., M. Andrews, J. Guthrie, D. Hopkins, and K. McClelland. 2011. How much time do Americans spend on food? Washington, DC: U.S. Department of Agriculture, Economic Research Service.
Haspel, T. 2014. Vegetarian or omnivore: The environmental implications of diet. The Washington Post, March 10. http://www.washingtonpost.com/lifestyle/food/vegetarian-or-omnivore-the-environmental-implications-of-diet/2014/03/10/648fdbe8-a495-11e3-a5fa-55f0c77bf39c_story.html (accessed December 30, 2014).
HHS and USDA (U.S. Department of Health and Human Services and U.S. Department of Agriculture). 2014. Dietary guidelines for Americans. Previous guidelines and reports. http://www.health.gov/dietaryguidelines/pubs.asp (accessed November 21, 2014).
HIP (Healthy Incentives Pilot). 2014. Healthy Incentives Pilot. http://www.fns.usda.gov/hip/healthy-incentives-pilot (accessed December 30, 2014).
IOM (Institute of Medicine). 2006. Food marketing to children and youth: Threat or opportunity? Washington, DC: The National Academies Press.
Johnson, R. 2014. The U.S. trade situation for fruit and vegetable products. Congressional Research Service Report. http://www.fas.org/sgp/crs/misc/RL34468.pdf (accessed December 30, 2014).
Kantor, L. S. 1998. A dietary assessment of the U.S. food supply: Comparing per capita food consumption with Food Guide Pyramid serving recommendations. Washington, DC: U.S. Department of Agriculture, Economic Research Service.
Kinsey, J., and B. Bowland. 1999. How can the US food system deliver food products consistent with the Dietary Guidelines? Food marketing and retailing: An economist’s view. Food Policy 24(2-3):237-253.
Kirkpatrick, S. I., K. W. Dodd, J. Reedy, and S. M. Krebs-Smith. 2012. Income and race/ethnicity are associated with adherence to food-based dietary guidance among US adults and children. Journal of the Academy of Nutrition and Dietetics 112(5):624-635.
Kirkpatrick, S. I., J. Reedy, L. L. Kahle, J. L. Harris, P. Ohri-Vachaspati, and S. M. Krebs-Smith. 2014. Fast-food menu offerings vary in dietary quality, but are consistently poor. Public Health Nutrition 17(4):924-931.
Krebs-Smith, S. M., and L. S. Kantor. 2001. Choose a variety of fruits and vegetables daily: Understanding the complexities. Journal of Nutrition 131(2S-1):487S-501S.
Krebs-Smith, S. M., P. M. Guenther, A. F. Subar, S. I. Kirkpatrick, and K. W. Dodd. 2010. Americans do not meet federal dietary recommendations. Journal of Nutrition 140(10):1832-1838.
Larson, N. I., M. T. Story, and M. C. Nelson. 2009. Neighborhood environments: Disparities in access to healthy foods in the U.S. American Journal of Preventive Medicine 36(1):74-81.
Lin, B.-H., J. Reed, and G. Lucier. 2004. U.S. fruit and vegetable consumption: Who, what, where, and how much. Agriculture Information Bulletin No. 792-2. Washington, DC: U.S. Department of Agriculture, Economic Research Service.
McNamara, P. E., C. K. Ranney, L. S. Kantor, and S. M. Krebs-Smith. 1999. The gap between food intakes and the Pyramid recommendations: Measurement and food system ramifications. Food Policy 24(2-3):117-133.
NCI (National Cancer Institute). 2014. Usual dietary intakes: Food intakes, US population, 2007-10. http://appliedresearch.cancer.gov/diet/usualintakes/pop (accessed December 30, 2014).
NPR (National Public Radio). 2014. New rules would curb how kids are sold junk food at school. http://www.npr.org/blogs/thesalt/2014/02/25/282507974/new-rules-would-curb-how-kids-are-sold-junk-food-at-school (accessed May 9, 2014).
Painter, J. A., R. M. Hoekstra, T. Ayers, R. V. Tauxe, C. R. Braden, F. J. Angulo, and P. M. Griffin. 2013. Attribution of foodborne illnesses, hospitalizations, and deaths to food commodities by using outbreak data, United States, 1998-2008. Emerging Infectious Diseases 19(3):407-415.
Peters, C. J., J. L. Wilkins, and G. W. Fick. 2007. Testing a complete-diet model for estimating the land resource requirements of food consumption and agricultural carrying capacity: The New York state example. Renewable Agriculture and Food Systems 22(2):145-153.
Radnitz, C., K. L. Loeb, J. DiMatteo, K. L. Keller, N. Zucker, and M. B. Schwartz. 2013. Optimal defaults in the prevention of pediatric obesity: From platform to practice. Journal of Food and Nutritional Disorders 2(5):1-8.
Todd, J. E., L. Mancino, and B.-H. Lin. 2010. The impact of food away from home on adult diet quality. Washington, DC: U.S. Department of Agriculture, Economic Research Service.
UCS (Union of Concerned Scientists). 2013. The healthy farmland diet. Cambridge, MA: Union of Concerned Scientists. http://www.ucsusa.org/food_and_agriculture/solutions/expand-healthy-food-access/the-healthy-farmland-diet.html (accessed December 30, 2014).
USDA (U.S. Department of Agriculture). 2014. Nutrition Evidence Library. http://www.nel.gov (accessed March 21, 2014).
Volpe, R., and A. Okrent. 2012. Assessing the healthfulness of consumers’ grocery purchases. No. EIB-102. Washington, DC: U.S. Department of Agriculture, Economic Research Service.
WCRF and AICR (World Cancer Research Fund and American Institute for Cancer Research). 2007. Food, nutrition, physical activity, and the prevention of cancer: A global perspective. Washington, DC: AICR.
Wilde, P. 2014. U.S. Food Policy Blog. http://usfoodpolicy.blogspot.com/2014/02/usdareports-on-pizza-consumption-and.html (accessed October 28, 2014).
Willett, W. C. 1995. Diet, nutrition, and avoidable cancer. Environmental Health Perspectives 103(Suppl 8):165-170.
Young, C. E., and L. S. Kantor. 1999. Moving toward the food guide pyramid: Implications for US agriculture. Agricultural Economic Report No. 779. Washington, DC: U.S. Department of Agriculture, Economic Research Service.
Zimmerman, T. P., S. Dixit-Joshi, B. Sun, D. Douglass, J. Hu, F. Glantz, and E. Eaker. 2012. Nutrient and MyPyramid analysis of USDA foods in the NSLP, CACFP, CSFP, TEFAP, and FDPIR. Alexandria, VA: Food and Nutrition Service, Office of Research and Analysis.


