
Appendix A
Overview of Methodological Approaches, Data Sources, and Survey Tools
This series of reports on the Small Business Innovation Research (SBIR) programs at the Department of Defense (DoD), National Institutes of Health (NIH), National Aeronautics and Space Administration (NASA), Department of Energy (DoE), and National Science Foundation (NSF) represents a second-round assessment of the program undertaken by the National Academies of Sciences, Engineering, and Medicine.1 The first-round assessment, conducted under a separate ad hoc committee, resulted in a series of reports released from 2004 to 2009, including a framework methodology for that study and on which the current methodology builds.2
The current study is focused on the twin objectives of assessing outcomes from the programs and of providing recommendations for improvement.3 The
___________________
1Effective July 1, 2015, the institution is called the National Academies of Sciences, Engineering, and Medicine. References in this report to the National Research Council, or NRC, are used in an historic context identifying programs prior to July 1.
2National Research Council, An Assessment of the Small Business Innovation Research Program: Project Methodology (Washington, DC: The National Academies Press, 2004).
3The methodology developed as part of the Academies’ first-round assessment of the SBIR program also identifies two areas that are excluded from the purview of the study: “The objective of the study is not to consider if SBIR should exist or not—Congress has already decided affirmatively on this question. Rather, the NRC committee conducting this study is charged with providing assessment-based findings of the benefits and costs of SBIR . . . to improve public understanding of the program, as well as recommendations to improve the program’s effectiveness. It is also important to note that, in accordance with the Memorandum of Understanding and the Congressional mandate, the study will not seek to compare the value of one area with other areas; this task is the prerogative of the Congress and the Administration acting through the agencies. Instead, the study is concerned with the effective review of each area.” National Research Council, Assessment of the SBIR Program: Project
SBIR programs are unique efforts designed by Congress to provide funding via government agencies in pursuit of four objectives4:
- Stimulate technological innovation;
- Use small business to meet Federal research and development needs;
- Foster and encourage participation by minority and disadvantaged persons (including woman owners of small business) in technological innovation; and
- Increase private-sector commercialization innovation derived from Federal research and development.
The SBIR programs, on the basis of highly competitive solicitations, provide modest initial funding for selected Phase I projects (up to $150,000), and for feasibility testing and further Phase II funding (up to $1 million) for qualifying Phase I projects.
From a methodology perspective, assessing this program presents formidable challenges. Among the more difficult are the following:
- Lack of data. NSF does track outcomes data, but these data were not made available to us. There are no published or publicly available outcomes data.
- Intervening variables. Analysis of small innovative businesses suggests that they are often very path dependent and, hence, can be deflected from a given development path by a wide range of positive and negative variables. A single breakthrough contract—or technical delay—can make or break a company.
- Lags. Not only do outcomes lag awards by a number of years, but also the lag itself is highly variable. Some companies commercialize within 6 months of award conclusion; others take decades. And often, revenues from commercialization peak many years after products have reached markets.
ESTABLISHING A METHODOLOGY
The methodology utilized in this second-round study of the SBIR program builds on the methodology established by the committee that completed the first-round study.
___________________
Methodology. In implementing this approach in the context of the current round of SBIR assessments, the Committee has opted to focus more deeply on operational questions.
4Public Law 97–219, § 2, July 22, 1982, 96 Stat. 217.
Publication of the 2004 Methodology
The committee that undertook the first-round study and the agencies under study acknowledged the difficulties involved in assessing SBIR programs. Accordingly, that study began with development of the formal volume on methodology, which was published in 2004 after completing the standard Academies peer review process.5
The established methodology stressed the importance of adopting a varied range of tools based on prior work in this area, which meshes with the methodology originally defined by the first study committee. The first committee concluded that appropriate methodological approaches
“build from the precedents established in several key studies already undertaken to evaluate various aspects of the SBIR. These studies have been successful because they identified the need for utilizing not just a single methodological approach, but rather a broad spectrum of approaches, in order to evaluate the SBIR from a number of different perspectives and criteria.
This diversity and flexibility in methodological approach are particularly appropriate given the heterogeneity of goals and procedures across the five agencies involved in the evaluation. Consequently, this document suggests a broad framework for methodological approaches that can serve to guide the research team when evaluating each particular agency in terms of the four criteria stated above. Table A-1 illustrates some key assessment parameters and related measures to be considered in this study.”6
The tools identified in the illustration above include many of those used by the committee that conducted the first-round study of the SBIR program. Other tools emerged since the initial methodology review.
Tools Utilized in the Current SBIR Study
Quantitative and qualitative tools being utilized in the current study of the SBIR program include the following:
- Surveys. The Committee commissioned two extensive surveys of NSF SBIR award recipients as part of the analysis. These are described in depth below.7
- Case studies. The Committee commissioned in-depth case studies of 10 SBIR recipients at NSF. These companies were geographically and demographically diverse and were at different stages of the company lifecycle.
___________________
5National Research Council, Assessment of the SBIR Program: Project Methodology, p. 2.
6Ibid, p. 2.
7The surveys conducted as part of the current, second-round assessment of the SBIR program are referred to below as the “2011 Survey” and the “2010 Phase IIB Survey.”
TABLE A-1 Overview of Approach to SBIR Program Assessment
| SBIR Assessment Parameters → | Quality of Research | Commercialization of SBIR Funded Research/Economic and Non-economic Benefits | Small Business Innovation/ Growth | Use of Small Businesses to Advance Agency Missions |
| Questions | How does the quality of SBIR funded research compare with that of other government funded R&D? | What is the overall economic impact of SBIR funded research? What fraction of that impact is attributable to SBIR funding? | How to broaden participation and replenish contractors? What is the link between SBIR and state/regional programs? | How to increase agency uptake while continuing to support high risk research |
| Measures | Peer review scores, Publication counts, Citation analysis | Sales; follow up funding; progress; IPO | Patent counts and other IP/ employment growth, number of new technology firms | Agency procurement of products resulting from SBIR work |
| Tools | Case studies, agency program studies, study of repeat winners, bibliometric analysis | Phase II surveys, program manager surveys, case studies, study of repeat winners | Phase I and Phase II surveys, case studies, study of repeat winners, bibliometric analysis | Program manager surveys, case studies, agency program studies, study of repeat winners |
| Key Research Challenges | Difficulty of measuring quality and of identifying proper reference group | Skew of returns; significant interagency and inter-industry differences | Measures of actual success and failure at the project and firm level; relationship of federal and state programs in this context | Major interagency differences in use of SBIR to meet agency missions |
NOTE: Supplementary tools may be developed and used as needed. In addition, since publication of the methodology report, this Committee has determined that data on outcomes from Phase I awards are of limited relevance.
SOURCE: National Research Council, An Assessment of the Small Business Innovation Research Program: Project Methodology (Washington, DC: The National Academies Press, 2004), Table 1, p. 3.
- Workshops. The Committee convened several workshops to allow stakeholders, agency staff, and academic experts to provide insights into the program’s operations, as well as to identify questions that should be addressed.
- Analysis of agency data. NSF provided the Committee with a range of datasets covering various aspects of agency SBIR activities. The Committee analyzed and included these data as appropriate.
- Open-ended responses from SBIR recipients. For the first time, the Committee solicited textual survey responses in the context of the 2011 Survey. More than 400 recipients provided narrative comments.
- Agency interviews. The Committee discussed program operations with NSF staff. Most were helpful in providing information both about the program and the challenges that they faced.
- Literature review. Since the start of our research in this area, a number of papers have been published addressing various aspects of the SBIR program. In addition, other organizations—such as the Government Accountability Office (GAO)—have reviewed particular parts of the SBIR program. The Committee where useful has included references to these works in the course of this analysis.
Taken together with our deliberations and the expertise brought to bear by our individual members, these tools provide the primary inputs into the analysis.
We would stress that, for the first-round study and for the current study, multiple research methodologies feed into every finding and recommendation. No findings or recommendations rested solely on data and analysis from Academies surveys; conversely, survey data was used to support analysis throughout the report.
COMMERCIALIZATION METRICS AND DATA COLLECTION
Recent congressional interest in the SBIR program has to a considerable extent focused on bringing innovative technologies to market. This enhanced attention to the economic return from public investments made in small business innovation is understandable.
However, in contrast to the Department of Defense, which may procure selected SBIR technologies, commercialization at NSF takes place solely in private-sector markets; to a considerable extent, NSF has defined successful commercialization in the past as projects that reach the market—where at least $1 of sales or revenues has been generated.
In its 2008 report on the NSF SBIR program,8 the Academies committee charged with the first-round assessment held that a binary metric of commer-
___________________
8National Research Council, An Assessment of the SBIR Program at the National Science Foundation, (Washington, DC: The National Academies Press, 2008).
cialization was insufficient. It noted that the scale of commercialization is also important and that there are also other important milestones both before and after the first dollar in sales that should be included in an appropriate approach to measuring commercialization.
Challenges in Tracking Commercialization
Despite substantial efforts at NSF, described below, significant challenges remain in tracking commercialization outcomes for the NSF SBIR program. These include the following:
- Data limitations. NSF, like most other agencies, does not maintain an electronic reporting system for post-award data, nor are companies penalized for failing to report outcomes. In addition, companies face few incentives to report their successes and failures in commercialization.
- Linear linkages. Tracking efforts usually seek to link a specific project to a specific outcome. Separating the contributions of one project is difficult for many companies, given that multiple projects typically contribute to both anticipated and unanticipated outcomes.
- Lags in commercialization. Data from the extensive DoD commercialization database suggests that most projects take at least 2 years to reach the market after the end of the Phase II award. They do not generate peak revenue for several years after this. Therefore, efforts to measure program productivity must take these significant lags into account.
- Attribution problems. Commercialization is often the result of several awards, not just one, as well as other factors, such that attributing company-level success to specific awards is challenging at best.
Why New Data Sources Are Needed
Congress often seeks evidence about the effectiveness of programs or indeed about whether they work at all. This interest has in the past helped to drive the development of tools such as the Company Commercialization Report (CCR) at DoD, which captures the quantitative commercialization results of companies’ prior Phase II projects. However, in the long-term the importance of tracking may rest more in its use to support program management. By carefully analyzing outcomes and CCR’s associated program variables, program managers will be able to manage their SBIR portfolios more successfully.
In this regard, the NSF SBIR program can benefit from access to the Academies survey data. The survey work provides quantitative data necessary to provide an evidence-driven assessment and, at the same time, allows management to focus on specific questions of interest. For example, it focused in particular on the impact of Phase IIB awards—an important NSF initiative, for which the
survey’s outcomes provided the first hard evidence of effectiveness. (The Phase IIB program is discussed in detail in Chapter 5.)
THE ACADEMIES SURVEY ANALYSIS
Traditional modes of assessing the NSF SBIR program include case studies, interviews, and other qualitative methods of assessment. These remain important components of the Academies’ overall methodology, and a chapter in the current report is devoted to lessons drawn from case studies. But qualitative assessment alone is insufficient. This study thus also draws on the results of two surveys conducted on our behalf by Grunwald Associates LLC—the 2010 Phase IIB Survey and the 2011 Survey.
The 2011 Survey
The 2011 Survey offers some significant advantages over other data sources. Specifically, it
- provides a rich source of textual information in response to open-ended questions;
- probes more deeply into company demographics and agency processes;
- for the first time addresses principal investigators (PIs), not just company business officials;
- allows comparisons with previous data-collection exercises;
- generates the first comparative data on Phase IIB9; and
- addresses other congressional objectives for the program beyond commercialization.
For these and other reasons, we determined that a survey would be the most appropriate mechanism for developing quantitative approaches to the analysis of the SBIR programs. At the same time, however, we are fully cognizant of the limitations of survey research in this case. Box A-1 describes a number of areas where caution is required when reviewing results.
To take account of these limits, while retaining the utility and indeed explanatory power of survey-based methodology, the current report contextualizes the data by comparing results to those from the Academies survey conducted as part of the first-round assessment of the SBIR program (referred to below as the “2005 Survey”). This report also adds transparency by publishing the number of responses for each question and indeed each subgroup. As noted later in the discussion, the use of a control group was found infeasible for comparing
___________________
9This comparison is made possible through the incorporation of data from the 2010 Phase IIB Survey, discussed later in this appendix.
BOX A-1
Multiple Sources of Bias in Survey Responsea
Large innovation surveys involve multiple sources of potential bias that can skew the results in different directions. Some potential survey biases are noted below.
- Successful and more recently funded companies are more likely to respond. Research by Link and Scott demonstrates that the probability of obtaining research project information by survey decreases for less recently funded projects and increases the greater the award amount.b Nearly 75 percent of Phase II respondents to the 2011 Survey received awards after 2003, largely because winners from more distant years are difficult to reach: small businesses regularly cease operations, are acquired, merge, or lose staff with knowledge of SBIR awards. This may skew commercialization results downward, because more recent awards will be less likely to have completed the commercialization phase.
- Non-respondent bias. Very limited information is available about SBIR award recipients: company name, location, and contact information for the PI and the company point of contact, agency name, and date of award (data on woman and minority ownership are not considered reliable). No detailed data are available on applicants who did not win awards. It is therefore not feasible to undertake detailed analysis of non-respondents, but the possibility exists that they would present a different profile than would respondents.
- Success is self-reported. Self-reporting can be a source of bias, although the dimensions and direction of that bias are not necessarily clear. In any case, policy analysis has a long history of relying on self-reported performance measures to represent market-based performance measures. Participants in such retrospective analyses are believed to be able to consider a broader set of allocation options, thus making the evaluation more realistic than data based on third-party observation.c In short, company founders and/or PIs are in many cases simply the best source of information available.
- Survey sampled projects from PIs with multiple awards. Projects from PIs with large numbers of awards were under-represented in the sample, because PIs could not be expected to complete a questionnaire for each of numerous awards over a 10-year time frame.
- Failed companies are difficult to contact. Survey experts point to an “asymmetry” in the survey’s ability to include failed companies for follow-up surveys in cases where the companies no longer exist.d It is worth noting that one cannot necessarily infer that the SBIR project failed; what is known is only that the company no longer exists.
- Not all successful projects are captured. For similar reasons, the survey could not include ongoing results from successful projects in companies that merged or were acquired before and/or after commercialization of the project’s technology.
- Some companies are unwilling to fully acknowledge SBIR contribution to project success. Some companies may be unwilling to acknowledge that they received important benefits from participating in public programs for a variety
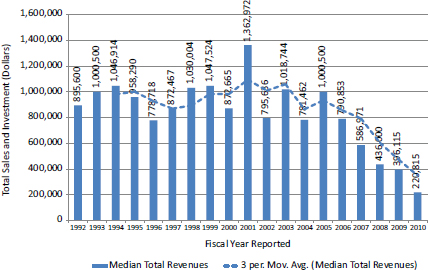
FIGURE BOX A-1 The impact of commercialization lag.
SOURCE: DoD Company Commercialization Database.
-
of reasons. For example, some may understandably attribute success exclusively to their own efforts.
- Commercialization lag. Although the 2005 Survey broke new ground in data collection, the amount of sales made—and indeed the number of projects that generate sales—are inevitably undercounted in a snapshot survey taken at a single point in time. On the basis of successive data sets collected from National Institutes of Health (NIH) SBIR award recipients, it is estimated that total sales from all responding projects will be considerably greater than can be captured in a single survey.e This underscores the importance of follow-on research based on the now-established survey methodology. Figure Box A-1 illustrates this impact in practice: projects from 2006 onward have not yet completed commercialization as of August 2013.
___________________
a The limitations described here are drawn from the methodology outlined for the previous Academies survey in National Research Council, An Assessment of the SBIR Program at the Department of Defense, (Washington, DC: The National Academies Press, 2009).
b Albert N. Link and John T. Scott, Evaluating Public Research Institutions: The U.S. Advanced Technology Program’s Intramural Research Initiative (London: Routledge, 2005).
c While economic theory is formulated on what is called “revealed preferences,” meaning that individuals and companies reveal how they value scarce resources by how they allocate those resources within a market framework, quite often expressed preferences are a better source of information, especially from an evaluation perspective. Strict adherence to a revealed preference paradigm could lead to misguided policy conclusions because the
paradigm assumes that all policy choices are known and understood at the time that an individual or company reveals its preferences and that all relevant markets for such preferences are operational. See Gregory G. Dess and Donald W. Beard, “Dimensions of Organizational Task Environments,” Administrative Science Quarterly 29(1984):52-73; (2) Albert N. Link and John T. Scott, Public Accountability: Evaluating Technology-Based Institutions (Norwell, MA: Kluwer Academic Publishers, 1998).
d Albert N. Link and John T. Scott, Evaluating Public Research Institutions: The US Advanced Technology Program’s Intramural Research Initiative (London: Routledge, 2005.
e Data from the Academies assessment of the SBIR program at NIH indicate that a subsequent survey taken 2 years later would reveal substantial increases in both the percentage of companies reaching the market and the amount of sales per project. See National Research Council, An Assessment of the SBIR Program at the National Institutes of Health, (Washington, DC: The National Academies Press, 2009).
Phase II and Phase I recipients, but feasible for comparing Phase IIB and Phase II recipients.
We contracted with Grunwald Associates LLC to administer a survey to award recipients. The 2011 Survey is built closely on the 2005 Survey, but is also adapted to draw on lessons learned and includes some important changes discussed in detail below. A subgroup of this Committee with particular expertise in survey methodology also reviewed the survey and drew in current best practices. The 2010 Phase II/IIB survey covered only NSF, while the 2011 survey covered NSF, DoD, and NASA simultaneously.10
The primary objectives of the 2011 Survey (in combination with the 2010 Phase IIB Survey) were as follows:
- Provide an update of the program “snapshot” taken in 2005, maximizing the opportunity to identify trends within the program.
- Probe more deeply into program processes, with the help of expanded feedback from participants and better understanding of program demographics.
- Reduce costs and shrink the time required by combining three 2005 questionnaires—for the company, Phase I, and Phase II awards, respectively—into a single 2011 Survey questionnaire.
___________________
10Delays at NIH and DoE in contracting with the Academies combined with the need to complete work contracted with DoD NSF and NASA led the Committee to proceed with the survey at three agencies only.
The survey was therefore designed to collect the maximum amount of data, consistent with our commitment to minimizing the burden on individual respondents.
In light of these competing considerations, we decided that it would be more useful and effective to administer the survey to PIs—the lead researcher on each project—rather than to the registered company point of contact (POC), who in many cases would be an administrator rather than a researcher. This decision was reinforced by difficulties in accessing current POC information. Key areas of overlap between the 2005 and 2011 surveys are captured in Table A-2.
Starting Date and Coverage
The 2011 Survey included awards made from fiscal year FY1998 to FY2007 inclusive. This end date allowed completion of Phase II-awarded projects (which
TABLE A-2 Similarities and Differences: 2005 and 2011 Surveys
| Item | 2005 Survey | 2011 Survey |
| Respondent selection | ||
| Focus on Phase II winners | ||
| All qualifying awards | ||
| PIs | ||
| POCs | ||
| Max number of questionnaires per respondent | < 20 | 2 |
| Distribution | ||
| No | ||
| Telephone follow-up | ||
| Questionnaire | ||
| Company demographics | Identical | Identical |
| Commercialization outcomes | Identical | Identical |
| IP outcomes | Identical | Identical |
| Woman and minority participation | ||
| Additional detail on minorities | ||
| Additional detail on PIs | ||
| New section on agency staff | ||
| New section on company recommendations for SBIR | ||
| New section capturing open-ended responses | ||
nominally fund 2 years of research) and provided a further 2 years for commercialization. This time frame was consistent with the previous Academies survey, administered in 2005, which surveyed awards from FY1992 to FY2001. It was also consistent with a previous GAO study, which in 1991 surveyed awards made through 1987.
The aim of setting the overall time frame at 10 years was to reduce the impact of difficulties generating information about older awards, because some companies and PIs may no longer be in place and memories fade over time. Reaching back to awards made in 1998 while ensuring comparability generated few results from older awards.
Determining the Survey Population
Following the precedent set by both the original GAO study and the first round of Academies analysis, this Committee differentiates between the total population of SBIR recipients, the preliminary survey target population, and the effective population for this study, which is the population of respondents that were reachable.
Initial Filters for Potential Recipients
Determining the effective study population required the following steps:
- acquisition of data from the sponsoring agencies—DoD, NSF, and NASA—covering record-level lists of award recipients;
- elimination of records that did not fit the protocol agreed upon by the Committee—namely, a maximum of two questionnaires per PI (in cases where PIs received more than two awards), awards were selected first by agency (NASA, NSF, DoD, in that order), then by year (oldest first), and finally by random number; and
- elimination of records for which there were significant missing data—in particular, where emails and/or contact telephone numbers were absent.
This process of excluding awards either because they did not fit the selection profile approved by the Committee or because the agencies did not provide sufficient or current contact information reduced the total award list provided by the agencies to a preliminary survey population of approximately 15,000 awards.
Secondary Filters to Identify Recipients with Active Contact Information
This nominal population still included many potential respondents whose contact information was complete but who were no longer associated with the contact information provided and hence effectively unreachable. This is unsur-
prising given that there is considerable turnover in both the existence of and the personnel working at small businesses, and the survey reaches back 13 years to awards made in FY1998. Recipients may have switched companies, the company may have ceased to exist or been acquired, or telephone and email contacts may have changed, for example. Consequently, we utilized two further filters to help identify the effective survey population.
- First, contacts for which the email address bounced twice were eliminated. Because the survey was delivered via email, the absence of a working email address disqualified the recipient. This eliminated approximately 30 percent of the preliminary population.
- Second, email addresses that did not officially “bounce” (i.e., return to sender) may still in fact not be active. Some email systems are configured to delete unrecognized email without sending a reply; in other cases, email addresses are inactive but not deleted. So a non-bouncing email address did not equal a contactable PI.
In order to identify non-reachable PIs, the Committee undertook an extensive telephone survey. For NSF, telephone calls were made to every targeted award recipient in the preliminary survey population that did not respond to the initial email invitation to participate.
Deployment
The 2011 Survey opened on October 4, 2011, and was deployed by email, with voice follow-up support. Up to four emails were sent to the effective population (emails discontinued once responses were received). In addition, two voice mails were delivered to non-respondents between the second and third and between the third and fourth rounds of email. In total, up to six efforts were made to reach each questionnaire recipient. After the members of the data subgroup of our committee concluded that sufficient data for the purposes had been collected, the survey closed on December 19, 2011. It was open for a total of 11 weeks.
Response Rates
Standard procedures were followed to conduct the survey. These data collection procedures were designed to increase response to the extent possible within the constraints of a voluntary survey and the survey budget. The population surveyed is a difficult one to contact and obtain responses from as evidence from the literature shows. Under these circumstances, the inability to contact and obtain responses always raises questions about potential bias of the estimates that cannot be quantified without substantial extra efforts that would require resources beyond those available for this work.
The lack of detailed applications data from the agency makes it impossible to estimate the possible impact of non-response bias. We, therefore, have no evidence either that non-response bias exists or that it does not.
Table A-3 shows the response rates at NSF by phase, based on both the preliminary study population prior to adjustment and the effective study population after all adjustments. The results are only for the 2011 Survey, and do not include data from the 2010 Phase IIB Survey.
All subsequent references to the 2011 Survey in this report address only responses for awards made by NSF.
Effort at Comparison Group Analysis
Several readers of the reports in the first round analysis of SBIR suggested the inclusion of comparison groups in the analysis. The Committee concurred that this should be attempted. There is no simple and easy way to acquire a comparison group for Phase II SBIR awardees. These are technology-based companies at an early stage of company development, which have the demonstrated capacity to undertake challenging technical research and to provide evidence that they are potentially successful commercializers. Given that the operations of the SBIR program are defined in legislation and limited by the Policy Guidance provided by SBA, randomly assigned control groups were not a possible alternative. Efforts to identify a pool of SBIR-like companies were made by contacting the most likely sources—Dunn and Bradstreet and Hoovers—but these efforts were not successful, as insufficiently detailed and structured information about companies was available.
In response, this Committee sought to develop a comparison group from among Phase I awardees that had not received a Phase II award from the three surveyed agencies (DoD, NSF, and NASA) during the award period covered by
TABLE A-3 2011 Survey Response Rates at NSF
| Preliminary population | 996 |
| Missing contact information | –212 |
| Contact moved/uncontactable | –376 |
| Effective population | 408 |
| Responses | 186 |
| Surveys as Percentage of Awards Contacted | 45.6 |
| Surveys as Percentage of Sample | 18.7 |
SOURCE: 2011 Survey, without inclusion of data from Phase IIB.
the survey (1999-2008). After considerable review, however, we concluded that the Phase I-only group was not appropriate for use as a statistical comparison group.
Including Results from the 2010 Phase IIB Survey
The 2010 Phase IIB Survey of NSF Phase II awards was carried out with the objective of comparing outcomes between award recipients receiving standard Phase II awards and those receiving Phase IIB enhancements in addition. This survey generated interesting responses and highlighted some important differences between the groups, and these are addressed in Chapter 5. A detailed discussion of the methodology for the 2010 Phase II Survey appears later in this appendix.
In addition, for purposes of analyzing the NSF program as a whole, Phase II responses from the 2010 and 2011 surveys were combined in cases where the questions asked were identical. This decision was reinforced by the fact that all of the respondents to the 2010 survey were excluded from the population of potential recipients for the 2011 Survey, on the grounds that the responses would to a considerable degree involve answering identical questions.
To conclude, we aggregated into the combined dataset the 2011 Survey analysis as well as all responses from the Phase IIB Survey where the wording of questions and responses was identical to that for the 2011 survey. In these cases, the inclusion of Phase IIB Survey responses is reflected in the number of responses reported for each question.
NSF Responses and Respondents
Table A-4 shows NSF SBIR responses by year of award. The survey primarily reached companies that were still in business: overall, 94 percent of respondents indicated that the companies were still in business.11
2010 Phase IIB Survey
The initial challenge in examining the NSF Phase IIB program was to develop data on which to base the assessment and hence eventual recommendations. Like most research and development (R&D) programs, there are only limited data available on both the program itself and its outcomes, and many of these—including the survey data developed by the Academies during the first-round assessment of the SBIR program—were in need of updating. Accordingly, the Committee determined that along with case studies and interviews with agency staff, it would be appropriate to survey participants in Phase IIB projects.
___________________
112011 Survey, Question 4A.
TABLE A-4 SBIR Responses by Year of Award (Percent Distribution)
| Phase II (Percent) | |
| 1998 | 2.2 |
| 1999 | 5.9 |
| 2000 | 3.7 |
| 2001 | 2.4 |
| 2002 | 8.6 |
| 2003 | 6.8 |
| 2004 | 11.0 |
| 2005 | 20.5 |
| 2006 | 12.7 |
| 2007 | 11.2 |
| 2008 | 6.8 |
| 2009 | 8.1 |
| 100.0 | |
NOTE: Phase II N=186
SOURCE: 2011 Survey; 2010 Phase IIB Survey.
The Phase IIB Survey Population
NSF provided the Academies with a data set containing records on 285 Phase IIB awards; data included the PI’s name and email address. Four of the email addresses were invalid. No companies received more than six awards, and fewer than 20 companies received three or more.
Accordingly, it was determined that all Phase IIB award recipients with active email addresses that received their awards in FY1999-2009 should be surveyed. Awards made in 2010 would be too recent to address questions of commercialization impacts, an important aspect of the assessment.
Effort at Comparison Group Analysis
As with the later 2011 Survey, the Committee determined that if feasible, a control group should be developed against which to compare outcomes for Phase IIB projects. We ultimately concluded that the group, selected from the population of Phase II award recipients that did not receive Phase IIB funding, was not appropriate for use as a statistical comparison group.
Questionnaire Development
In order to ensure maximum comparability with previous Academies surveys, the survey questionnaire was based on the 2005 Survey instrument.12
Three changes were made to the previous instrument:
- Some questions were eliminated on the grounds that they had not generated knowledge used in previous assessments.
- Questions from both the project survey and the company survey were integrated into a single instrument.
- A section was added, focused on company experience with—and impacts from—Phase IIB.
Survey Deployment
Deployment faces twin challenges: it must generate an adequate number of responses, and it must be cost effective. An approach based on multiple iterations via different deployment vectors was adopted, as follows:
- The survey was deployed on the web, and individualized links were created for each recipient, so as to track individual responses.
- Four rounds of emails were sent to each recipient, separated by approximately 1-2 weeks, seeking response via an embedded link.
- One further round was sent by the NSF’s Dr. Joseph Hennessey.
- Two additional rounds of voicemails were delivered (directing respondents to emails sent within the previous 24 hours).
Survey Responses
Based on the provision of 281 apparently valid email addresses by NSF and 281 control group awards, the preliminary survey deployment list included 562 email addresses, one per project. Based on two rounds of emails, it was determined that a number of these email addresses were nonfunctional and, after research, that 104 could not be replaced with functional equivalents. This had the effect of reducing the sample size of the project to 458 projects. Response rates for both groups are summarized in Table A-5.
As a result of these coordinated efforts, effective survey response rates were 51 percent for Phase II and 48 percent for Phase IIB only, after elimination of bad and non-replaceable email addresses (in some but not all cases alternative email addresses were identified).
___________________
12See National Research Council, An Assessment of the SBIR Program at the National Science Foundation, Appendix B.
TABLE A-5 2010 Phase IIB Survey Responses
| Phase IIB | Phase II | |
| Excluded | ||
| Bounced | 36 | 62 |
| No Email | 2 | 0 |
| Deleted Duplicate | 1 | 3 |
| All excluded | 39 | 65 |
| Included | ||
| Complete | 117 | 110 |
| Partial | 3 | 2 |
| No Response | 122 | 104 |
| All included | 242 | 216 |
| Total | 281 | 281 |
| Gross response rate | 41.6% | 39.1% |
| Effective response rate | 48.3% | 50.9% |
SOURCE: 2010 Phase IIB Survey
The slightly lower Phase IIB net response rate is explained by the preference of some projects with more than one award to provide only a single response. The Phase IIB response rate by company was essentially identical to that for Phase II respondents, at 51.2 percent.
A more detailed breakout of survey responses by year indicates that with two exceptions, the two groups are quite similar (see Table A-6). Phase IIB responses tended to cluster more in the 2002 and 2006 award years.
TABLE A-6 2010 Phase IIB Survey Response Distribution by Year and Group
| Year of Award | Phase II (Percent) | Phase IIB (Percent) |
| 1998 | 2.7 | 2.6 |
| 1999 | 8.2 | 3.4 |
| 2000 | 3.6 | 2.6 |
| 2001 | 1.8 | 0.0 |
| 2002 | 2.7 | 11.1 |
| 2003 | 2.7 | 5.1 |
| 2004 | 10.9 | 8.5 |
| 2005 | 21.8 | 16.2 |
| 2006 | 8.2 | 20.5 |
| 2007 | 7.3 | 6.0 |
| 2008 | 12.7 | 12.0 |
| 2009 | 17.3 | 12.0 |
| Total | 100.0 | 100.0 |
NOTE: N=120 (Phase II) and 112 (Phase IIB)
SOURCE: 2010 Phase IIB Survey.


