
Identification and Classification
The sixth workshop session focused on current approaches to identification and classification, with specific application to fisheries and other disciplines. Some useful references for this session’s topics, as suggested by the workshop program committee, include Beijbom et al., 2012; Branson et al., 2014; Kumar et al., 2012; and Wah et al., 2014. David Jacobs (University of Maryland, College Park) chaired the session, with presentations made by David Kriegman (University of California, San Diego), David Jacobs, Serge Belongie (Cornell Tech), and Gunasekaran Seetharaman (Air Force Research Laboratory).
AUTOMATIC ANALYSIS OF BENTHIC REEF IMAGES
David Kriegman, University of California, San Diego
Coral coverage, David Kriegman stated, has declined enormously in the past 30 years: it has decreased by 80 percent in the Caribbean (Gardner et al., 2003), 50 percent in the Indo-Pacific (Bruno and Selig, 2007), and 50 percent in the Great Barrier Reef (De’ath et al., 2012). Corals, Kriegman explained, are simultaneously an animal, mineral, plant, and microbe: while they are technically animals, they have a calcium carbonate reef structure and contain a symbiotic relationship with different types of algae that inhabit them. Coral bleaching occurs when, due to heat stress, the coral will expel the algae inhabiting them. Coral can survive a bleaching event, and the algae can be repopulated if the temperatures stabilize, although the overall health and stability of the coral reef can suffer. In 2009, the Center for
Biological Diversity petitioned NOAA to list 83 coral species as threatened or endangered. Because abundance and trend data were virtually non-existent for most coral, however, only 23 species were considered for listing, and only 3 species were added to the endangered species list. This points to the need for additional information on coral to support its protection, said Kriegman.
In the past, coral coverage was determined by hand-counting in the field, which Kriegman explained is very time consuming. Now, more rapid data acquisition is possible via imaging, but the processing time by humans has increased, resulting in little net improvement in overall analysis time, although the photographic record is very valuable. He described a representative data survey of the Moorea Coral Reef Long-Term Ecological Research Site: 1,250 images were hand annotated with more than 250,000 annotations. This process took 6 to 9 months.
Kriegman listed the steps needed in an automatic image annotation (Beijbom et al., 2012):
- Preprocess. Resize and normalize the contrast space.
- Filter to obtain a feature vector for each image following Varma and Zisserman (2005).
- Map each pixel to a visual word.
- Create a histogram of words. This can be done at multiple scales (individual pixels or groups of pixels).
- Train a classifier on the histogram word counts. Annotations of the training data would form the class labels and be used to predict the annotation of new images.
Beijbom et al. (2012) applied this system to the Moorea labeled coral data. The system currently requires about 20 seconds per image, with a classification accuracy of 70 to 80 percent. Kriegman said that humans were also found to have an accuracy of around 80 percent in a NOAA Coral Reef Ecosystem Division study.
Kriegman then described a website, CoralNet,1 where people can upload coral reef images, automatically annotate images, and view annotation statistics. Currently, CoralNet has 97 different data sets.
A retrospective analysis of Moorea data attempted to identify coral species. Kriegman explained that porites are the most pervasive coral genus in Moorea, the Moorea population of porites has declined precipitously in recent years: over one-third of porites was lost in one season. In 2010, the data became annotated at the species level, but the data before that was annotated only to the genus level. Beijbom trained his system on the 2010-2011 species-level hand annotations and
__________________
1 For more information, see the CoralNet website at http://coralnet.ucsd.edu/, accessed June 13, 2014.
then looked at genus-level data from previous years to “fill in” the species-level data in prior years. Tests showed species identification to be 96 percent accurate (Beijbom et al., 2012). By examining both future and legacy data, Kriegman argued, one can help identify biological trends.
Kriegman also briefly explained that he seeks to improve the accuracy of identification by including fluorescence imaging. This may help in the identification of juvenile corals, which are typically difficult to find in a standard color image. He also described future work, which involves larger-scale use of automatic image annotation, leveraging CoralNet data, improving recognition techniques, and adding 3D reconstruction.
CLASSIFYING LEAVES USING SHAPE
David Jacobs, University of Maryland, College Park
David Jacobs explained that he uses species identification techniques to identify tree species. Leafsnap2 is an application to help professional botanists and laypeople identify tree species in the field using only a smartphone. To use Leafsnap, the leaf needs to be photographed against a white background (such as a piece of paper); the image is then subjected to a shape-based, nearest-neighbor search. The classifier first identifies whether the image is viable for searching; this saves time and eliminates spurious queries. The classifier is trained on many examples of user-uploaded images. While the shape detection problem may seem easy, said Jacobs, high accuracy is difficult to achieve because shadows and non-uniform backgrounds can strongly affect the results.
To conduct the classification, Jacobs explained that the leaf image is first segmented on a pixel-by-pixel level. Each pixel has a 2D representation consisting of its saturation and value. (Jacobs noted that hue is not helpful in segmentation because the background generally has a greenish hue due to light reflected from leaves.) Post-processing of the image removes shadows and stems. (Jacobs noted that stems are not useful for classification because people tend to be inconsistent in how they pick the leaf off the tree.) An expectation-maximization algorithm is used to cluster the 2D representations and identify the shape. To classify the leaves, the curvature of the leaf is computed at a variety of scales; this captures both the overall leaf shape (coarse scale) along with information about serration (fine scale). Integral measures of curvature are used; Jacobs noted that this was less noisy than other, derivative-based measures. Essentially, a disk is moved around the boundary of the leaf, and the amount of leaf inside the disk (versus the amount
__________________
2 For more information, see Leafsnap, “Leafsnap: An Electronic Field Guide,” http://leafsnap.com/ accessed June 13, 2014.
of background) is recorded as the measure of curvature. A multi-scale histogram of curvature is built and used for classification. Jacobs stated that for a pool of 184 species of trees from the northeastern United States, the classifier returns the correct tree as the first choice 69 percent of the time, and the correct answer is in the top five results 93 percent of the time (Kumar et al., 2012).
He reported that Leafsnap was released in 2011 and has been downloaded more than 1 million times. He indicated an interest in expanding the leaf database beyond leaves in the northeastern United States. A similar product has been released in the United Kingdom, and he said that there is interest in developing databases for different animals and tropical plants. Jacobs also briefly described the efforts to classify dogs by breed. The system, Dogsnap, first detects the dog’s face, then localizes three parts: the two eyes and the tip of the nose. Facial features are extracted and breed classification is conducted using these facial parts. Currently, the dog classification accuracy is at 60 to 70 percent. Jacobs is also working to classify birds in a developing application called Birdsnap.3
FINE-GRAINED VISUAL CATEGORIZATION WITH HUMANS IN THE LOOP
Serge Belongie, Cornell Tech
Serge Belongie described work that is part of a larger effort, known as Visipedia,4 in which users can search a visual encyclopedia by image. Visipedia is designed to be the visual equivalent of Wikipedia. Visipedia is crowd-powered and relies on people to label training images. Belongie noted that some groups can be enthusiastic about a hobby related to a particular data set (such as birds, planes, hand tools, or bicycles). By engaging those groups with the data sets, text-to-image and image-to-article searches can be improved. He noted that standard classifications fail when working with a large number of related classes (such as birds); classifying a bird as an animal may not be difficult, but classifying a bird’s species can be quite difficult. Difficulties arise because there are few training examples per class available, variation between classes is small, and the variation within a class is often still high. Belongie emphasized that Visipedia is a service, not a polished application.
Birds, Belongie noted, are a rich problem domain: they must be observed from a distance, move frequently, have many colors and parts, are difficult to segment,
__________________
3 Birdsnap was under development at the time of the workshop but has since been released; for more information, see http://birdsnap.com/, accessed July 14, 2014.
4 Visipedia is a joint project between Pietro Perona’s Vision Group at Caltech and Serge Belongie’s Vision Group at Cornell Tech (for more information, see “Visipedia Project,” http://www.vision.caltech.edu/visipedia/, accessed June 16, 2014.
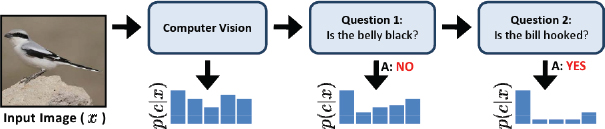
FIGURE 7.1 Schematic of the “Visual 20 Questions” game. SOURCE: S. Branson, C. Wah, F. Schroff, B. Babenko, P. Welinder, P. Perona, and S. Belongie, Visual recognition with humans in the loop, pp. 438-451 in Computer Vision—ECCV 2010, Lecture Notes in Computer Science, Volume 6314, Springer, Berlin Heidelberg.
and are not well described by boundaries. The Birds-200 data set5 was the first developed by the CalTech Vision Group, and a new data set, CCUB NABirds 700,6 is planned for release later this year and includes input from an ornithologist. Researchers ask crowdsourced volunteers to label the presence or absence of birds in images, draw bounding boxes around each bird, and label individual parts of the birds (such as breast patterns, crown color, beak shape, and wing color). Belongie explained that his group used Mechanical Turk7 for their crowdsourcing.
Belongie said that his research group used basic, off-the-shelf computer vision methods; the novel element was adding an interactive, human component. He showed that refinement can take place by using a method referred to as “Visual 20 Questions” (see Figure 7.1), in which an image is processed using standard computer vision techniques. The results are then refined by asking questions designed to maximize the expected information gain.
Belongie briefly described perceptual embedding, in which similarity comparisons are made among existing images in a database. This avoids a weakness associated with the use of crowdsourcing: non-experts may not perform well in searching for an item for which there are not enumerated parts or for which the part names are obscure and unknown to the average user, he said. (Belongie used a mushroom as an example; most people do not know the formal names of the
__________________
5 For more information, see “Caltech-UCSD Birds-200-2011,” http://www.vision.caltech.edu/visipedia/CUB-200-2011.html, accessed June 16, 2014.
6 For more information, see Cornell Lab of Ornithology, “CCUB NABirds 700 Dataset: Backyard Bird Edition,” http://birds.cornell.edu/nabirds, accessed June 16, 2014.
7 For more information, see the Amazon Mechanical Turk website at https://www.mturk.com/mturk/welcome, accessed June 16, 2014. Mechanical Turk is also known as MTurk.
parts of a mushroom.) Instead, by searching via similarity, where the user is asked to identify images with similar shapes or patterns, one can find the correct match without the need for any specialized terminology.
TRACKING VEHICLES IN LARGE-SCALE AERIAL VIDEO OF URBAN AREAS
Gunasekaran S. Seetharaman, Air Force Research Laboratory
Gunasekaran Seetharaman explained that the Air Force Research Laboratory (AFRL) began examining very large images of urban areas in 2003 for the purposes of tracking. The key challenges were the required wide field of view, the number of pixels on targets of interest (vis-a-vis ground-sensed-dimension), and vast variations in intensities of objects over time, in addition to more obvious factors such as the large size and very large number of potential objects in the field of view. The images were very high resolution and resulted in large file sizes that were difficult to analyze to produce timely results. Today, many more sensors are involved in imaging urban areas; lessons learned from the earlier projects with large volume and velocity of data pushed AFRL toward onboard computing.
Seetharaman cautioned that AFRL is application-driven, and its efforts tend to be governed by a pragmatic balance between assured performance and sustainability at scale relative to innovative, cutting-edge solutions that are very specific to one context. While AFRL tends to develop sustainable and affordable products, some tactical products may not use the most optimal algorithm in the literature. He then described AFRL work that would be relevant to the fisheries community. The first project in this area is Net-Centric Exploitation Tools (NCET), a tool to identify a specific action that might occur, such as dropping a bag, in video surveillance footage. NCET integrates a large network of cameras and processors to accomplish this interpretation. Another AFRL project examines data fusion techniques for integrating information from multiple cameras and sensors and prioritizing information from the most relevant sensor.
Seetharaman indicated that these systems return a deluge of data, resulting from the following:
- Increased sensor resolution.
- Improved deployment methods, including the harvesting of data from deployed systems.
- New methods of data acquisition that result in increased resolution.
- Complex operational environments, such as when a sensor is deployed but not accessible.
- Multi-spectral and hyper-spectral imaging. Seetharaman noted that this may push the current onboard computing techniques forward.
Seetharaman described the principles of acquiring high-numerical-aperture imaging through an array of identical cameras with specifically derived relative positions between them. He shared AFRL’s experience with prototyping a sensor named Angel Fire. Angel Fire obtains its wide field of view due to the camera array as well as the circular motion of the platform over an area persisting for hours.
He also referred to the Autonomous Real-Time Ground Ubiquitous Surveillance (ARGUS) system, which is an array of imaging sensors capable of producing gigapixel images. ARGUS can have a very large geographic area within the field of view, but it tends to be directionally limited. He described another gigapixel system (Cossairt et al., 2011) that is more omnidirectional. He also mentioned the need to incorporate multi-modal data and the collection of data from sensor networks.
Seetharaman described a method of discriminating between stationary and moving image features (i.e., separating a moving target from its background) that uses a flux tensor analysis. When combined with other techniques, the system can learn to classify in a variety of conditions, including a stationary or moving foreground, adaptively changing parameters, and dynamic backgrounds (Wang et al., 2014).
Seetharaman also described a suite of appearance-based tracking algorithms, including the following:
- Likelihood of Features-based Tracker (LoFT), which is most suitable for low-frame-rate imagery, models the target with a set of color, texture, and shape feature descriptors, then computes the match likelihoods for each feature by comparing the target to a local search image through a sliding window. This method helps inject contextual information (i.e., other knowledge about the dynamics of the field of regard) into the tracking performance
- Clustered Set of Structured Uniformly Sampled Features (CSURF) Tracker, which computes and clusters descriptors to create a deformable, parts-based, predictive model that is robust to occlusion. In each scene, the parts-based model identifies the best matches, a target is localized, and the next scene is predicted.
Seetharaman concluded by noting the opportunity for using a network of federated sensors to allow for the collection of high-resolution data in remote and widespread areas. He emphasized that multi-target detection and tracking will remain a challenge. He noted that these flux tensors, when combined with split Gaussian mixtures methods, handle several of these problems in practical applications.


