


Below is the uncorrected machine-read text of this chapter, intended to provide our own search engines and external engines with highly rich, chapter-representative searchable text of each book. Because it is UNCORRECTED material, please consider the following text as a useful but insufficient proxy for the authoritative book pages.
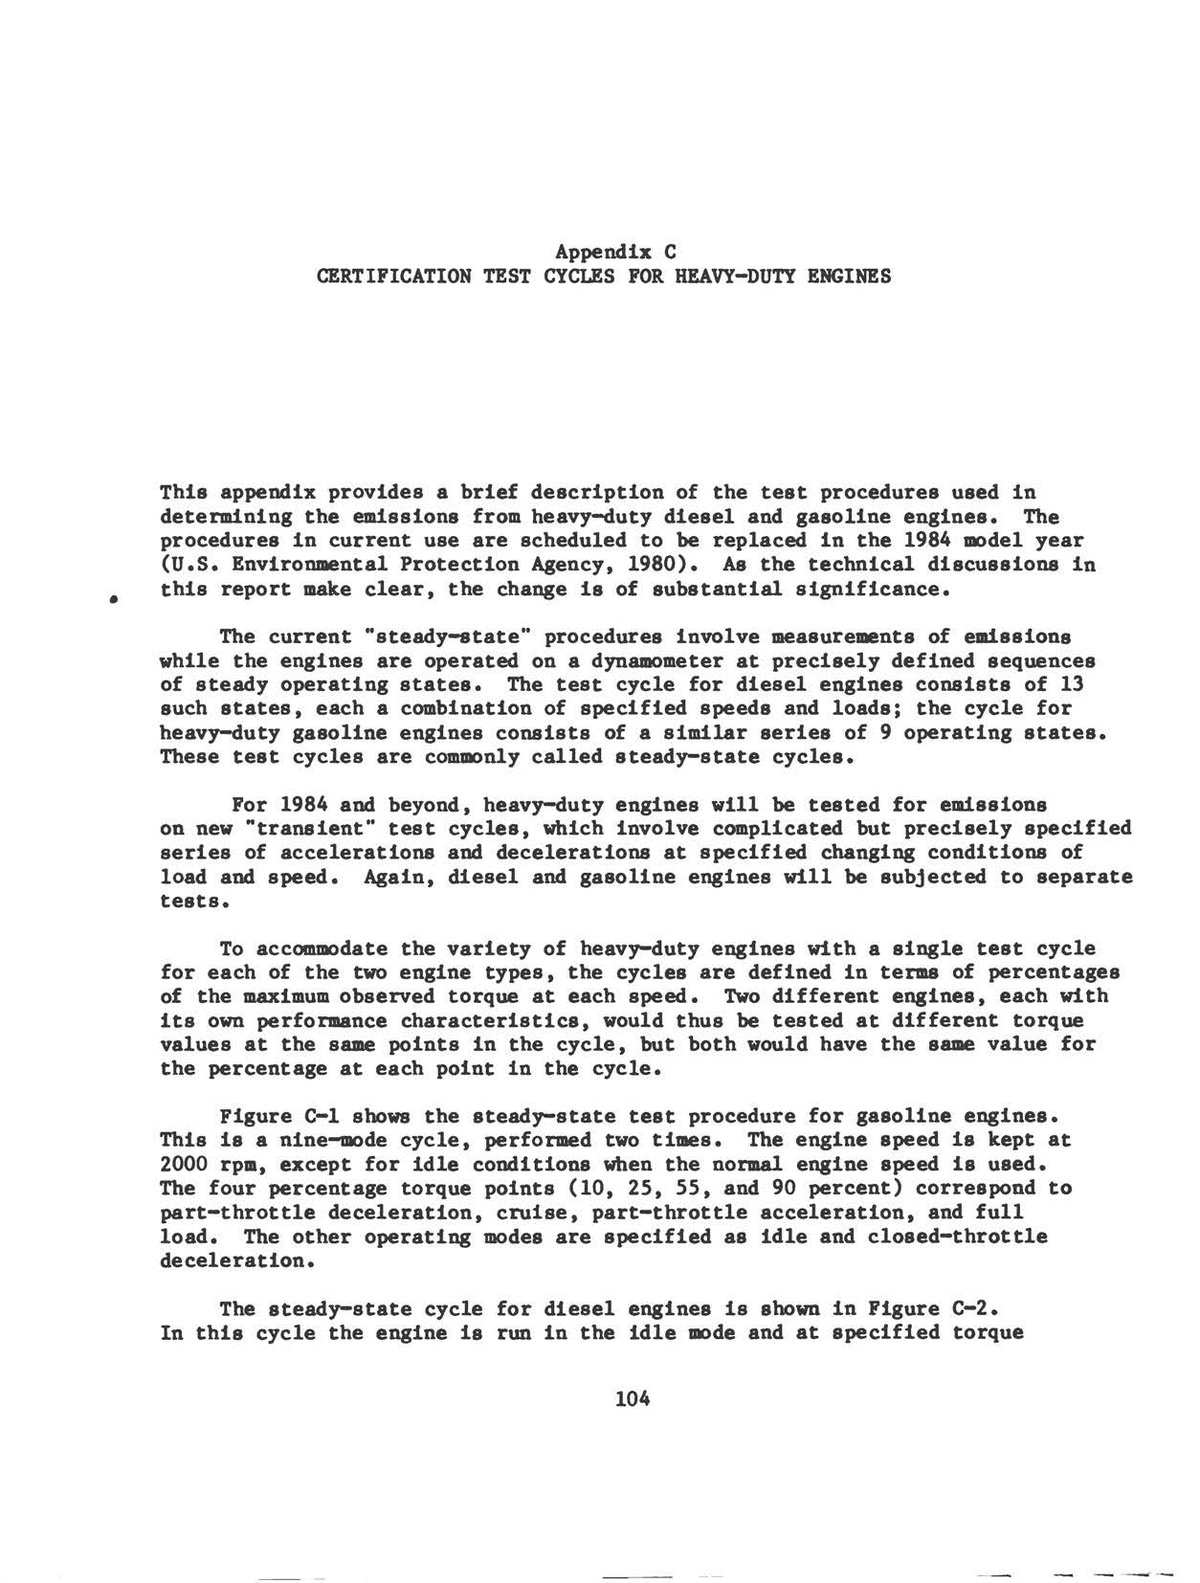
Appendix C CERTIFICATION TEST CYCLES FOR HEAVY-DUTY ENGINES This appendix provides a brief description of the test procedures used in determining the emissions from heavy-duty diesel and gasoline engines. The procedures in current use are scheduled to be replaced in the l984 model year (U.S. Environmental Protection Agency, l980). As the technical discussions in this report make clear, the change is of substantial significance. The current "steady-state" procedures involve measurements of emissions while the engines are operated on a dynamometer at precisely defined sequences of steady operating states. The test cycle for diesel engines consists of l3 such states, each a combination of specified speeds and loads; the cycle for heavy-duty gasoline engines consists of a similar series of 9 operating states. These test cycles are commonly called steady-state cycles. For l984 and beyond, heavy-duty engines will be tested for emissions on new "transient" test cycles, which involve complicated but precisely specified series of accelerations and decelerations at specified changing conditions of load and speed. Again, diesel and gasoline engines will be subjected to separate tests. To accommodate the variety of heavy-duty engines with a single test cycle for each of the two engine types, the cycles are defined in terms of percentages of the maximum observed torque at each speed. Two different engines, each with its own performance characteristics, would thus be tested at different torque values at the same points in the cycle, but both would have the same value for the percentage at each point in the cycle. Figure C-l shows the steady-state test procedure for gasoline engines. This is a nine-mode cycle, performed two times. The engine speed is kept at 2000 rpm, except for idle conditions when the normal engine speed is used. The four percentage torque points (l0, 25, 55, and 90 percent) correspond to part-throttle deceleration, cruise, part-throttle acceleration, and full load. The other operating modes are specified as idle and closed-throttle deceleration. The steady-state cycle for diesel engines is shown in Figure C-2. In this cycle the engine is run in the idle mode and at specified torque l04
l05 Engine Speed = 2OOO -~- w n 100 â Except Idle § 90 â ^â¢â¢H Full Load z 1 u_ Part Throttle OKR DO Acceleration 3 « C 2 o o z w i f Ml 3 1C o O ^o LTiir n r ~i^ Si- 10 2 0> LJ II . ^^^"^ I 5 Part Throttle Deceleration o I 1 1 1 1 1 ° 0 3 6 9 12 15 18 TIME (min) Figure C-l Steady-state test cycle for gasoline engines
l06 Q LU LU LU I 36 42 TIME (min) ui ^3 2g o "~ LU CC O LU LU 99 CL O 100 7K '5 Rated Speed Intermediate Speed Idle Speed I i 72 78 6 12 18 24 30 36 42 48 54 60 66 72 78 TIME (min) Figure C-2 Steady-state test cycle for diesel engines
l07 percentages for two engine speeds, the maximum rated speed and an inter- mediate speed. Although the percentage torque values are the same at both engine speeds, the actual torque is different because the maximum torque is different at the two speeds. In the steady-state cycles emissions are measured only during the specific operating modes. Emissions resulting from changes between the different modes are not considered. In the transient test procedures, both the speed and the torque are specified as percentage values. Prior to running the transient cycle it is necessary to measure the maximum and minimum engine speed and to obtain a graph of maximum torque as a function of engine speed. These data are then used to convert the cycle specifications into actual speed and torque values for the specific engine. The transient test cycle for a Volvo TDl00C diesel engine is plotted in Figure C-3. For other engines the actual speed and torque values would be different, but the shapes of the curves would be the same. The notations at the top of Figure C-3 indicate the types of vehicle operation used to generate the cycle; these are New York nonfreeway (NYNF), Los Angeles nonfreeway (LANF), and Los Angeles freeway (LAF). The negative torque valves shown in the figure simulate conditions in which the engine is being driven by vehicle inertia (e.g., deceleration). Manufacturers that do not have dynamometers capable of driving engines to the negative torque levels must buy new dynamometers to perform the new test procedures. The power output of the engine during the various portions of the cycle can be visualized by recalling that power output is the product of torque and speed. Thus regions where both torque and speed are high are regions of high power output, and, regions where both are low are regions of low output. Figure C-3 is intended to illustrate the types of engine operation required by the transient test cycles. The cycle for gasoline engines has a different set of specifications, but the general nature of the cycle is similar. The full details of both test cycles are given in U.S. Environmental Protection Agency (l980).
l08 o § Ul anouoi (IAId«) QNVIAIIAIO3 Q33dS I
l09 REFERENCES U.S. Environmental Protection Agency. l980. "Control of Air Pollution From New Motor Vehicles and Motor Vehicle Engines; Gaseous Emission Regulations for l984 and Later Model Year Heavy-Duty Engines." (Final rule.) Federal Register 45(l4):4l36. January 2l. Ullman, Terry L., and Charles T. Hare. l98l. "Emission Characterization of an Alcohol Fueled-Diesel Pilot Compression-Ignition Engine and its Heavy-Duty Diesel Counterpart." Draft report prepared for U.S. Environmental Protection Agency, Office of Mobile Source Air Pollution Control, Emission Control Technology Division, Ann Arbor, Mich. (Contract No. 68-03-2884, Task 6.) June.
