
2
Sample Design and Precision of Estimates
The American Community Survey (ACS) was envisioned as a replacement and improvement upon the census long-form sample. One of the most important aspects of this vision is the provision of small area data for the entire nation, which for the smallest areas is provided in the ACS as a series of 5-year aggregates. As discussed in Chapter 1, the ACS design has important benefits and was not intended to simply replicate the long-form survey. Nonetheless, data quality comparisons to the long-form survey provide useful context, particularly from the perspective of data users.
Some degree of reduced precision in any 5-year estimate relative to the corresponding long-form estimates has always been viewed as the tradeoff for the benefits provided by annual ACS updates. But over the years, from inception to demonstration periods to full implementation, the ACS has faced challenges in providing small area data because of budget constraints, as well as design and operational limitations. As a result, a series of compromises have made the small area estimates far more problematic than originally expected (Starsinic, 2005). In fact, the reduced utility of the ACS estimates for small areas undermines the serviceability of the ACS program in terms of its original objective.
A detailed discussion of the ACS sample design can be found in the American Community Survey Design and Methodology Report (U.S. Census Bureau, 2014a). The first section below compares the precision of the ACS estimates to those from the census long-form sample. The next section analyzes the usability of tract data from the ACS. The third section looks at recent Census Bureau efforts to improve the precision of the ACS
estimates, including a sample reallocation program focused on tract-level precision equalization. The effects of the sample reallocation are examined in depth, using New York City as a case study. The panel’s conclusions and recommendations related to sample design are presented in the last section of the chapter.
PRECISION OF THE ACS AND CENSUS LONG-FORM SAMPLES
Table 2-1 shows the design characteristics at the tract level for the 2000 census long-form sample and the 2007-2011 ACS. The comparison captures the contributions of several design features to the dramatic differences in precision between the two data collections. First, the sample size from the ACS 5-year aggregate is only 54 percent of the 2000 cen-
TABLE 2-1 Design Characteristics of the 2000 Census Long-Form Sample and 2007-2011 ACS Samples
| Characteristics | 2000 Census | 2007-2011 American Community Survey |
|
| Total Sample Size | 43,961,414 | 23,781,823 | |
| Number of Tracts | 65,746 | 73,146 | |
| Median Tract Sample Size | 605 | 296 | |
| Median Tract Design Effect | 1.12 | 1.41 | |
| Median Tract Effective Sample Size | 533 | 209 |
NOTES: There are sample size data for only 72,234 of the 73,146 tracts because a minimum of 50 unweighted sample cases for a subpopulation in a geographic area is required to release a data table. The design effect only takes into account heterogeneity in weights and is calculated as 1+ the coefficient of variation squared. This is a generalized design effect based on a model of weighting loss computed under the assumption that the weights bear no association to the variable of interest. The actual design effect for any given estimate will be affected by which cases are in the universe, clustering, and stratification, in addition to weight heterogeneity. The effective sample size is the sample size after taking into consideration the design effect.
sus long-form sample size, and the median tract sample size for the ACS (296 housing units) is only 49 percent of the corresponding 2000 census long-form value (605 housing units).1 In addition, differences in sample design (e.g., nonresponse subsampling) and estimation (e.g., lack of direct subcounty population controls) contribute to larger design effects2 for the
______________
1Some of the difference is due to an increase in the number of tracts in the ACS.
2The design effect is the extent to which the sampling error differs from the sampling error that can be expected under simple random sampling.
ACS (median, 1.41) in comparison with the 2000 census long-form sample (median, 1.12).
Across all the differences, the median net effective sample size for ACS (209) is only 39 percent of the comparable 2000 census long-form sample figure (533). In other words, if everything else is held constant, standard errors for the ACS are about 60 percent larger than for the 2000 census for median-sized tracts: this difference is much larger than had been anticipated during the original design phase of the ACS.
When analysis is restricted to smaller domains (e.g., adults 18-64 years of age, those in the labor force, or racial or ethnic subgroups), sample sizes can become very small at the tract level. As a result, the ACS data are even more unstable for these types of analyses. Variables subject to large coefficients of variation (such as income or travel time to work) can also produce erratic 5-year estimates due to low sample sizes.
The distributional properties of the summarized differences in Table 2-1 are presented in Figures 2-1 and 2-2. The unweighted tract-level sample sizes in Figure 2-1 illustrate just how different the sample size distributions are for the ACS and the 2000 census. These distributional differences are even more pronounced when comparing tract-level effective sample sizes, as shown in Figure 2-2. The figures illustrate that the precision levels for the vast majority of tracts for the ACS 5-year estimates are likely to be only at the lowest levels achieved for the 2000 census long-form sample.
USABILITY OF TRACT DATA FROM THE 2008-2012 ACS
The Census Bureau evaluates the quality of ACS estimates by examining the median value of the coefficients of variation (CVs) for 20 key variables, where CV = [(standard error/estimate) × 100 percent], or the ratio of the standard error (SE) to the point estimate expressed as a percentage (see Hernandez-Viver and Starsinic, 2013). If the tract-level CV for a key variable is less than or equal to 30 percent, then this variable is judged to be “reliable” and to meet the Census Bureau’s quality standard.3 While the median CV for all tracts provides useful summary information, it does not provide a complete picture of the utility of tract-level ACS data for various users. Tables 2-2 and 2-3 provide a more detailed overview of the precision and usability of five of the Census Bureau’s key variables, using 2008-2012 ACS data.
Table 2-2 shows that the median tract-level CV for each of these five key variables meets the Census Bureau’s quality threshold (less than or equal to 30 percent). However, the share of all census tracts whose CV
______________
3A more common standard of precision is a CV of less than or equal to 10 percent (see National Research Council, 2007).
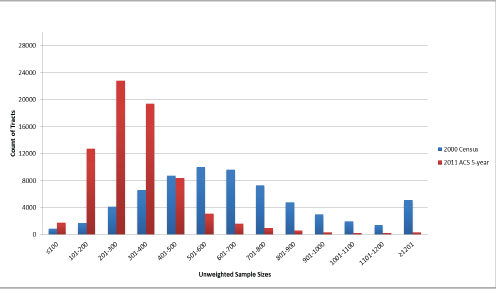
FIGURE 2-1 Unweighted sample counts in census tracts.
NOTE: Only tracts that have a minimum of 50 unweighted sample cases are included.
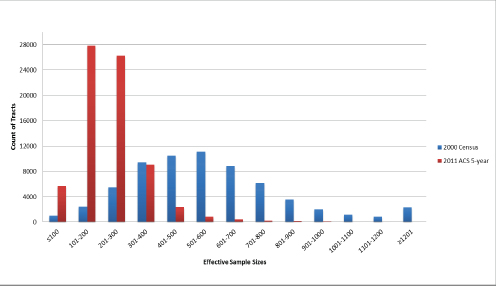
FIGURE 2-2 Effective sample sizes in census tracts.
NOTE: Only tracts that have a minimum of 50 unweighted sample cases are included.
meets this threshold varies from 50 percent for occupied housing units with persons who are foreign born to 88 percent for occupied housing units that are renter occupied. For data users trying to analyze the share of foreign-born population at the tract level, for example, only half of the tracts in the 2008-2012 ACS have CVs below the precision threshold.
The Census Bureau provides another measure of precision for each published ACS estimate, the margin of error (MoE), where MoE = SE × 1.645, which corresponds to a 90 percent confidence interval.4 Many data users utilize the MoEs to calculate 90 percent confidence intervals around ACS estimates by adding and subtracting the MoE from the estimate to calculate the upper and lower bounds of the confidence interval. One commonly used standard of precision for percent estimates is that the width of confidence intervals is less than 10 percentage points, or equivalently the MoE is less than 5 percentage points. Table 2-2 shows that the share of tracts failing to meet this standard also varies widely across these five variables: from a low of 30 percent for the foreign-born population to a high of 80 percent for occupied housing units that are renter occupied. In other words, only 70 percent of estimates of the foreign-born population and 20 percent of estimates of the housing units that are renter occupied meet the standard.
An additional problem for data users using this simple method to construct confidence intervals is that the intervals may include logically impossible values. If the MoE is larger than the point estimate, then the confidence interval lower bound will fall below zero. Similarly, the upper bound might exceed 100 percent. Obviously, percentage estimates below zero or above 100 percent are both logical impossibilities. The share of tracts where the MoE exceeds the estimate, and therefore the lower bound of the confidence interval falls below zero, ranges from a low of 1 percent to a high of 16 percent: see Table 2-2. The share of tracts with a confidence interval whose upper bound exceeds 100 percent is much smaller. This problem and potential solutions are discussed in Chapter 5.
A meaningful CV for an ACS estimate cannot be calculated if the estimate is zero because it is not possible to divide by zero (given that CV = (standard error/estimate) × 100%). Furthermore, data users cannot calculate a meaningful standard error with the standard methods suggested by the Census Bureau if a published estimate is zero or if a derived percentage estimate is 100 percent because in those cases the conventional standard error estimate would be zero, suggesting an implausible degree of certainty
______________
4Consistent with Census Bureau tradition, ACS estimates are published with 90 percent confidence levels, although ACS data users can convert the published MoEs to the MoEs for a higher confidence level, if needed. In the broader statistical community, 95 percent confidence levels are more commonly used.
TABLE 2-2 Usability Analysis: Tract-Level 2008-2012 ACS Data (in percentage)
| Characteristics | Percentage of Persons Living in Povertya | Percentage of Occupied Housing Units That Are Renter Occupiedb | Percentage of Households Receiving SNAP Benefits in Past 12 Monthsc | Percentage of Persons Who Are Foreign Born | Percentage of Population Aged 25+ with a Graduate or Professional Degreed | ||||||
| National Estimate | 14.9 | 34.5 | 11.4 | 12.9 | 10.6 | ||||||
| National Margin of Error | ±0.1 | ±0.2 | ±0.1 | ±0.1 | ±0.1 | ||||||
| All Tractse | |||||||||||
|
Tract range |
0-100 | 0-100 | 0-100 | 0-100 | 0-100 | ||||||
|
Tract mean |
16.0 | 35.2 | 12.5 | 12.2 | 10.3 | ||||||
|
Tract median |
12.6 | 29.8 | 9.2 | 6.9 | 7.2 | ||||||
|
Tract median CV |
28.3 | 14.7 | 29.5 | 29.7 | 26.0 | ||||||
|
Tract median MoE |
5.8 | 6.7 | 4.6 | 3.4 | 3.2 | ||||||
|
CV ≤ 30% |
56 | 88 | 51 | 50 | 61 | ||||||
|
CV > 30 and ≤ 50% |
35 | 9 | 29 | 29 | 27 | ||||||
|
CV > 50% |
9 | 2 | 20 | 21 | 12 | ||||||
|
Confidence interval ≥ 10 percentage points |
59 | 80 | 45 | 30 | 17 | ||||||
|
MoE > estimate |
4 | 1 | 16 | 15 | 8 | ||||||
|
Confidence interval lower bound < 0 |
4 | 1 | 16 | 15 | 8 | ||||||
|
Confidence interval upper bound > 100 |
0.17 (125 tracts) | 1.4 (1034 tracts) | 0.1 (89 tracts) | 0.05 (37 tracts) | 0.1 (64 tracts) | ||||||
| Confidence Interval Width ≥ 10 Percentage Points by CV Category, Excluding Tracts Where CV = 0 | |||||||||||
|
CV ≤ 30% |
73 | 84 | 69 | 48 | 24 | ||||||
|
CV > 30 and ≤ 50% |
46 | 58 | 33 | 19 | 9 | ||||||
|
CV > 50% |
30 | 32 | 11 | 8 | 6 | ||||||
| Median CVs by Tract Total Population Size | |||||||||||
| All Tracts | |||||||||||
|
< 1,000 |
31.3 | 18.7 | 27.2 | 43.6 | 37.6 | ||||||
|
1,000-2,999 |
29.0 | 16.0 | 29.6 | 38.6 | 31.4 | ||||||
|
3,000-4,999 |
28.1 | 14.3 | 29.3 | 29.6 | 25.9 | ||||||
|
5,000-6,999 |
28.2 | 14.1 | 29.8 | 25.2 | 23.5 | ||||||
|
7,000+ |
27.8 | 14.4 | 29.5 | 20.7 | 20.8 | ||||||
| Characteristics | Percentage of Persons Living in Povertya | Percentage of Occupied Housing Units That Are Renter Occupiedb | Percentage of Households Receiving SNAP Benefits in Past 12 Monthsc | Percentage of Persons Who Are Foreign Born | Percentage of Population Aged 25+ with a Graduate or Professional Degreed | ||||||
| Median CV by Tract Number of Housing | |||||||||||
| Units | |||||||||||
|
All Tracts |
|||||||||||
|
≤ 400 |
32.6 | 12.0 | 23.7 | 29.8 | 42.9 | ||||||
|
401-1,000 |
31.6 | 18.0 | 31.8 | 34.1 | 35.5 | ||||||
|
1,001-2,000 |
28.4 | 14.9 | 29.2 | 30.9 | 27.4 | ||||||
|
2,001-4,000 |
27.4 | 13.6 | 29.1 | 28.1 | 22.7 | ||||||
|
4,001-6,000 |
27.2 | 13.4 | 31.8 | 20.8 | 17.0 | ||||||
|
6,001+ |
26.4 | 13.7 | 40.4 | 16.0 | 14.2 | ||||||
aTracts with no persons in the universe for which poverty rates are calculated were excluded from this analysis.
bTracts with no households were excluded from this analysis.
cSNAP is the Supplemental Nutrition Assistance Program; tracts with no households were excluded from this analysis.
dTracts with no persons aged 25 or older were excluded from this analysis.
eTracts with zero population are excluded.
NOTES: For a more detailed version of this table, see Appendix A. MoE is margin of error; CV is coefficient of variation (see text).
SOURCE: Data from the 2008-2012 ACS Summary File, available at http://www.census.gov/acs/www/data_documentation/summary_file/ [September 2014].
that the population count or proportion in question is exactly zero or 100 percent. The MoEs for zero estimates displayed in published tables are identical for all zero estimates for a given geographic level, and therefore convey no useful information about the precision of those estimates.
Neither the CV nor the MoE alone summarizes the utility of the estimates for all users. In general, for a given tract sample size, the MoE will tend to be smaller for estimates of a rate or proportion closer to zero (0%) or one (100%). The CV will tend to be larger for small estimated values, due to the appearance of the estimate in the denominator of the CV. Furthermore, the CV will differ depending on whether the discussion is about a poverty rate of 5 percent or a 95 percent rate of those not in poverty. A large CV might or might not indicate that an estimate is not useful, depending on the inference being made. For example, if the poverty rate is estimated as 5 percent with a standard error also of 5 percentage points, then the CV is 100 percent and the MoE is 8.2 percentage points. The potential error is too large to accurately assess the number of potential clients for a hypothetical antipoverty program, yet the data are more than adequately accurate for determining that the area falls below a threshold of 25 percent that defines an area of concentrated poverty for the program.
Table 2-2 illustrates that criteria using these two measures may result in opposite conclusions about the precision of ACS estimates. For example, the share of tracts with a CV below or equal to 30 percent, but a confidence interval width that exceeds 10 percentage points, ranges from a low of 24 percent to a high of 84 percent for the five key variables in Table 2-2. Thus, there is no single criterion that data users can use to assess whether ACS estimates are precise enough for their applications.
Of course, the precision of ACS estimates varies by the population size and number of housing units in a tract. In general, both median CVs and the share of confidence interval widths exceeding 10 percentage points decrease as population size and the number of housing units increase, particularly if tracts with CVs equal to zero are excluded from the analysis: see Table 2-2. There is a similar pattern of decline in the share of tracts where the MoE exceeds the estimate. These results indicate that data users who are working with tracts with small population and housing unit counts face the greatest challenges in identifying ACS estimates that are sufficiently precise to serve as a replacement for data from the census long-form sample.
Table 2-3 shows the share of tracts with CVs that meet the 30 percent threshold for several categories of estimates of the prevalence rate of the characteristic in question. In tracts where this rate is very small, the majority of CVs exceed 30 percent, and in some cases even 50 percent. For rates over 10 percent, there is a substantial jump in the share of tracts meeting the 30 percent threshold. As shown in the last column in Table 2-3, a substantial number of tracts have prevalence levels below 10 percent for several
TABLE 2-3 Distribution of Tracts by Variable Categories and CV Categories: 2008-2012 ACS Data (in percentage)
| People in Poverty | CV ≤ 30% | CV > 30% and ≤ 50% | CV > 50% | Percentage of Total | |||||
|
≤ 3% |
1 | 43 | 56 | 8 | |||||
|
> 3% and ≤ 10% |
25 | 62 | 13 | 32 | |||||
|
> 10% and < 20% |
66 | 32 | 2 | 31 | |||||
|
≥ 20% and < 30% |
89 | 10 | 0.6 | 15 | |||||
|
≥ 30% and < 97% |
96 | 3 | 0.8 | 13 | |||||
|
≥ 97% |
0 | 0 | 0 | 0 | |||||
| Renter Occupied | CV ≤ 30% | CV > 30% and ≤ 50% | CV > 50% | Total | |||||
|
≤ 3% |
0.2 | 17 | 83 | 1 | |||||
|
> 3% and ≤ 10% |
25 | 61 | 14 | 8 | |||||
|
> 10% and < 20% |
83 | 16 | 0.7 | 21 | |||||
|
≥ 20% and < 30% |
98 | 2 | 0.2 | 20 | |||||
|
≥ 30% and < 97% |
99 | 0.3 | 0.1 | 49 | |||||
|
≥ 97% |
100 | 0 | 0 | 0.5 | |||||
| Households Receiving SNAP Benefits | CV ≤ 30% | CV > 30% and ≤ 50% | CV > 50% | Total | |||||
|
≤ 3% |
0.4 | 14 | 85 | 16 | |||||
|
> 3% and ≤ 10% |
21 | 62 | 18 | 35 | |||||
|
> 10% and < 20% |
77 | 22 | 1 | 28 | |||||
|
≥ 20% and < 30% |
97 | 3 | 0.2 | 12 | |||||
|
≥ 30% and < 97% |
99 | 0.7 | 0.3 | 9 | |||||
|
≥ 97% |
0 | 0 | 0 | 0 | |||||
| People Who Are Foreign Born | CV ≤ 30% | CV > 30% and ≤ 50% | CV > 50% | Total | |||||
|
≤ 3% |
3 | 35 | 61 | 28 | |||||
|
> 3% and ≤ 10% |
37 | 51 | 12 | 32 | |||||
|
> 10% and < 20% |
81 | 17 | 2 | 19 | |||||
|
≥ 20% and < 30% |
96 | 3 | 0.4 | 9 | |||||
|
≥ 30% and < 97% |
99 | 0.6 | 0.2 | 12 | |||||
|
≥ 97% |
0 | 0 | 0 | 0 | |||||
| Population Aged 25+ with a Graduate or Professional Degree | CV ≤ 30% | CV > 30% and ≤ 50% | CV > 50% | Total | |||||
|
≤ 3% |
4 | 38 | 58 | 17 | |||||
|
> 3% and ≤ 10% |
52 | 43 | 5 | 46 | |||||
|
> 10% and < 20% |
94 | 6 | 0.5 | 23 | |||||
|
≥ 20% and < 30% |
99 | 1 | 0.4 | 9 | |||||
|
≥ 30% and < 97% |
98 | 0.7 | 0.8 | 5 | |||||
|
≥ 97% |
100 | 0 | 0 | 0 | |||||
NOTES: Table excludes tracts where CV = 0. CV is coefficient of variation.
SOURCE: Data from the 2008-2012 ACS Summary File, available at http://www.census.gov/acs/www/data_documentation/summary_file/ [September 2014].
of these key ACS variables. For example, 51 percent of tracts in 2008-2012 have fewer than 10 percent of households receiving Supplemental Nutrition Assistance Program (SNAP) benefits in the past 12 months, and in 60 percent of tracts, less than 10 percent of the population is foreign born. The smaller sample size of the ACS, compared with the census long-form sample, makes it more difficult to study certain population and household characteristics at the tract level due to these lower levels of precision.
Over the years, data users have been raising concerns about the limited precision of tract-level estimates described above, and the Census Bureau has been exploring ways to address the issue. For example, model-assisted estimation was studied as a mechanism for using administrative records information to improve the precision of ACS estimates at the subcounty level and for tracts in particular (Fay, 2006; Starsinic and Tersine, 2007). In fact, model-assisted estimation has been fully incorporated into the ACS weighting schema, and the ACS variances shown in Table 2-1 (above) incorporate its impact.
In addition, the Census Bureau has worked to secure additional funding to increase the overall sample size of the survey. In particular, the annual sample size was increased from 2.90 million to 3.54 million housing units starting in June 2011 (U.S. Census Bureau, 2014a). The first 5-year data release that is fully based on the increased sample size will result in a decrease in ACS standard errors from 60 percent to about 45 percent larger than those for the 2000 census long-form sample. Nonetheless, further changes are necessary to bring ACS standard errors closer to those for the census-based estimates. To reduce the ACS standard errors to be only about 25 percent larger than those from the census (an early ACS design goal discussed in Alexander, 1993a) by increasing the annual sample size, the sample size would have to be increased to about 4.8 million housing units.
Tract-Level Precision Equalization Effort: Overview
Tract sizes vary substantially. Table 2-4 shows the distribution of census tracts by population size and number of housing units for the ACS for 2008-2012. While the majority of tracts have at least 3,000 people, more than one-fourth (27.3%) have population sizes that are smaller, although this group comprises only 14 percent of the total U.S. population. Similarly, only about 13 percent of tracts have fewer than 1,000 housing units, and these comprise only 6 percent of housing units nationwide.
In 2011 the Census Bureau instituted a tract-level reallocation program to shift sample from geographic areas with larger populations to
TABLE 2-4 Distribution of Tracts by Population Size and Number of Housing Units: 2008-2012 ACS Data
| Tract Total Population Sizea | Number of Tracts | Percentage of Tractsb | Percentage of Population | |||||
| 1-999 | 757 | 1.0 | 0.1 | |||||
| 1,000-2,999 | 18,967 | 26.2 | 13.8 | |||||
| 3,000,4999 | 30,593 | 42.2 | 39.2 | |||||
| 5,000,6999 | 16,274 | 22.5 | 30.7 | |||||
| 7,000+ | 5,836 | 8.1 | 16.1 | |||||
| Total | 72,427 | |||||||
| Tract Total Number of Housing Units | Percentage of Housing Units | |||||||
| ≤ 400 | 812 | 1.1 | 0.1 | |||||
| 401-1,000 | 8,651 | 11.9 | 5.2 | |||||
| 1,001-2,000 | 37,170 | 51.3 | 42.6 | |||||
| 2,001-4,000 | 24,842 | 34.3 | 48.5 | |||||
| 4,001-6,000 | 824 | 1.1 | 2.9 | |||||
| 6,001+ | 128 | 0.2 | 0.7 | |||||
| Total | 72,427 | |||||||
aTracts with zero population were excluded from the analysis.
bTotals may not sum to 100 percent due to rounding.
SOURCE: Data from the 2008-2012 ACS Summary File, available at http://www.census.gov/acs/www/data_documentation/summary_file/ [September 2014].
areas with smaller populations (Sommers and Hefter, 2014; U.S. Census Bureau, 2014b). The goal of the reallocation was to make CVs more nearly equal for census tracts and for governmental, political, and administrative areas. The old and new sampling plans for census tracts are compared in Table 2-5. The samples reallocated to the smaller sized areas mostly come from large tracts with 4,000 or more housing units, which in general had smaller than average CVs before the reallocation.
Under the sample reallocation program, instead of two sampling ratios, the plan used six different rates, based on the number of housing units. The overall goal was to equalize the level of precision across all tracts by improving the precision in tracts with fewer than 2,000 housing units at the expense of larger tracts. Under the reallocation, sampling rates are 2.5
TABLE 2-5 Sampling Rates by Size of Tract, 2009 and 2013 ACS
| Tract Measure of Size | 2009 Average of Postreduction Sampling Rates | 2013 Average of Postreduction Sampling Rates | Ratio of 2013 Sampling Rate to 2009 Sampling Rate |
| 0 < TMOS < = 400 | 2.141 | 5.275 | 2.464 |
| 400 < TMOS < = 1,000 | 2.141 | 4.220 | 1.971 |
| 1,000 < TMOS < = 2,000 | 2.141 | 2.562 | 1.197 |
| 2,000 < TMOS < = 4,000 | 1.573 | 1.507 | 0.958 |
| 4,000 < TMOS < = 6,000 | 1.573 | 0.904 | 0.575 |
| 6,000 < TMOS | 1.573 | 0.528 | 0.335 |
NOTES: Postreduction sampling rates refers to sample adjustment for blocks in tracts where the Census Bureau predicts a level of completed mail and computer-assisted telephone interviews (CATI) of at least 60 percent and where at least 75 percent will be mailable addresses (see U.S. Census Bureau, 2014a). TMOS is a tract measure of size.
SOURCE: Alvarez and Salvo (2014).
times higher for tracts with fewer than 400 housing units, almost twice as high for tracts with 400 to 1,000 units, and about 1.2 times higher for tracts with between 1,000 and 2,000 units.
There was an increase in the sample size for close to two-thirds of all census tracts in the nation, with the majority (51 percent) receiving a 20 percent increase: see Figure 2-3. Most of the remaining census tracts are in the category of 2,000-4,000 housing units, and for them the sample size was reduced by a little more than 4 percent. This category accounts for about one-third of all census tracts and contains a little less than one-half of the nation’s housing units. The tracts that lost the most in the sampling change contain 4,000 or more housing units and constitute 1 percent of the nation’s census tracts (and about 3 percent of the nation’s housing stock).
Beyond these initial sampling rates varying by the measure of size of the sampling stratum (defined by tracts and other geographic units), weighting factors also vary by the level of subsampling prior to follow-up by a computer-assisted personal interview (CAPI) (depending on the level of household responses to mail or telephone at the tract level) and other factors (U.S. Census Bureau, 2014a). The combination of all these components contributes to large differences in the final weights computed for each responding household and person. In particular, differential sampling rates at the tract level imply that heterogeneity is introduced when tracts with different sampling rates are combined to create larger geographic areas for analysis. Relative to a sample design with proportional sampling (i.e., uniform sampling rates), this heterogeneity in final weights increases the sampling variance of estimates from the combined geographic areas. Greater
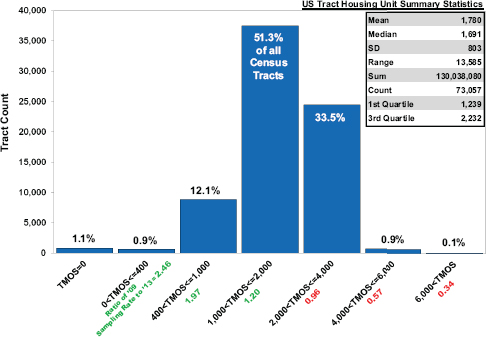
FIGURE 2-3 Tract measure of size strata tract counts, 2006-2010 ACS.
NOTE: TMOS is a tract measure of size.
SOURCE: Alvarez and Salvo (2014).
degrees of sampling rate heterogeneity (i.e., differential final weights) will result in greater increases to the sampling variance.
While it is understandable that the Census Bureau would want to reduce the largest tract-level CVs (in tracts with less than 1,000 housing units, especially those with less than 400 housing units), it is best to do so only when there is a good policy rationale. It could be argued that increasing the sample sizes associated with small governmental units to improve precision of their estimates does constitute such a rationale. However, the case for doing so for small tracts is much less clear, since tracts are only statistical areas for calculation and reporting of census results and have no necessary relationship to political or administrative units.
To assess this issue, we cross-tabulated the distribution of tract sizes by the sizes of their counties. We chose counties to represent governmental units because they are clearly defined in census data, they are commonly used in federal resource allocation and Census Bureau estimation programs, and counties with small populations are likely to contain small governmental units that also have small populations. Results by quintiles are presented in Table 2-6. The distribution of tract sizes within the varying sizes of
TABLE 2-6 Distribution of Tract Sizes Relative to the Size Distribution of Counties
| Tract Quintiles by Population Size | For Each County Quintile, the Percentage of Tracts Belonging to Each Tract Quintile | ||||||
| County Quintiles by Population Size | |||||||
| 1st | 2nd | 3rd | 4th | 5th | |||
| 58-74,641 | 74,642-251,643 | 251,644-627,362 | 627,363-1,408,480 | 1,408,481-9,787,514 | Total Number of Tracts | ||
| 1st | 1-2,645 | 23.1% | 18.6% | 20.9% | 19.8% | 17.6% | 14,639 |
| 2nd | 2,646-3,567 | 22.3% | 18.9% | 19.7% | 20.4% | 18.7% | 14,645 |
| 3rd | 3,568-4,463 | 20.9% | 19.4% | 19.1% | 19.9% | 20.7% | 14,646 |
| 4th | 4,464-5,673 | 18.3% | 20.4% | 19.7% | 20.5% | 21.1% | 14,639 |
| 5th | 5,674-36,880 | 15.4% | 22.6% | 20.7% | 19.4% | 22.0% | 14,646 |
| Total Number of Tracts | 14,651 | 14,660 | 14,666 | 14,861 | 14,377 | 73,215 | |
counties is remarkably uniform. (Results are similar for finer tabulations by deciles.) Given these results, it appears that changing the sample rates for low-population tracts is not likely to be an efficient method to improve precision for low-population small governmental units, offering very limited support for the potential benefits of tract equalization.
Thus, it can be argued that the increase in sample size for the small tracts likely cannot increase their precision to an acceptable level, while the reduction in sample size for some of the large tracts may lead to the loss of what was previously adequate precision. Broadly speaking, tract equalization only has the effect of moving the majority of tracts with the lowest level of precision (sample sizes of less than 100) and tracts with 301+ sample size into one of the two categories associated with sample sizes between 100 and 300. Furthermore, using counties as a proxy for potential benefit of tract equalization to small governmental units, Table 2-6 provides little support for such a position, given that tract sizes appear to be fairly uniformly distributed across various county sizes, including small counties.
Beyond the increased sampling rates, the lower CV outcome associated with the smallest governmental units (see Table 2-6) may be partly attributed to another design change, which increased the nonresponse sampling rate to 100 percent in selected areas. The justification for this change is unclear. A rule of thumb for the ACS survey design operations that is applied to other aspects of the ACS program calls for the nonresponse sampling rate to be roughly set to 1/square root (cost ratio), that is, the ratio of cost per nonresponse (CAPI) completed interview to the combined cost per completed interview by Internet, mail, or CATI (see Chapter 3 for details). Thus, the allocation of data collection resources in some of the smallest governmental units may not be optimal.
Table 2-7 compares sampling rates and CVs for 2010 and the 2011 reallocation by sampling stratum. The CVs are theoretical 5-year CVs calculated from Census Bureau simulations and theoretical 5-year CVs calculated from the weighted sample year rates. The table shows that initial production results under the reallocation program had the intended impact in smoothing out the median CV across various sized tracts. That is, tracts with 4,001-6,000 housing units and 6,001 or more housing units have CVs increasing from 20 and 15 percent to 29 and 28 percent, respectively, while CVs for tracts with 400-1,000 housing units decrease from 41 to 29 percent (Sommers and Hefter, 2014).
While the CV equalization effort appears to have had the intended impact of smoothing median CVs across tracts sizes, the policy justifications are not evident, given the increased inefficiencies in the sample design (due to increased differential weights) in the case of estimates for governmental units associated with larger geographic areas or populations. Furthermore, any statistical inefficiency associated with this program could have unan-
TABLE 2-7 Comparison of Results from 2011 and 2010 Production Data (in percentage)
| New Stratum | 2011 | 2010 | |||
| Sampling Rate | CV | Sampling Rate | CV | ||
| 0 < GUMOS ≤ 200 | 15.00 | 22 | 10.00 | 40 | |
| 200 < GUMOS ≤ 400 | 10.00 | 22 | 6.67 | 26 | |
| 400 < GUMOS ≤ 800 | 7.00 | 23 | 6.67 | 26 | |
| 800 < GUMOS ≤ 1,200 | 3.84 | 26 | 3.33 | 28 | |
| 0 < TMOS ≤ 400 | 4.77 | 41 | 2.18 | 65 | |
| 1,000 < TMOS ≤ 2,000 | 4.37 | 44 | 2.00 | 69 | |
| 400 < TMOS ≤ 1,000 H.R. | 3.83 | 29 | 2.20 | 41 | |
| 400 < TMOS ≤ 1,000 | 3.53 | 30 | 2.03 | 41 | |
| 0 < TMOS ≤ 400 H.R. | 2.33 | 28 | 2.20 | 29 | |
| 1,000 < TMOS ≤ 2,000 H.R. | 2.14 | 29 | 2.03 | 30 | |
| 2,000 < TMOS ≤ 4,000 | 1.36 | 28 | 1.62 | 26 | |
| 4,000 < TMOS ≤ 6,000 H.R. | 1.26 | 29 | 1.49 | 27 | |
| 6,000 < TMOS | 0.82 | 28 | 1.61 | 19 | |
| 4,000 < TMOS ≤ 6,000 | 0.76 | 29 | 1.49 | 20 | |
| 2,000 < TMOS ≤ 4,000 H.R. | 0.48 | 28 | 1.60 | 15 | |
| 6,000 < TMOS H.R. | 0.44 | 28 | 1.48 | 15 | |
NOTES: GUMOS is a governmental unit or tract measure of size that is assigned to every block. TMOS is a tract measure of size. H.R. is a high response strata.
SOURCE: Sommers and Hefter (2014, p. 7).
ticipated adverse consequences for estimates concerning small populations that are not defined by geography, such as small ethnic populations. Also, as noted above, equalization of CVs does not imply equalization of other statistics that summarize precision, such as the margin of error, that might better reflect data quality for some uses.
Given this, the panel concludes that there has been little benefit from tract equalization. That is, tracts still need to be combined in some fashion to produce sufficiently precise estimates because of small sample sizes, but the increases in variances associated with larger geographies from this tract CV smoothing effort is potentially counterproductive and not dealing with the real challenges being faced by ACS data users. The next section presents a case study to illustrate these CV equalization sample design issues and implications.
Tract-Level Precision Equalization Effort: New York City Case Study
Figure 2-4 illustrates the general lack of precision at the tract level in New York City. Making reasonably precise comparisons between areas within the city requires “neighborhoods” to be defined as groups of adjacent census tracts. The effect of aggregation on the precision of estimates, where its 2,168 census tracts were aggregated into 188 neighborhood tabulation areas,5 can be seen in the substantially reduced median CVs for three example variables: people who are foreign born; people with incomes below the poverty line; and households with high rent burden (defined as households for which rent is more than 35 percent of household income). Based on data from the 2008-2012 ACS, the median CV for all three variables is just one-third of the level for neighborhood tabulation areas compared with census tracts. Thus, in exchange for a loss of geographic specificity, there is a large gain in the precision of ACS estimates.
Continuing the New York City illustration, the impact of the increase in the degree of differential sampling was assessed in a simulation using the city’s neighborhood tabulation areas as a case study. In addition, the degree to which changes in sample size as a result of the new scheme affected variance in the estimates was examined. Data for the 2006-2010 ACS 5-year estimates were used because these were not subject to the new sampling scheme. This choice allowed for a comparison between the now obsolete sampling plan and the new plan adopted in 2011. The number of married-couple families was selected as a test variable.
The impact of differential sampling was present under the old sampling plan as well as the new plan, but it was expected that the new plan would further exacerbate the impact because of the increased number of sampling strata and the degree of differential sampling rates (see Table 2-7, above). Under the sampling plan used prior to 2011, there were just two initial sampling rates in place for census tracts (see Table 2-5, above), and the ratio of the rates was only 1.36. The evaluation of New York City’s 188 neighborhood tabulation areas indicates only a small marginal increase in sampling variance associated with the aggregation of tracts with differential final weights under the old design. The median CV increase for married-couple families was only 0.8 percent, with a maximum of about 2.1 percent. This result is a reflection of the fact that under the old design the sampling rates and resulting final weights of combined tracts were not different enough
______________
5Neighborhood tabulation areas were created as aggregates of whole census tracts, with a minimum population requirement of 15,000. The median population size of an area is 34,000 (2008-2012). Because of large developments in New York City, the high population density of some neighborhoods, and physical boundary features, a small number of neighborhoods have populations of more than 50,000 people.
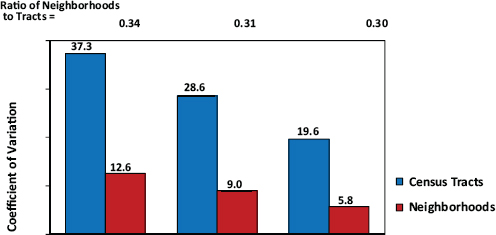
FIGURE 2-4 Median coefficients of variation (CVs) for selected variables, New York City census tracts and neighborhoods, 2008-2012.
NOTES: CVs for tract estimates of zero were omitted. For neighborhood tabulation area aggregations, margins of error associated with tract estimates of zero were converted to zero.
SOURCE: Alvarez and Salvo (2014).
to inflate the variance to any large degree among neighborhood tabulation areas in New York City.
Under the new plan, the effect of differential sampling is estimated to raise the median CV by 3.9 percent. While this median effect is somewhat limited, it is not insignificant. At the 75th and 90th percentiles, the estimated increases to the CVs are 6.5 and 9.1 percent, respectively. Furthermore, there are several neighborhood tabulation areas where the differential sampling rates associated with the new design will result in CVs that are larger by 12 percent or more than they would have been under the old design: see Figure 2-5.
In addition to the effect of a greater differential sampling rate, there is the effect of the sample size itself, which rose or declined with the new sample plan (for a more detailed discussion of this, see Salvo, 2014). When combined with the effect of differential sampling, a picture of changes related to the new sampling plan emerges as a result of the sample reallocation. An interesting observation was that New York City actually received more ACS sample under the new plan than under the old plan, which resulted in a net overall reduction in the CVs. This occurred mostly because more than twice as many census tracts in New York City relative to the nation were in the category of 400-1,000 housing units—28 percent compared with 12 percent nationally. As shown above, the sample for these
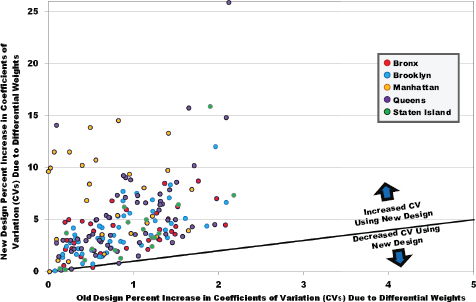
FIGURE 2-5 Incremental design effects for disproportionate sampling of tracts within neighborhood tabulation areas, comparing pre-2011 ACS design to revised (2011) design.
NOTES: Plotted quantities represent the percent increase in CV due to disproportionate sampling relative to the CV for proportional sampling for estimates of number of married-couple families in New York City neighborhood tabulation areas. Each of the designs is applied to the population distribution of ACS 2006-2010 data. In this analysis tract margins of error for estimates of zero were adjusted to zero. Tracts in parks, airports, and the Rikers Island neighborhood tabulation areas were excluded.
SOURCE: Alvarez and Salvo (2014) based on the ACS 2006-2010 Summary File.
tracts under the new plan was almost twice what it had been under the old plan. This outcome may have something to do with the nature of the census tract review process over the decades. Emphasis has always been placed on maintaining boundaries of census tracts over time for comparability purposes.
The overall picture by neighborhood tabulation areas in New York City shows that in most areas of the city there was a net gain in the precision of estimates due to increases in sample size, but there are a number of notable exceptions that point to the risks inherent in summary statistics. In Manhattan and a small number of census tracts in the other boroughs, a diminution in sample size occurred because the neighborhood tabulation areas were created using large and dense component census tracts that took
substantial sample cuts under the new plan. These areas are very dense as a result of large buildings (large parts of Manhattan) or because of large and concentrated housing developments that have distinct physical features (Co-op City in the Bronx) that do not permit subdivision into smaller areas. Thus, in addition to tracts of different size being aggregated, there was also a loss of sample in neighborhood tabulation areas characterized by very large tracts, especially in Manhattan, and this played an important role in the increases in CVs. As shown in Figure 2-6, while most neighborhood tabulation areas in the city outside of Manhattan gained as a result of the new sample allocation plan, none of the Manhattan neighborhood tabulation areas were improved. However, the level of precision is high enough in comparisons with other neighborhood tabulation areas, and thus suitable for policy development and program planning and implementation.
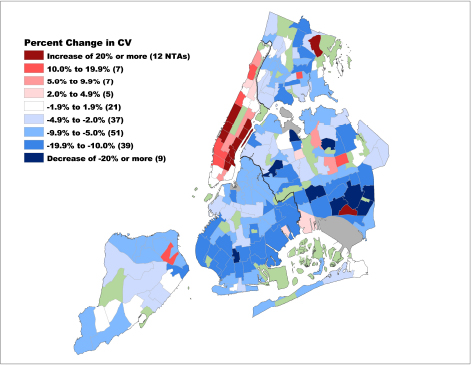
FIGURE 2-6 Effects of differential sampling rates and sample size on CVs for number of married-couple families, New York City neighborhood tabulation areas, ACS 2006-2010.
NOTES: In this analysis, tract margins of error for estimates of zero were adjusted to zero. Tracts in parks, airports, and the Rikers Island neighborhood tabulation areas were excluded.
SOURCE: Alvarez and Salvo (2014).
CONCLUSIONS AND RECOMMENDATIONS
Under the current overall sample size limitations, sample reallocation to ensure CV equalization at the tract level achieves little benefit to precision, and it creates inefficiencies in the geographic aggregation of estimates. The latter is of concern because aggregation is a strategy the Census Bureau has been recommending to users in order to counteract challenges associated with low precision at the tract level.
The allocation of data collection resources expended in some of the smallest governmental units under the revised sample design may also be inefficient because of the increase in the nonresponse follow-up sampling rate to 100 percent in selected areas. The availability of additional funds to improve the precision of estimates would be better used to increase the initial designated sample size, rather than to increase the nonresponse sampling rate.
The panel does not recommend any immediate changes to the sample design, but it is essential to integrate policy considerations in all further research on sample design. This will help ensure that the ACS is responsive to data user needs and that the design of the survey is optimally cost efficient.
RECOMMENDATION 2: Future sample redesigns of the American Community Survey should consider whether there are explicit rationales based on identified data needs that justify deviations from proportional allocation of sample. Due regard should be given to the effects of reallocation on estimates for policy-relevant small geographic areas and nongeographically defined small groups.
RECOMMENDATION 3: Efforts to improve the precision of the American Community Survey estimates for specific small governmental units should be focused on increasing the initial designated sample size while maintaining the optimal nonresponse sampling rate instead of increasing the subsampling rate to 100 percent.


