
2
Scientific Background: Radio Astronomy Service
The comprehensive study of cosmic objects at radio frequencies began following the serendipitous discovery of celestial radio emission in 1932 by Karl Jansky of the Bell Telephone Laboratories, as a by-product of studies of system and thermal noise in radio-telephone systems. Since this initial discovery, radio astronomers have made many important discoveries, including several recognized by the awarding of Nobel prizes (Box 2.1). The science of radio astronomy has grown remarkably over the years, becoming a major tool of modern astronomy and astrophysics.1 Due to the extreme physical conditions associated with some celestial objects, radio observations permit the study of a wide range of physical environments, including extremes in density, temperature, pressure, and unusual chemical compositions that cannot be reproduced on Earth.
Radio emission from celestial objects arises under conditions that are different from those processes that produce visible radiation. The light waves studied by optical astronomers originate from objects such as stars and circumstellar nebulae. Celestial radio waves, however, come from diverse environments that are not always accessible at other wavelengths (see, for example, Figure 2.1). Indeed, studies at radio wavelengths often reveal new classes of objects. Moreover, study by radio astronomers of the same celestial objects that optical astronomers study provides independent insight into the physical processes that are not probed at other wavelengths.
Study of the radio emission from celestial sources provides unique insight into the formation, evolution, and physical characteristics of a wide range of astronomical objects and phenomena. Of particular importance for research into the formation and evolution of celestial objects is the fact that some astronomical sources of radio waves are at the farthest limits of the known universe. Observations of these distant sources provide information about the condition of the universe a very long time ago because the radio waves from these sources have been traveling for many billions of years (see Figure 2.2). On the
_____________
1 For background information from technical papers regarding the technical capabilities of the Radio Astronomy Services, see the following: T.L. Wilson, K. Rohlfs, and S. Huettemeister, Tools of Radio Astronomy, 6th ed., December 2013; and A.R. Thompson, J.M. Moran, and G.W. Swenson, Interferometry and Synthesis in Radio Astronomy, 2nd ed., May 2001.
BOX 2.1
Nobel Prizes Awarded for Contributions Made by Radio Astronomers
2006—John C. Mather and George F. Smoot for their discovery of the blackbody form and anisotropy of the cosmic microwave background radiation that traces the fluctuations responsible for all the structures seen in the universe.
1993—Russell Alan Hulse and Joseph Hooton Taylor Jr. for the discovery of a new type of pulsar, a discovery that has opened up new possibilities for the study of gravitation.
1978—Arno Allan Penzias and Robert Woodrow Wilson for their discovery of cosmic microwave background radiation.
1974—Sir Martin Ryle and Antony Hewish for their pioneering research in radio astrophysics: Ryle for his observations and inventions, in particular of the aperture synthesis technique, and Hewish for his decisive role in the discovery of pulsars.
other hand, other sources of radio waves are in our backyard: the Sun and Jupiter both exhibit bursts of radio emission. Specific examples of the scientific use of the radio spectrum for astronomical research are highlighted in the following sections.
2.1.1 Types of Radio Emission: Radio Continuum
The discovery of radio sources and the bulk of current knowledge about their nature and distribution, and about the processes responsible for the radio emission from them, have come through observations of the continuum radiation. Continuum observations consider the broad variation of emission with frequency (see Figure 2.3). Individual measurements are made with broadband detectors that span up to 8 GHz and are therefore sensitive to interference over a large range of frequencies, from meter to millimeter wavelengths (several MHz to hundreds of GHz). The radio continuum arises from three main processes, all of which have major application in the study of astronomical objects:
- Thermal (blackbody) radiation following the Planck law, that is emitted by objects according to their physical temperature,
- Free-free emission, which is produced in an ionized gas of freely colliding electrons and protons with an intensity proportional to the temperature of the electrons, and
- Non-thermal emission, mostly produced by incoherent synchrotron radiation, in which very high energy electrons spiral around magnetic-field lines, and also by a variety of coherent processes, such as plasma and cyclotron radiation.
An additional effect arises from the Inverse Compton effect, in which relativistic electrons in foreground galaxies shift the photons emitted by the microwave background to higher energies, thus producing an apparent absorption in the radio band. This is also known as the Sunyaev-Zel’dovich (SZ) effect.
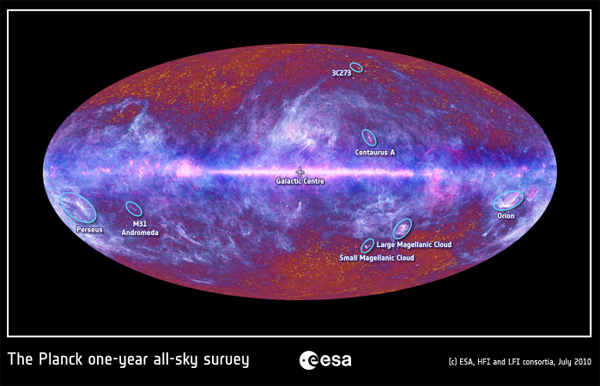
FIGURE 2.1 Multi-frequency all-sky image of the microwave sky composed using data from the European Space Agency (ESA)/NASA Planck satellite covering the electromagnetic spectrum from 30-857 GHz. The mottled structure of the cosmic microwave background radiation (CMB), with its tiny temperature fluctuations reflecting the primordial density variations that are the origin of today’s cosmic structure, is clearly visible in the high-latitude regions of the map. The central band is the plane of our galaxy. A large portion of the image is dominated by the diffuse emission from its gas and dust. The great spiral galaxy in Andromeda, 2.2 million light years from Earth, appears as a sliver of microwave light, released by the coldest dust in its giant body. Other, more distant, galaxies with supermassive black holes appear as single points of microwaves dotting the image. The image was derived from data collected by Planck during its first all-sky survey, and comes from about 12 months of observations. SOURCE: ESA, “The Microwave Sky as Seen by Plank,” July 2010, http://www.esa.int/spaceinimages/Images/2010/07/The_microwave_sky_as_seen_by_Planck. Copyright ESA/HFI and LFI consortia.
Observations of continuum intensities at a number of frequencies are used to determine the characteristic spectra of sources, but because the distribution of continuum radiation with frequency is relatively smooth, observations of this kind do not need to be made at specific or closely adjacent frequencies. Using a wide signal bandwidth allows higher sensitivity to be obtained because the Gaussian noise is reduced by a factor proportional to the square root of the bandwidth. At high frequencies, bandwidths of up to 8 GHz are commonly used for single antennas such as the Green Bank Telescope (GBT), as well as arrays such as the Very Large Array (VLA). The radio bands, particularly those at frequencies below 3 GHz, are especially valuable for the study of quasars, radio galaxies, pulsars, radio transients, the Sun, and planets in our solar system and beyond. At the high frequency end, continuum observations at frequencies above 20 GHz are used for the study of the angular distribution, polarization, and fine structure of the 2.7 K cosmic microwave background (see Figure 2.1), a remnant of the Big Bang.
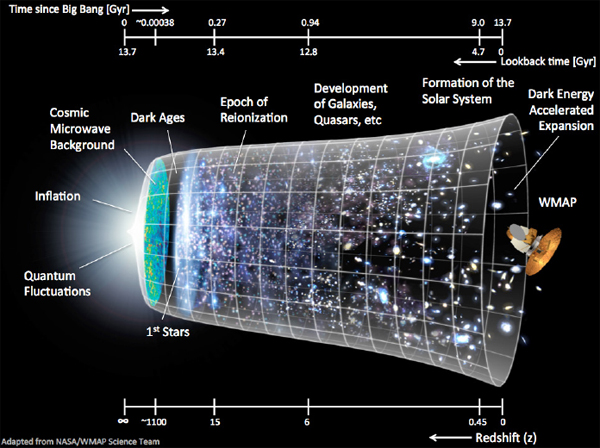
FIGURE 2.2 Schematic of the development of the universe, with time on the upper horizontal axis and redshift (see Box 2.2) on the lower horizontal axis. The development started with the Big Bang, 13.7 Gigayears in the past. Immediately after the Big Bang, matter was hot and ionized. With expansion, the ionized material cooled, with matter and radiation decoupling. The remnant of the Big Bang that is detected as the cosmic microwave background formed at a redshift, z, of about 1100. After redshift 1100, the matter became neutral, until stars formed. Between redshifts of 15 to 6, the first generations of stars, galaxies, and quasars re-ionized matter, resulting in the so-called Epoch of Reionization (EoR). After the EoR, galaxies continued to form and evolve; within the Milky Way Galaxy, our solar system formed only 4.7 Gyr ago. At the present time, the expansion rate of the universe appears to be accelerating, which is attributed to Dark Energy. SOURCE: Adapted from NASA/WMAP Science Team, “Timeline of the Universe,” page updated December 21, 2012, http://map.gsfc.nasa.gov/media/060915/index.html.
2.1.2 Types of Radio Emission: Spectral Lines
Spectral line radiation is emitted when an atom or molecule undergoes a radiative transition between energy levels. This radiation is emitted at a well-defined frequency and thus results in a line in the radio spectrum (Figure 2.4). For molecules, many of the rotational and vibrational transitions occur in the centimeter and millimeter wavebands, so many spectral line studies, including the discovery in outer space of new molecular species, can only be carried out in the radio part of the spectrum. In addition,
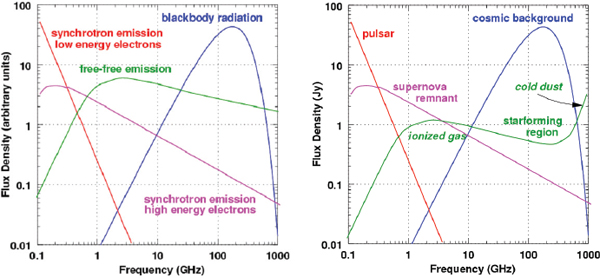
FIGURE 2.3 Left: Continuum spectra produced by various emission mechanisms. Right: Types of astronomical sources that produce the corresponding radio continuum emission. The flux levels shown correspond to the strongest known sources. A Jansky (Jy) is 10-26 W m-2 Hz-1.
radio techniques allow spectral lines to be observed with very high frequency resolution that cannot be attained by techniques commonly employed at other wavelengths.
Each atomic and molecular species has its own unique set of spectral lines. The radio spectral lines of atoms arise from hyperfine transitions or electron recombination. One of the most fundamental and widely observed lines occurs at 1420 MHz, which arises from neutral atomic hydrogen. Studies of this line provide an important tracer of the most abundant element in the universe within the interstellar clouds in the Milky Way and other galaxies. Molecular lines typically come from changes in the rotational energy of the molecule. Studies of the different transitions of the abundant carbon monoxide (CO) molecule at 115, 230, 345 GHz, and beyond (Figure 2.5) provide fundamental information about the nature and distribution of the densest forms of the interstellar medium.
Observations of spectral lines allow astronomers to measure the Doppler shift arising from the relative motion of the source and the observer. The observed frequency of the spectral line, often reported as the redshift (Box 2.2), is a combination of the systemic motion of the celestial object and local kinematic motions of the emitting or absorbing medium. Study of the source location, kinematics, and angular sizes of the regions provide important information about the physical conditions in and near the source and about motions within the source.
Many spectral lines from a variety of atomic species and from a large number of molecules have been found in interstellar space and in the atmospheres of stars, planets, and comets. This rapid expansion of our knowledge has led to the development of a new and exciting branch of astronomy: astrochemistry, which emphasizes the synthesis of interstellar molecules and the evolution of dense interstellar gas, including its role in the formation of stars and later stages of the lives of stars. Because planets form as a by-product of star formation, knowledge of interstellar chemistry and the origins of molecular species are vital to an understanding of the early planetary chemistry and the origin of life. Spectral lines from more than 155 different molecular species have now been detected in interstellar
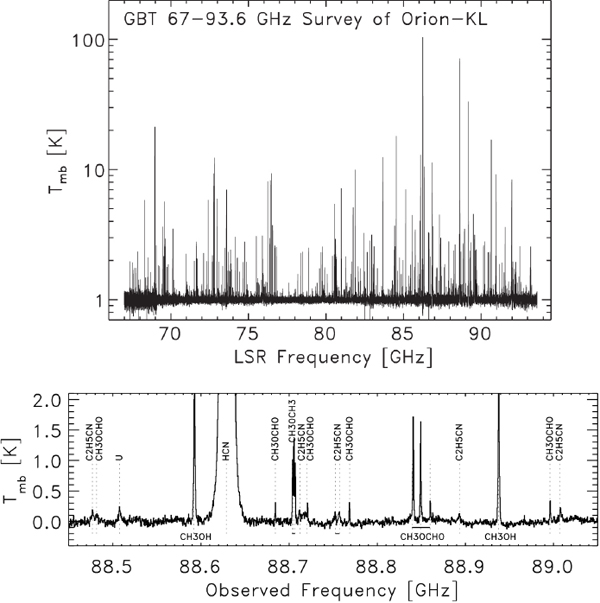
FIGURE 2.4 Orion-KL Spectrum. Top: 67 to 93.6 GHz spectrum of the high-mass star forming region in the Orion-KL nebula. The observations were made with the Green Bank Telescope with a spectral resolution of 390 kHz. At least 727 individual spectral features of dozens of different molecular species are seen. Bottom: Expanded view in frequency and sensitivity of a frequency range. Spectral features are marked by the dotted lines and labeled by species. For clarity, the dotted lines of neighboring transitions from the same species are connected by a solid line below the spectrum. The feature labeled with a “U” is unidentified. SOURCE: D.T. Frayer, R.J. Maddalena, M. Meijer, L. Hough, S. White, R. Norrod, et al., The GBT 67-93.6 GHz Spectral Line Survey of Orion-KL, Astronomical Journal 149:162-166, 2015; courtesy of NRAO/AUI.
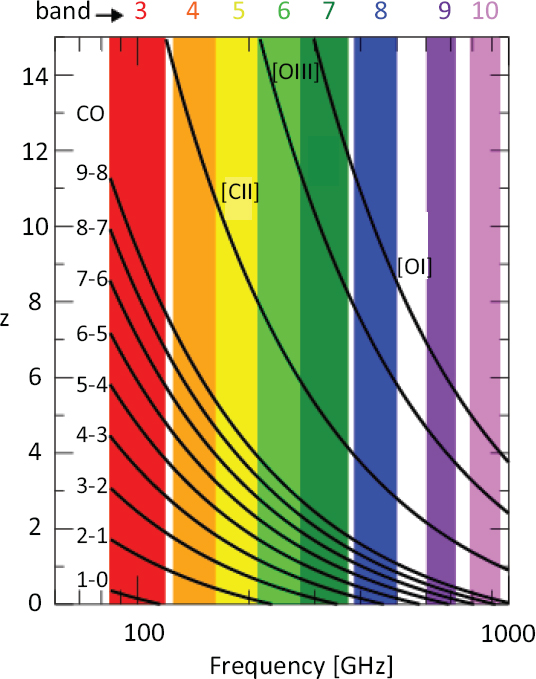
FIGURE 2.5 The expansion of the universe results in an apparent Doppler shift of spectral lines for distant sources. The parameter z [(femit − fobs)/fobs] is known as the redshift. Illustrated here are the redshifted frequencies for selected CO rotational transitions and the [CII] 158 micron, [OIII] 88 micron, and [OI] 63 micron fine structure lines. The color-shaded vertical regions indicate the frequency range of the Atacama Large Millimeter Array receivers (bands). Observations of multiple CO lines from the same source enable the study of the physical conditions (temperature and density) associated with molecular clouds and star forming regions in both nearby and extremely distant objects. SOURCE: Adapted from R. Maiolino, Prospects for AGN studies with ALMA, New Astronomy Reviews 52(6):339-357, copyright 2008, with permission from Elsevier.
BOX 2.2
Redshifts and the Early Universe
The expansion of the universe stretches electromagnetic waves such that they are received on Earth at a frequency lower than the frequency at which they were emitted. This effect is known as a redshift, z, because light is shifted toward the red end of the spectrum because of this expansion. In addition, because the velocity of light is finite, light from distant galaxies was emitted at earlier times and has been stretched more than light emitted from nearby objects, resulting in a direct correspondence between the observed redshift and the distance to an extragalactic source. However, while measurement of an object’s redshift is relatively straightforward and precise, usually based on the observed frequencies of known spectral lines, determination of an accurate distance for a celestial object is much more difficult. Thus, astronomers often refer to the redshift of a source rather than its distance. Further, by taking advantage of the finite travel time for light, astronomers can “look back in time” by observing high redshift (distant) galaxies to see the universe at earlier epochs. The correspondence between redshift and lookback time is illustrated in Figure 2.2.
clouds (Table 2.1). Many of these are quite complex organic molecules, which raises questions about how far interstellar chemical evolution progresses toward creating the chemical precursors of life and how widespread the phenomenon of life might be in the universe.
With a better understanding of interstellar chemical evolution, it has also become possible to use the relative strengths of lines of certain molecules to determine the physical and chemical conditions in interstellar clouds and circumstellar envelopes. Thus, some specific molecular lines have proved to be exceptionally valuable diagnostic tools that require special attention. Appendixes C, D, and E in this handbook list the spectral lines considered by the International Astronomical Union (IAU) to be the ones most important to astronomy (as of 2015) and, if they lie in an allocated band, their protection status is listed. In addition to the value of some molecular lines as diagnostic tools, because molecular transitions occur throughout the electromagnetic spectrum, observations of transitions of interstellar molecules at all frequencies improve our understanding of the physical nature and composition of the interstellar medium. For this reason, it is important that all spectrum users take all practical steps to minimize the pollution of the spectrum with unnecessary emissions.
2.1.3 Atmospheric Windows and Frequency Bands for Radio Astronomy
The allocation of spectral bands for radio astronomy science applications is based partly on the atmospheric windows available, as shown in Figure 2.6. Ground-based radio telescopes can observe only in the regions of the atmosphere that are not obscured. Below 50 GHz, there is a window between approximately 15 MHz and 50 GHz. Above 50 GHz, such radio windows occur at wavelengths around 3 mm (65-115 GHz), 2 mm (125-180 GHz), and 1.2 mm (200-300 GHz). At wavelengths shorter than 1 mm, the so-called submillimeter bands, the windows are less distinct, but clear ones exist at 0.9 mm (325-375 GHz), 0.7 mm (375-500 GHz), 0.45 mm (600-720 GHz), and 0.35 mm (780-900 GHz), as well as in other, smaller, windows.
Within these atmospheric windows, many scientifically important parts of the spectrum have been protected for astronomical research (see Chapter 5). Radio astronomers regularly use frequencies
TABLE 2.1 Astrophysical Molecules, Grouped by Number of Atoms, Found in Interstellar Clouds of Various Sorts
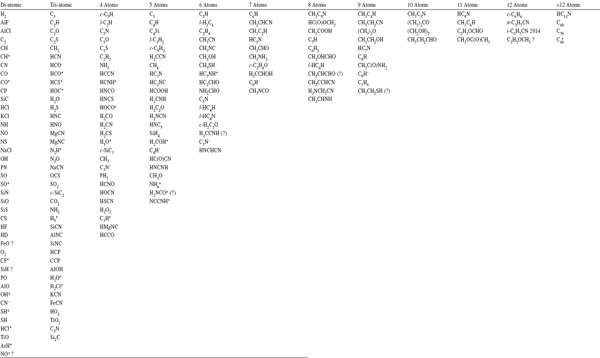
NOTE: Tentative detections, which have a reasonable chance to be correct, are indicated by “?”. Some detections that have been reported as secure ones are indicated by “(?)” because (partial) overlap of lines cannot be ruled out at the moment or because the line list is somewhat small.
SOURCE: Universität zu Köln, Physikalisches Institut, “Molecules in Space,” October 2015, http://www.astro.uni-koeln.de/cdms/molecules.

FIGURE 2.6 Atmospheric windows in the radio spectrum commonly used in the Radio Astronomy Service correspond to regions with high atmospheric transmission. Radio observatories with high-frequency receivers are usually located at high elevations, and at historically dry sites, to minimize atmospheric attenuation of cosmic signals. The atmospheric transmission at the top of Mauna Kea, Hawaii, is shown for three values of precipitable water vapor (0.62 mm, 0.91 mm, and 1.44 mm) corresponding to the best 10% (black), 25% (red), and 50% (blue) conditions at the site. SOURCE: P. Tremblin, N. Schneider, V. Minier, G.Al. Durand, and J. Urban, Worldwide site comparison for submillimetre astronomy, Astronomy and Astrophysics 548:A65, 2012; see also N. Schneider, J. Urban, and P. Baron, Potential of radiotelescopes for atmospheric line observations: Observation principles and transmissioncurves for selected sites, Planetary and Space Science 57(12):1419-1433, copyright 2009, with permission from Elsevier.
from the lowest allocated radio astronomy band at 13.36-13.41 MHz to frequencies above 1000 GHz. However, with the discovery of new astronomical objects and the development of better equipment and techniques, much needs to be done to protect the current allocations and to meet the needs of modern research. The following areas are of particular importance:
- Many of the currently allocated bands have insufficient bandwidths. Originally, given the technology available to radio astronomy, bandwidths of approximately 1 percent of the center frequency were adequate. With modern technology, more bandwidth is essential for high-sensitivity measurements, which depend on averaging for noise reduction.2 The Doppler shift of spectral lines due to the expan-
_____________
2 Radiometric noise reduction is achieved by increasing the number of effective samples, which means increasing the product of the time spent observing the source and the bandwidth of these observations. Increasing the time spent observing the source is limited by practical considerations, such as amplifier stability and atmospheric variability, which drives the need for wide bandwidths.
-
sion of the universe or local motions of astronomical objects also necessitates going outside of these allocated bands.
- Most bands are shared with active services. Obvious strong signals of terrestrial origin can often be excised from collected data, but weak signals defy editing and may therefore be more pernicious, contaminating long-term wideband averages without being apparent in individual data.
- The radio astronomy bands are not adequately protected from transmissions in adjacent bands. This is particularly a problem with airborne and spaceborne transmitters, because their modulation techniques are often inefficient and terrain around observatories does not provide shielding for transmitters at high elevation.
- Some allocations apply to limited areas of the world, providing no protection at all in other areas.
- There are large intervals between some of the allocated bands. In order to determine the spectral distribution of radio source emission, bands were assigned to radio astronomy at approximately octave intervals.
Despite the above concerns, the shared use of the radio spectrum by both active services and the receive-only Radio Astronomy Service (RAS) is possible in certain circumstances, such as active use of low power or shielded transmitters. For example, the RAS allocation at 608-614 MHz (TV Channel 37) has been shared successfully with medical telemetry devices with no conflict for years. At high frequencies, similar sharing between passive and active use may be possible because of the severe attenuation of the propagating signal and to the geographic isolation of millimeter-wave radio telescopes (which are located on high, arid mountaintops to minimize atmospheric attenuation of already weak signals). However, as a practical matter, commercial applications that choose to use the opaque bands, between the atmospheric windows, will not only avoid conflict with the radio astronomy service, but also minimize conflicts between other active services. In all cases, however, reducing interference from active users of the radio spectrum will increase the efficacy of both the receive-only science applications delineated below and other users of the radio spectrum.
2.2 THE SOLAR SYSTEM AND EXTRASOLAR PLANETS
Radio observations of our solar system span the range of dynamic, but well studied, sources such as our Sun, to observations of stable, but transient, sources such as near-Earth asteroids. The discovery of planets around other stars has led to the burgeoning study of extrasolar planets (exoplanets), the evolution of planetary systems, and a renewed interest in the possibility of other forms of life in the universe.
In the solar system, radio observations of the Sun complement optical observations (see Figure 2.7). For example, observations of coronal mass ejections are of particular importance in the study of space weather. The slowly varying component of solar radio emission has been found to provide one of the best indicators of the variation of solar activity over the Sun’s 22-year cycle. In addition, the intense and rapid bursts of solar radio emission provide greater understanding of what happens on the Sun during active periods and the way the Sun influences events in Earth’s atmosphere, near-Earth space, and other portions of the solar system. Solar monitoring programs at 2.8 GHz have shown that the solar emissions at these radio wavelengths are tightly correlated with ultraviolet and x-ray emissions. In addition, as the longest running indicator of solar activity, solar monitoring at 2.8 GHz can be conducted in any weather conditions and at much less expense than space-based observations. Overall, solar monitoring
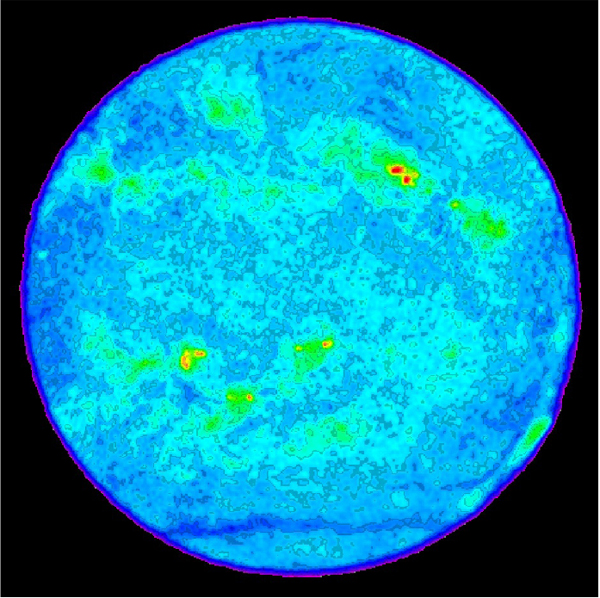
FIGURE 2.7 A 4.9 GHz image of the Sun obtained with the Very Large Array. Several active regions associated with sunspots are seen as well as a line of absorption due to an Hα filament crossing the southern part of the image. SOURCE: “The Radio Sun,” image, April 11, 1999, http://images.nrao.edu/506; courtesy of NRAO/AUI and Stephen White, University of Maryland.
programs with frequency coverage from 1 to 18 GHz provide insight into the nature and evolution of coronal magnetic fields and the temperature and density of nonthermal electrons in active regions.
Radio observations of the Sun made at frequencies below ~100 MHz provide essential data on solar bursts. Occasionally, and more frequently during sunspot maximum, dramatic radio bursts of several different characteristic types are generated in the Sun’s atmosphere. Such bursts are sometimes associ-
ated with solar flares, which are sudden, violent explosions in the Sun’s chromosphere. Radio bursts and coronal mass ejections are observed from ~20 to ~400 MHz and are more intense at the lower frequencies. The high-energy particles ejected from the Sun during these bursts may cause damage to orbiting satellites, and interact with Earth’s ionosphere and the stratosphere. Such interactions cause severe interruptions in radio communications and power systems and can also have dangerous effects on aircraft passengers on flights above 15 km. Studies of radio bursts aim to enable the prediction of failures in radio communications and the forecasting of other effects. Knowledge of the high-energy particle ejections from the Sun is essential for space exploration missions, both manned and unmanned. Continuous monitoring of the Sun’s activity will remain a high priority for the foreseeable future.
Originally developed as a radio astronomical technique for the high-resolution imaging of astronomical objects, Very Long Baseline Interferometry (VLBI) has found many applications in Earth-based science, a notable example being the sensitive monitoring of crustal motions on Earth. The positional accuracy provided by the Global Positioning System (GPS) depends on the precise knowledge of irregularities of Earth’s rotation provided by VLBI measurements of distant quasars. Using large numbers of time-difference measurements from many distant quasars observed with a global network of antennas, VLBI determines with unequaled precision the terrestrial reference frame (antenna locations on Earth), the celestial reference frame (quasar positions in the sky), and Earth’s orientation in space. These time-difference measurements are precise to a few picoseconds. This high precision is made possible by simultaneous continuum observations in several discrete channels spanning over 100 MHz around 2300 MHz and spanning 500 MHz or more around 8600 MHz. Because of the sensitive, large antennas of the NASA Deep Space Network and other deep space stations, the 2290-2300 MHz band allocated to the Space Research Service (SRS) is used for VLBI observations in radio astronomy. The 2200-2290 MHz band is widely used in conjunction with the SRS band just above it. In particular, major geodetic and astrometric programs are being carried out jointly in the 2200-2300 MHz frequency range.
Although it is not possible to make such precise measurements using only bands allocated to the passive services, use of broader bandwidths are possible because the interferometric technique provides some mitigation against radio frequency interference that is present in only one of the antennas. However, the recent activation of broadcast satellites in the 2300 MHz band is making these measurements more difficult. The broadcast satellites and other sources of interference may make it necessary to move geodetic observations to the 31 GHz band, where 500 MHz is protected for radio astronomy and other passive services.
Comets likely preserve pristine material remaining from the origin of the solar system. As comets pass near the Sun, the volatile ices in the comet are sublimated; the gas that is produced flows out from the nucleus to form the comet’s coma. “Parent” species are those directly sublimated from the nucleus, while “daughter” species are formed through photo-destruction within the coma. Many parent molecules are only detectable via radio spectroscopy, so radio observations provide the best way to measure the detailed molecular composition of the cometary ices, which then relate to the volatile composition of the protosolar cloud that formed the Sun and planets. High-resolution radio spectroscopy enables analysis of the dynamics of gas production, the excitation mechanisms affecting coma molecules, and what fraction of the nucleus is actively outgassing. In addition, quasi-thermal broadband emission from cometary
dust can be detected in the millimeter and submillimeter wavelength ranges, enabling assessment of the structure, porosity, mass, and density of dust that was aggregated from the protosolar nebula.
Asteroid thermal emission, which typically peaks in the mid-infrared bands, can still be detected at radio wavelengths for some bodies. For larger or closer objects, the Atacama Large Millimeter Array (ALMA) can provide high enough resolution to make thermal maps of asteroid surfaces at submillimeter (>300 GHz) wavelengths. Such observations place important constraints on thermal inertia, which relates to the density and porosity of the object, which is an important element in assessing impact hazards, and complements radar observations.
While radio astronomy is largely a receive-only activity, there is one exception. Operating in the Radiolocation Service bands at 2380 MHz and 8560 MHz, powerful radars at the Arecibo Observatory and the NASA Goldstone Deep Space Communications Complex, respectively, are used to study the surfaces of the Moon, Mars, Mercury, Venus, comets, asteroids, and the satellites and rings of Jupiter and Saturn. Additional transmitters at 7200 MHz are also used by other Deep Space Network antennas, as well as X-band (8560 MHz) transmitters at various private and international facilities. Though many radar signal returns are received by the transmitting station, in some cases it is advantageous to receive at a different station in bistatic mode. Bistatic observations are used when the radar target (the moon or a near-Earth object) is too close to Earth to switch transmit/receive modes in time to capture the echo. In addition, bistatic operations permit the optimal combination of transmitter resolution and receiving station sensitivity, such as transmission at Goldstone and receipt at Arecibo. Furthermore, by receiving radar echoes with an interferometer array, such as the VLA or the Very Long Baseline Array (VLBA), the technique of radar speckle tracking provides a high-resolution option for both planetary and asteroidal targets.
Observations with planetary radar systems have made unique and critical contributions to our knowledge of the Moon, terrestrial planets, satellites, asteroids, and comets. Radar astrometry can improve orbit characterization and predictions, which assist with planning and executing spacecraft rendezvous, analysis of non-gravitational effects on the orbits, testing General Relativity predictions, measuring solar oblateness, and assessing impact hazards. Radar imaging at high resolution, often rivaling that of spacecraft encounters, enables determination of object shapes, estimation of spin pole positions, discovery of satellites or contact binaries, and characterization of surface and near-surface processes and properties (see Figure 2.8). Radar characterizations of binary/multiple systems can constrain masses, densities, and material properties critical for hazard assessment. In addition, radar astrometry places strong constraints on Yarkovsky drift, which results from asymmetrical thermal emissions and can alter the orbits of small objects. Yarkovsky effects are important to the assessment of impact hazards, but also offer another means of estimating masses because the effect is proportional to object size.
Although the transmitters are very powerful, the returned signals decrease with the fourth power of the distance to the target and, therefore, are extremely weak and vulnerable to interference. In particular, the Arecibo S-band radar frequency 2380 MHz is close to powerful broadcast satellite transmissions near 2330 MHz, which is of great concern for the reliable detection of the weak return signals. Bistatic operations require coordinated protection of frequency bands at two or more stations, and often a rapid response time for scheduling and coordination when newly discovered targets are being observed.
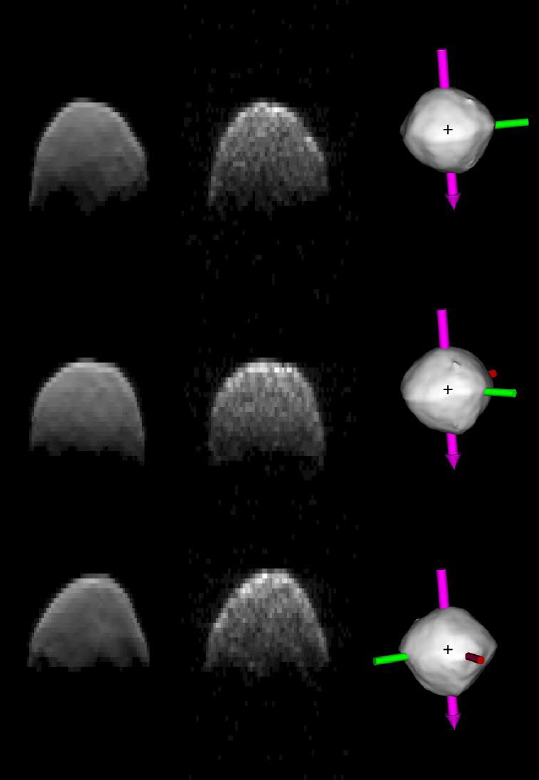
FIGURE 2.8 A radar investigation and model of asteroid 101955 Bennu, a target for the OSIRIS-REX sample-return mission. A simulation of the data based on the model is shown at the left for three different times on September 23, 1999. In the center are the delay-Doppler images from the S-band Arecibo Planetary Radar observations, where the width of the image is proportional to the asteroid’s rotation speed, and the height of the image shows the radar range, related to the object’s physical size. At right is how Bennu would appear on the sky viewed from Earth at the time the data were taken (the cross indicates the sub-radar point on the model). SOURCE: Courtesy of Michael C. Nolan, Arecibo Observatory.
Radio observations of the planets provide new information that cannot be achieved by other techniques. For example, the planet Jupiter produces frequent bursts of radio waves from ~15 to ~35 MHz; their study by radio astronomers first determined the rotation period of the planet’s core and showed the coupling between Jupiter’s magnetosphere and the satellite Io. Furthermore, these bursts are an example of a coherent emission mechanism that is not completely understood. This has been confirmed and extended by measurements in the vicinity of Jupiter from flyby and orbital spacecraft. Radio measurements of the deep atmospheres of Venus and the outer planets provide the only means to probe these regions remotely and inform models of planetary formation. Low frequency observations have also detected electric discharges in the atmospheres of Saturn, Uranus, and Neptune. Millimeter-wave spectroscopic measurements of the upper atmospheres of Venus, Mars, and Saturn’s satellite Titan provide some of the best information on the atmospheric photochemistry and circulation that is available. Ground-based radio observations complement optical observations in providing the long-term monitoring necessary to study the seasonal cycles on Titan, viewing Saturn’s rings at different geometries, and monitoring Venus radar returns for evidence of volcanic activity.
In addition, another important use of radio astronomy telescopes is for ground-based telemetry for space missions, including, for example, use of the VLBA in support of the Cassini mission during the descent of the Huygens probe at Titan, and use of the Green Bank Telescope to acquire signals from the probe during its descent to measure wind speeds on Titan. As large, sensitive receivers with large collecting areas, Green Bank and Arecibo can be used to confirm a spacecraft landing or recover homing signals from spacecraft for which anomalies have occurred. Frequencies used in these experiments are necessarily limited to those available on spacecraft transmitters, which are generally in X-band (8-12 GHz), but vary depending on the Doppler shift due to motion of the spacecraft or its target object in the solar system.
Given the dramatic strength of Jovian Bursts at low frequencies, considerable effort is currently being directed into searches for emission from extrasolar planets (exo-planets) below 80 MHz with new instruments such as the Long Wavelength Array (LWA). These observations enable a search for stellar bursts coupled with planetary orbits in these systems and provide evidence for evaporation of extrasolar planetary atmospheres. Such observations have the potential to reveal extrasolar planetary magnetic field strengths, the exoplanet’s composition, and how bursts may influence habitability for extremely small planetary orbits. In particular, magnetic fields are critical to the establishment of life as they deflect high-energy charged particles and help to confine planetary atmospheres. The presence and strength of magnetic fields also provide insight into the internal structure of planets. As extrasolar planet detections increase, new fields of research are emerging, enabled by radio astronomy, including studies of composition, atmospheres, and habitability.
Searches for protoplanetary bodies are undertaken in the infrared, submillimeter, and millimeter as dusty debris disks are thermal emitters within these wavelength regimes. One spectacular example of a protoplanetary disk imaged with the ALMA interferometer is the HL-Tau system (Figure 2.9). The multiple rings and gaps are indicative of protoplanetary bodies that have collapsed and swept their orbits clear of debris while, at the same time, they shepherd the remaining dust and gas into tighter, more confined, zones. Similar high spatial resolution imaging of other young stellar systems has the potential to provide unique insight into the formation of planets and solar systems like our own.
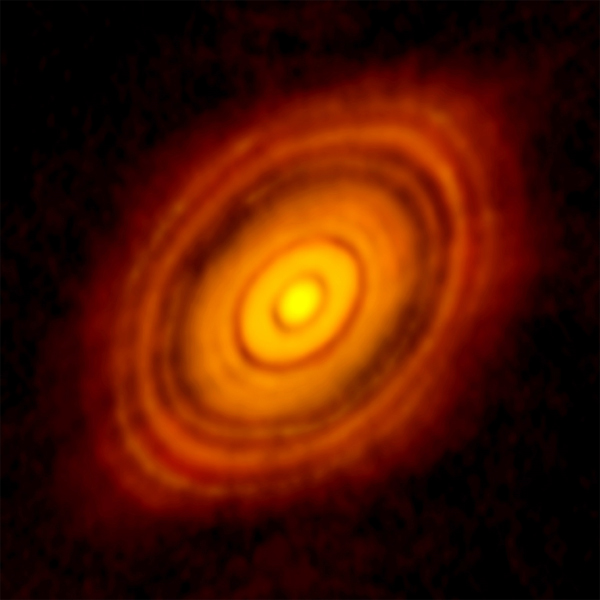
FIGURE 2.9 A 300 GHz Atacama Large Millimeter Array image of the young star HL Tau and its protoplanetary disk that shows multiple rings and gaps characteristic of emerging planets as they sweep their orbits clear of dust and gas. SOURCE: Courtesy of ALMA (NRAO/ESO/NAOJ); C. Brogan, B. Saxton (NRAO/AUI/NSF); see NRAO, “Birth of Planets Revealed in Astonishing Detail in ALMA’s ‘Best Image Ever,’” press release, November 6, 2014, https://public.nrao.edu/news/pressreleases/planet-formation-alma.
2.2.7 Prebiotic Chemical Evolution
Some theories posit that interstellar chemistry may have supplied the prebiotic compounds essential for terrestrial life. Consequently, establishing the inventory of organic molecules in interstellar gas is of interest to the study of the origin of life. Because organic molecules have many favorable transitions at millimeter wavelengths, this spectral region is crucial for the identification of such species. The 65-115 GHz (3 mm) and 125-180 GHz (2 mm) spectral regions (see Figure 2.6) have been the prime frequency regions for the detection of organic molecules. Many possible new organic compounds may be identified in interstellar gas. It is important to recognize that new frequencies are regularly becoming available for possible new molecules, enhanced by the addition of more sensitive laboratory spectroscopy in support of millimeter-wave observations with ALMA. Because temperature environments in our solar system and in extrasolar planetary systems cover a wide range, higher energy transitions at 1 mm and shorter can yield important insights into the distribution of those molecules, hence, broadband protection of millimeter-wave windows is desirable, as well as for observations above 300 GHz.
2.2.8 The Search for Extraterrestrial Intelligence
Making use of receiver instrumentation developed for radio astronomy, radio searches for extraterrestrial intelligence (SETI) are largely clustered about the frequencies of natural and molecular emission lines and within the protected radio astronomy bands. For example, in 1959, Frank Drake made the first radio search for extraterrestrial intelligence using the Howard E. Tatel Telescope of the National Radio Astronomy Observatory (NRAO) equipped with a single-channel narrowband spectrometer and a receiver tuned around 1420 MHz. In recognition of the interest of the radio science community in these passive search techniques, footnote 722 (renumbered by the World Radiocommunication Conference [WRC] of 1995 as 5.341) was added to the radio regulations during the 1979 World Administrative Radio Conference (WARC, the predecessor of the WRC). Recent improvements in receiver technology and digital signal processing equipment, intended primarily for use in radio astronomy, have enabled far more sensitive and sophisticated searches for extraterrestrial technologies to be conducted.
One can, of course, only speculate on the likelihood of civilizations with matching technology. The SETI Institute has initiated a systematic search for signals throughout the 1 to 10 GHz frequency range that represents the clearest microwave window through the terrestrial atmosphere. This search is based on state-of-the-art signal processing equipment and wideband, low-noise receivers and feeds developed specifically for the effort. Plausible arguments can also be made for searching at “magic frequencies,” but most of the microwave window has remained unexplored.
Because of the technical challenges alone, SETI is an important scientific endeavor. SETI experiments require advanced methods of signal processing as an attempt is made to recognize and interpret weak signals of unknown direction, intensity, frequency, and temporal characteristics amidst a background din of terrestrial and cosmic noise. As with more traditional astronomical studies of weak cosmic radio emission, terrestrial interference poses the greatest challenge to such searches.
2.3 THE MILKY WAY AND OTHER GALAXIES
Radio observations of our galaxy and others reveal complex structures from individual stellar systems to extensive stellar nurseries, all of which are situated within a dusty interstellar medium. Spectral line observations trace the kinematics and distribution of atomic and molecular gas in cold, warm, and hot phases of the interstellar medium. Meanwhile, continuum observations reveal dust and magnetic
fields throughout the galaxy. Observations of pulsars test theories of general relativity and also trace the distribution of ionized plasma throughout the Milky Way.
2.3.1 The Interstellar Medium: Neutral and Ionized Atomic Gas
The material between the stars in the Milky Way and other galaxies includes an inhomogeneous mix of ionized, neutral atomic, and molecular gas. Spectral lines from atomic transitions trace the diffuse component of this interstellar medium. One of the most important spectral lines at radio wavelengths is the 21 cm line (1420.406 MHz), corresponding to the F = 1 → 0 hyperfine transition of neutral atomic hydrogen (HI). Radio observations of this line have been used since its discovery in 1951 to study the structure of our galaxy and those of other galaxies. Because of Doppler shifts owing to both the distance and motion of the hydrogen clouds that emit this radiation, the frequency for observing this line emission ranges from below 1 GHz to ~1430 MHz. Within this range, the 1330-1420 MHz band is particularly important for observations of redshifted HI gas from distant external galaxies and quasars (see Box 2.2). However, studies of the evolution of the HI mass function over cosmic time will require observations at even lower frequencies; currently, surveys below 1200 MHz are being proposed for systematic study of the evolution of the atomic gas component in external galaxies. Such studies are used to investigate the state of cold interstellar matter; the dynamics, kinematics, and distribution of the gas; the rotation of our galaxy and of other galaxies; and the masses of other galaxies.
The comparable hyperfine-structure transition of atomic deuterium occurs at 327.384 MHz. The study of this line is significant for questions related to the origin of the universe and the cosmological synthesis of the elements. However, because of its low abundance, the recent detection of deuterium emission in the outer region of our galaxy required months of integration time, with careful attention to mitigation of radio frequency interference. Continuing study of the deuterium abundance in other parts of our galaxy can further refine our understanding of the early universe.
Other important atomic transitions include the atomic recombination lines that occur after an ionized atom recaptures an electron, which then cascades down through a series of energy levels, emitting narrow spectral line radiation. Such lines occur throughout the spectrum and serve as probes of the temperature and density of nebulae surrounding newly formed stars and the extended envelopes of certain late-stage stars. Radio studies have been particularly helpful for observations of these nebulae, which are partially or totally obscured at optical wavelengths by interstellar dust. The recombination lines that occur below 3 GHz arise from very high energy levels, in which the electron orbits very far from the atomic nucleus. In fact, these atoms are so large that the orbits of the outer electrons are affected by the free electrons in a measurable way, serving as a probe of the density of the ionized gas. The physics of the ionized hot gaseous clouds between the stars has been studied by observations of radio lines of excited hydrogen, helium, and carbon.
2.3.2 The Interstellar Medium: Cold Molecular Gas
Molecular transitions provide unique information regarding the physical properties of the interstellar medium, measurement of relative chemical abundances, and the identification of regions that are favorable for star formation. A listing of many of the important molecular transitions for astronomical studies is provided in Appendices C, D, and E. To provide context for the general study of the molecular components of the Milky Way and other galaxies, several of the most commonly observed molecular lines are discussed in more detail here. For example, the discovery of interstellar carbon monoxide (CO) at 115.271 GHz has been of fundamental significance for the study of star-forming gas in the Milky Way
Galaxy and in distant galaxies. This is primarily because CO is a relatively stable molecule compared with other molecules discovered in the interstellar medium, and also because CO seems to be very abundant and exists almost everywhere in the plane of our galaxy as well as in a number of other galaxies. CO studies give information about disks around forming stars and, in the future, they may tell of the conditions for planet formation. CO lines are also used to measure the mass loss rates from evolved stars. Furthermore, CO emission studies reveal the presence of bursts of star formation activity in nearby and distant galaxies. These bursts have recently been related to collisions between galaxies and possibly to the formation of massive black holes and quasars. Allowance for Doppler shifts characteristic of nearby and distant galaxies is essential for adequate protection of radio spectral lines for scientific research. For example, the 100-116 GHz band is used for radio astronomy observations of redshifted CO in distant galaxies and for isotopic transitions of 12CO, 13CO, and C18O in the Milky Way and nearby galaxies.
A wide range of interstellar molecules can be observed through the atmospheric windows (see Figure 2.6) at 3 mm (65-115 GHz), 2 mm (125-180 GHz), 1.2 mm (200-300 GHz), 0.9 mm (325-375 GHz), 0.7 mm (375-500 GHz), 0.45 mm (600-720 GHz), and 0.35 mm (780-950 GHz). The CO molecule is important because this is a good tracer of the abundance of molecular hydrogen in the interstellar medium. Rotational lines of CO have been detected to redshifts of more than 5 (see Figure 2.5 for a schematic of the visibility of various CO transitions in the atmospheric windows as a result of the Doppler shift due to the expansion of the universe). The 3 mm window contains the fundamental (J = 1 → 0), or lowest-energy, transition of most common interstellar molecules, including CO, HCO+, HCN, CCH, CN, HNC, HCO, HNO, H2CO, and N2H+. More than 100 molecules have been detected in this frequency range, as have 25 different isotopic species. These also include favorable transitions of such simple molecules as SO, SO2, SiO, SiS, and MgNC and such complex molecules as CH3CH2OH, CH3CH2CN, and CH3OCH3. In addition, N2H+, HCS+, HCNH+, and HCO+ are vitally necessary participants in the ion-molecule reactions believed to be key in the formation of many other molecules in the interstellar gas. The 1.2 mm and 0.9 mm bands include the J = 2 → 1 and J = 3 → 2 lines of CO, as well as its isotopic variants; the 0.7 mm band contains the J = 4 → 3 line of CO, and the 3P1-3P0 fine structure line of neutral carbon, while the 0.35 mm band contains the J = 7 → 6 line of CO and the 3P2-3P1 fine structure line of neutral carbon. Multiple transition studies of CO enable the density and temperature profiles of molecular clouds to be determined and are used as tracers of the total amount of molecular gas. The rotational transitions of such species as HCO+ and HCN lie in these bands as well and are important tracers of high-density gas in molecular clouds. Also in these wavelength regions, diatomic hydride and polyatomic hydride species have some of their lowest-energy rotational transitions, such as MgH, KH, H2O, and H3O+. Only at frequencies above 200 GHz can these hydride molecules be studied in the interstellar medium. Investigating simple hydride species is crucial for interstellar chemistry. Because of the high abundance of hydrogen, such species are prevalent in molecular clouds and are the initial species produced by interstellar chemistry.
Isotope ratios, particularly the 12C/13C, 16O/18O, and 32S/34S ratios, give important insight into theories of nucleosynthesis in stars and models of star-formation rates and the relative masses involved. As an example, the basic molecule HCN has the isotopic species H12C14N, H13C14N, and H12C15N in the 86-92 GHz range, and all have been observed in interstellar gas. Similarly, the 48.94-49.04 GHz band contains the lowest rotational transitions of CS and its isotopes such as C33S and C34S. Molecules can also be used to investigate deuterium/hydrogen ratios. Because of chemical fractionation, very high deuterium/hydrogen ratios are found in certain interstellar molecules as a result of ion-molecule chemistry. DCN and DCO+ are important tracers in this context. Their lowest-energy spectral transitions lie near 72 GHz.
The discovery of ammonia (NH3) in interstellar space presented an example of a molecule radiating thermally. The distribution of NH3 clouds in our galaxy and their relation to the other molecules that have been discovered are of great interest. Radio lines of ammonia at 23 GHz arise from the inversion of
nitrogen through the plane of the hydrogen atoms. The molecule inverts in many of its rotational levels. Hence, there are numerous inversion lines of ammonia that can be studied, which makes this molecule an excellent indicator of gas temperature.
At lower frequencies, formaldehyde (H2CO) is detected in interstellar clouds via its K-doubling transition (JK-1,K+1 = 110-111) at 4829.66 MHz. This line is a useful tracer of the more diffuse interstellar medium because it can be detected in absorption against strong background radio sources. The distribution of H2CO clouds can give independent evidence of the distribution of the interstellar material and can help in understanding the structure of our galaxy. H2CO lines from the carbon-13 isotope and oxygen-18 isotope have been detected, and studies of the isotopic abundances of these elements are being carried out. The combination of the 4830 MHz and 14.5 GHz formaldehyde lines is a sensitive and useful diagnostic of the density in the emitting gas.
OH has been detected in thermal emission and absorption in several hundred different molecular complexes in our galaxy. Thermal OH emission, which predominates in the low-density envelopes of molecular clouds, is the principal means for studying these envelopes. Emission lines from 18OH and 17OH have been detected in some molecular regions of our galaxy and other galaxies. The data from these lines allow the study of the abundances of the oxygen isotopes involved. Such studies are a crucial part of understanding the network of chemical reactions involved in the formation of atoms and molecules. The data can help astronomers to understand the physics of stellar interiors, the chemistry of the interstellar medium, and the physics of the early universe. OH lines also appear as masers in both our galaxy and in extragalactic sources (see Section 2.3.4).
Finally, the spectral region from 30 to 50 GHz contains the strongest lines of HC3N, a molecule that is a signpost of pre-protostellar conditions and a good temperature probe for extremely cold gas. It represents the shortest of a series of long-chain molecules of the form HCxN (x = 1, 3, 5, 7, 9, 11, . . .).
2.3.3 The Interstellar Medium: Dust
Cold dust, with grain temperatures of 10 K to 30 K, makes up much of the total mass of dust in our galaxy and in other galaxies. In fact, aside from planets, dust emission provides the most prominent source of broadband radiation at millimeter/submillimeter wavelengths. Observations indicate that the spectral energy distribution of dust emission is quasi-thermal. Specifically, in the millimeter/submillimeter wavelength range, the emission follows the modified Rayleigh-Jeans relation with intensity increasing proportional to frequency to the second power. However, at higher frequencies, the intensity is directly proportional to dust temperature and optical depth. The intensity is measured to vary as I (n) ∝ nb+2 power, where the value of+2 arises from the Rayleigh-Jeans factor and β has a value of 1 to 2, depending on the composition of the dust. Measurement of the quasi-thermal emission from dust grains is an important component in the determination of source mass and estimation of energy balance in the interstellar medium. For example, it is possible to estimate the column density of hydrogen in all forms (atomic, molecular, and ionized) from the dust emission by measuring the spectral energy distribution (SED) on both sides of the peak to derive a dust temperature and to infer properties of the dust grains.
Dust grains come in a wide range of sizes, with a typical size of 0.1 microns, and are mainly silicates or graphites with an icy surface. However, it is likely that the structure of dust grains is not spherical. Measurements of absorption (in the optical and near-infrared) and emission (in the millimeter/submillimeter) from dust grains show linear polarization, so grains are elongated and can be aligned by magnetic fields. Dust grains are important catalysts for complex astrochemistry reactions, as they provide surfaces on which molecules may form and then later be ejected into the interstellar medium.
Small grains are thought to be particularly important for astrochemistry, because they have a large surface area to volume ratio.
Extremely narrow and intense emission lines can arise if the physical conditions and geometric alignment are optimal for microwave amplification by stimulated emission of radiation (masers). Masers can be associated with star-forming regions and with more-evolved stars. Within the Milky Way, OH maser sources have apparent angular sizes on the order of 0.01 arcsecond or less. Such apparent sizes translate to linear sizes on the order of a few times the mean distance between Earth and the Sun (150 million km) and occur at the heart of regions with active star formation. The 1612 MHz transition is an extremely important hyperfine line of OH. This line emission occurs in many types of objects in our galaxy, and high-angular-resolution observations of these objects in this line measure their distances and can be used collectively to measure the distance to the center of our galaxy. OH masers in other galaxies can be more than a million times as luminous as galactic masers. These so-called megamasers arise within the cores of galaxies; this action results in amplification (rather than absorption) of the nuclear radio continuum. Because they are so bright, these powerful OH megamasers can be seen to great distances, currently up to 80,000 km/s (z = 0.27). Use of the OH 1667 MHz line to study these very peculiar and active galaxies allows radio astronomers to diagnose the temperature and density of the molecular gas in the centers of these galaxies. Similarly, extragalactic formaldehyde megamaser emission and absorption are found in a growing number of galaxies. Because formaldehyde is a good tracer of intermediate- to high-density gas, this line is very important for the study of the molecular structure of other galaxies.
The discovery in 1968 of extremely intense lines at 22.2 GHz from the H2O molecule in interstellar space has also resulted in many new and interesting puzzles. It was soon discovered that the intensities of these lines are highly variable, that the sizes of the H2O sources are extremely small (a few astronomical units), and that the lines are highly polarized. Additionally, H2O masers often show multiple components, each one with a slightly different velocity in the line of sight. Tracing the kinematic motions of H2O masers in external galaxies has led to the first geometric distance measurements in extragalactic sources (see Section 2.3.9).
The 42.5-43.5 GHz band contains the lowest rotational transitions (J = 1 → 0) of vibrational states of SiO. These transitions have been detected as strong maser emission from the envelopes of evolved stars and in young star-forming regions. In addition, two vibrational states of the transitions of SiO fall in the 3 mm spectral window. SiO is the only molecule that shows strong maser emission in an excited vibrational state.
Magnetic fields may play a major role in the dynamics of the interstellar gas in galaxies. The strength of the magnetic field along a line of sight can be inferred from its effects on the propagation of radio waves. For example, the OH molecule has four hyperfine components of the ground state lambda-doubling transitions at 1665, 1667, 1612, and 1720 MHz. The two oppositely circularly polarized components become slightly separated in frequency in the presence of a magnetic field. This so-called Zeeman effect is an effective method to measure the strength of the magnetic field in our galaxy and in other galaxies with OH megamaser emission.
Alternative techniques to measure the magnetic field strength along the line of sight include observations of continuum emission from pulsars (Section 2.3.7). The frequency dependence of pulse arrival times is proportional to the electron density along the line of sight. At the same time, the observed
Faraday rotation is proportional to the magnetic field strength and the electron density. Thus, ratios of the rotation measure to the dispersion measure for pulsars located throughout our galaxy trace the strength of the galactic magnetic field along many lines of sight. Continuum bands, particularly those at frequencies below 3 GHz, are most valuable for these studies.
2.3.6 Stars and Stellar Processes
While stars range widely in mass, the most common types are at the lowest masses: M, L, and T dwarfs. These stars have extremely long formation times and lifetimes. Radio observations of these stars can detect stellar flares, star-spots or other magnetic activity. Flares can be synchronized with the orbit of a close-orbiting planet, making radio pulse timing another good option for detecting extrasolar planets (comparable to the investigation of pulsars, Section 2.3.7), constraining orbital timescales, and assessing habitability. Stellar flares are of particular interest because of their potential influence on planetary habitability. Because of their abundance in our galaxy, coupled with their strong magnetic fields and associated activity, low-mass stars are ideal for radio observations and inform the study of all types of stars and planetary systems.
Brown dwarfs, sub-stellar objects that are not massive enough to sustain core hydrogen fusion, are also interesting objects for radio astronomy observations. In particular, as star-planet transition objects, they offer us insight into both stars and planets. Brown dwarfs alone are brighter and easier to detect than planets, and brown dwarfs with extrasolar planets provide an interesting contrast to planetary systems with more massive host stars.
At the end-stages of their stellar life cycle, stars shed material into the interstellar medium. The physical conditions of circumstellar envelopes of late-stage stars are favorable for the formation of complex long-chain carbon species such as C3H, C3N, C4H, C7H, C8H, as well as those of silicon-, magnesium-, and aluminum-bearing molecules (SiS, SiC2, SiC3, MgCN, AlCl, AlNC). Observations of these spectral lines in the 3 mm and 2 mm windows (see Figure 2.6) provide insight into the chemistry of circumstellar envelopes of late-stage stars. In addition, observations of SiO maser transitions at 42.5-43.5 GHz provide probes of the stellar envelopes, yielding information on temperature, density, stellar wind velocities, and envelope geometry.
The highest mass stars will eject their outer envelopes into the interstellar medium via supernova explosions at the end of their life. While the supernova explosion itself occurs on short timescales, the resulting supernova remnants are relatively long lived and have characteristic non-thermal spectra produced by synchrotron emission from relativistic cosmic ray electrons moving in galactic-scale magnetic fields. Radio continuum observations at, for example, 5 GHz reveal the extent and detailed morphology of galactic supernova remnants and allow measurement of their structures and dynamics as well as the derivation of their physical parameters, such as their total mass.
2.3.7 Pulsars and Gravitational Waves
One of the most interesting and important discoveries in radio astronomy has been the detection of pulsars. Pulsars are understood to be highly condensed neutron stars that rotate with a period as short as a millisecond. Such objects are produced by the collapse of the cores of massive stars during the catastrophic explosion of a supernova. The radio spectra of pulsars indicate a non-thermal mechanism. Pulsars emit strongest at frequencies in the range from ~50 MHz to 2 GHz. Hence, many observations are being performed at such frequencies. However, important observations and surveys for pulsars are being conducted at frequencies up to 10 GHz.
The discovery and the study of pulsars during the past five decades have opened up a major new chapter in the physics of highly condensed matter. The study of neutron stars with densities on the order of 1014 g/cm3 and with magnetic-field strengths of 1012 gauss has already contributed immensely to our understanding of the final stages of stellar evolution and has brought us closer to understanding black holes, which are thought to be the most highly condensed objects in the universe.
The discovery of millisecond binary pulsars has enabled the best experimental tests of general relativity and provided strong evidence for the existence of gravitational radiation. In addition, careful analysis of pulse timing residuals led to the startling discovery of planet-sized bodies in orbit around pulsars—the first detection of extrasolar planets (see also Section 2.2.6). Pulsars also now provide the most accurate timekeeping, surpassing the world’s ensemble of atomic clocks for long-term time stability.
Coordinated observations of pulsars at a number of radio observatories, such as those by the NANOGrav project, provide a method to search for Gravitational Wave Radiation (GWR). Specifically, because millisecond pulsars are very stable clocks, coordinated observations of millisecond pulsars provide precise time-of-arrival measurements at each observatory. Fluctuations of time-of-arrival can then be used to detect GWR from the correlation of measured residuals.
2.3.8 Galactic Structure and Dark Matter
Observations of the structure of our own Milky Way are difficult to obtain at optical wavelengths, because these wavelengths of light are blocked by clouds of interstellar dust. Radio waves, however, can penetrate these clouds and allow astronomers to obtain a view of the entire Milky Way galaxy, including the galactic center (see Figure 2.10). Studies of the location and composition of interstellar clouds using radio observations provide fundamental information about the structure and evolution of the galaxy that cannot be obtained by other means. The frequency bands in the 1 to 3 GHz range are important for galactic studies of ionized hydrogen clouds and the general diffuse radiation of the Milky Way. Furthermore, maps
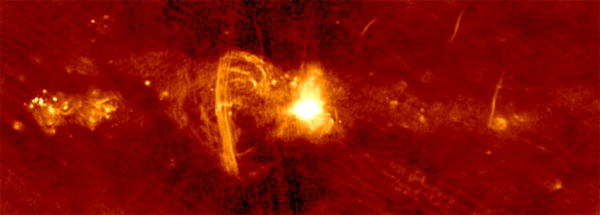
FIGURE 2.10 Radio image of the center of our galaxy at 1.4 GHz from the Very Large Array. The bright core in the center of the image (known as Sgr A) is the area surrounding the Milky Way’s supermassive black hole. Other structures in this image include supernova remnants (SNRs) and filamentary arcs tracing magnetic field lines. SOURCE: Courtesy of Elisabeth Mills, NRAO, and Cornelia Lang, University of Iowa; see C.C. Lang, W.M. Goss, C. Cyganowski, and K.I. Clubb, A high-resolution survey of H I absorption toward the central 200 pc of the galactic center, Astrophysical Journal Supplement Series 191:275, 2010.
of galactic continuum emission are not only important for the fundamental science associated with studies of structure in our own Milky Way, but also critical to the interpretation of observations of the cosmic microwave background (see Section 2.4.1). Indeed, the most serious hindrance to the full exploitation of existing and future cosmic microwave background data sets is the understanding of the galactic foreground (see Figure 2.1), especially at the frequencies used for these experiments (20-200 GHz).
Observations below 1 GHz are also of great importance in the study of both the thermal and non-thermal diffuse radiation in our own Milky Way Galaxy. Such galactic observations give information about the high-energy cosmic ray particles in our galaxy and about their distribution, and also about the hot ionized plasma and star birth in the disk of our spiral galaxy. In particular, the ionized interstellar clouds can be studied at low frequencies where the sources are opaque and their spectra approximate the Planck thermal radiation (blackbody) law. Such spectral observations can be used directly to measure the physical parameters of the radiating clouds, particularly their temperatures. Several hundred such galactic clouds appear approximately as blackbodies at frequencies below ~100 MHz.
The structure of our galaxy can also be inferred from the dispersive properties of the diffuse interstellar plasma on the radiation emitted from pulsars. Specifically, because each pulse provides a unique time stamp, it is possible to measure the arrival time of the pulse as a function of frequency and thereby derive the column density of electrons along the path (see Figure 2.11). In addition, the Faraday rotation angle provides a measure of the strength and orientation of the local galactic magnetic field along these same paths. Thus, using pulsars located throughout the galactic disk, pulsar timing experiments have provided some of the best maps of the interstellar medium of the Milky Way to date.
Precision astrometric measurements from interferometric observations of galactic sources also provide the opportunity to trace galactic structure. For example, the distance to the Pleiades star cluster was recently revised based on stellar parallax measurements, with sub-milliarcsecond positional precision, derived from VLBI observations at 8.4 GHz. Similarly, high spatial resolution monitoring observations of sources near the center of our galaxy are used to trace their orbital motions and thereby provide a kinematic estimate of the mass of the central black hole. Furthermore, high spatial resolution observations of atomic and molecular gas trace the circumnuclear accretion disk and provide insight into the feeding and feedback of the supermassive black hole at the center of our galaxy.
As mentioned in Section 2.3.1, the 21 cm HI line has been used extensively to trace the atomic gas component of the Milky Way and other galaxies (e.g., see Figure 2.12). Using the Doppler shift to trace the kinematics of the gas, observations of atomic and molecular transitions are also used to learn about the gravitational potential of galaxies. Results from this work led to the realization that a substantial fraction of the mass of every galaxy is composed of material that is not visible. The “dark matter” that is implied by these observations and confirmed through other observational tests, such as the study of the cosmic microwave background, is one of the most important areas of research in modern astrophysics. In addition, for galaxies that are gas-rich and optically faint (or even optically “dark,” i.e., containing too few stars to be seen), the measurement of the 21 cm HI line gives an accurate measure of the distance, thereby allowing a unique but important view of local large-scale structure. HI also traces the debris remnants of tidal encounters among galaxies. Ongoing and future experiments will conduct these observations at lower frequencies and thus higher redshifts, allowing us to explore how the gas content of galaxies varies not only across space but also over cosmic time.
2.3.9 Extragalactic Distance Estimates
One of the critical parameters in astronomical studies is the distance to astronomical objects. Geometric methods provide the most accurate distance estimates, but are typically only feasible for the near-
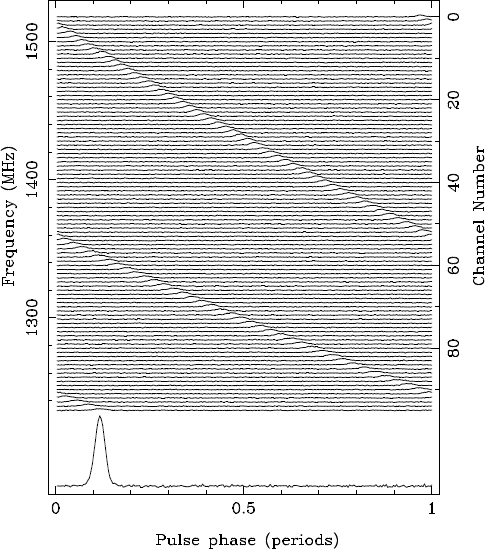
FIGURE 2.11 Pulse dispersion shown in observations of the 128 ms pulsar B1356-61 with the Parkes Radio Telescope. The pulse arrives first at higher frequencies because of the dispersive nature of the plasma in the interstellar medium. The delay is proportional to the inverse square of the frequency. Broad bandwidths allow the detection of multiple pulses simultaneously, increasing the signal-to-noise ratio and permitting analysis of the pulse shape. This observation is centered at 1380 MHz with a bandwidth of 288 MHz. SOURCE: Courtesy of Andrew Lyne, University of Manchester.
est objects (i.e., within the Milky Way) because the angular resolution required is inversely proportional to the distance of the source. However, recent advances in precision astrometry of H2O masers in nearby galaxies has opened a new window on extragalactic distance measurements. From parallax measurements of the galaxies in the Local Group, to measurements of the orbital motions of masers around the centers of nearby galaxies, these high spatial resolution observations provide accurate distance estimates that form a robust basis for the extragalactic distance ladder.
More traditional extragalactic distance measurements come from galaxy scaling relations, such as the Tully-Fisher relation. The Tully-Fisher relation correlates a galaxy’s intrinsic luminosity with its rotation velocity. Because the observed rotation velocity is distance independent, a distance can be
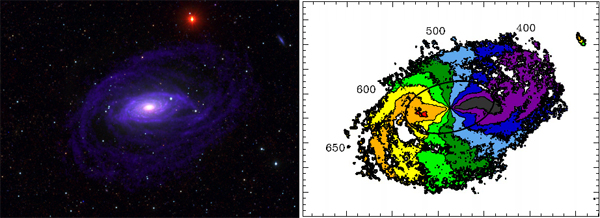
FIGURE 2.12 Combined ultraviolet, optical, infrared, and radio images of M63 (Sunflower Galaxy) and the corresponding neutral hydrogen velocity field. Left: The false-color image is a combination of data obtained with GALEX, the WIYN 0.9 m telescope, the Spitzer Space Telescope, and the Very Large Array. The spiral arms are well defined by both the stellar and gaseous components. Right: The Doppler shifted neutral hydrogen line traces the galaxy kinematics and is used to derive the rotation speed as a function of radius. Discrepancies between the observed rotation speed of galaxies and that predicted based on observed stellar and gaseous distributions led to the hypothesis that galaxies are embedded in extended halos of unobservable material, known as dark matter. SOURCE: Courtesy of Liese van Zee, Indiana University.
calculated based on the observed flux and the predicted intrinsic luminosity. Traditionally, the Tully-Fisher relation has relied on linewidth measurements of the neutral hydrogen line in the protected band at 21 cm. However, new applications of the Tully-Fisher relation to more distant galaxies has pushed these observations into lower frequency (non-protected) bands.
In recent years, astronomers have discovered a surprising level of activity due to the rapid formation of new stars, violent supernovae, and the presence of a supermassive black hole (SMBH) in the center of almost all galaxies. These SMBHs have masses in the range of 106 to 1010 times the mass of the Sun, which can lead to extraordinary levels of radio luminosity. The levels of radio emission from SMBHs as well as from star formation appears to increase rapidly with distance, suggesting that SMBH activity and star formation were more prominent in the early universe.
2.4.1 Radio Galaxies, Quasars, and Active Galactic Nuclei
About 10 percent of quasars and galaxies with active galactic nuclei (AGN) are very strong radio sources with luminosities ranging up to 1027 W/Hz. Other galaxies, quasars, and AGN are much weaker radio sources with luminosities as faint as 1019 W/Hz. The radio emission is due to synchrotron radiation from relativistic electrons with energies of the order of 10 GeV moving in magnetic fields of about 10−5 Gauss. The total energy contained in particles and magnetic fields is huge and can be as much as 1061 ergs. Most radio sources (such as radio galaxies, quasars, and supernova remnants) have non-thermal radio spectra characteristic of a power law electron energy distribution of the form N(E) ∝ E–g with γ ~ 2.5. As shown in Figure 2.3 the corresponding radio flux density spectra are also closely described by power law of the form S(n) ∝ na with α ~ −0.8. Because of electron energy radiation losses, which are proportional to the square of the electron energy, the radio spectrum often steepens toward high frequencies.
The powerful radio emission from quasars and radio galaxies is driven by a “central engine,” thought to be the SMBH located at the galactic nucleus, which accretes matter from the dense interstellar medium surrounding the galactic nucleus. Highly relativistic plasma is then ejected in narrow beams, which transport their energy to the giant radio lobes often associated with radio galaxies. However, the manner by which the relativistic plasma is formed, collimated, and accelerated to form radio jets is not well understood. Figure 2.13 shows a high spatial resolution radio image of the powerful radio galaxy known as Hercules A, obtained with the VLA. The image was made by observing in the full frequency range from 1 to 9 GHz and shows the optically invisible highly collimated relativistic jets, which extend more than 1 million light-years from the visible galaxy from which they emerge. The jets are composed of plasma beams that are ejected at nearly the speed of light from the vicinity of a supermassive black hole located at the center of the galaxy. The outer portions of both jets show ring-like structures, suggesting a history of multiple outbursts from the supermassive black hole.
The study of the continuum emission of radio sources requires observations throughout a very wide frequency range, including the Very high frequency (VHF), Ultra high frequency (UHF), microwave, and millimeter bands, to determine the physical parameters. Many extragalactic radio sources show a “break” or peak in their non-thermal spectrum in their radio emission because of electron energy losses at high frequencies or to self absorption at low frequencies. Continuum measurements throughout this range are essential to define accurately such spectral characteristics.
The radio emission from most quasars and active galactic nuclei come from such small regions that the synchrotron radiation becomes synchrotron self-absorbed from relativistic electrons within

FIGURE 2.13 The Very Large Array (VLA) radio image (pink) superimposed on a Hubble Space Telescope optical image of the powerful radio galaxy known as Hercules A. This image was made using the frequency band from 1 to 9 GHz and interferometer spacings from 36 meters to 36 km to produce this extraordinarily detailed picture with a resolution of only 0.3 arcseconds. Narrow band and short duration pulsating interference signals within the VLA passbands were rejected during data processing. This image illustrates the additional information gained by observing astronomical sources at different wavelengths. Note the sharp contrast between the light emitted at optical wavelengths (Hercules A is the diffuse fuzzy galaxy at the center of the image) and radio wavelengths (the two powerful radio jets are 1.5 million light-years long and extend well beyond the optical galaxy). The optical image is dominated by the thermal emission from starlight, whereas the radio image is dominated by emission from high-energy plasma beams ejected at close to the speed-of-light in the vicinity of the central black hole. SOURCE: Courtesy of NASA, ESA, S. Baum and C. O’Dea (RIT), R. Perley and W. Cotton (NRAO/AUI/NSF), and the Hubble Heritage Team (STScI/AURA); see NRAO, “Image Release: A Radio-Optical View of the Galaxy Hercules A,” November 29, 2012, http://www.nrao.edu/pr/2012/herca.
the source. This causes the emerging radiation to be “cut-off” at frequencies below what is called the synchrotron self-absorption cutoff frequency, which depends on the magnetic field strength, source size, and flux density. These peaks may be found between 100 MHz and 100 GHz depending on the electron energy population and the magnetic field strength, so measurements of the spectrum surrounding the cutoff frequency as well as at frequencies well above and well below the cutoff frequency provide a powerful technique to study the physics of these small, yet remarkably powerful, relativistic plasmas.
Many compact radio sources, particularly those associated with quasars and active galactic nuclei are variable, typically showing outbursts on timescales of a few weeks to a few years. Repeated observations at multiple wavelengths sampled with appropriate cadence give further insight to the nature of these sources, and specifically on the way that relativistic electrons are accelerated. Some sources are so small that they “scintillate” in a manner analogous to the optical twinkling of stars, but the scintillations typically occur on timescales of hours requiring frequent time sampling to define the variability. Unlike optical twinkling which occurs in the Earth’s atmosphere, the intra-day radio variability is due to scattering in the ionized gas in interstellar space, so the observations of how the flux density changes with frequency and time also gives information on the nature of the ionized interstellar medium.
Many of the non-thermal synchrotron sources are only detectable at higher frequencies. The frequency range of 10-100 GHz is important for monitoring the variability of the radio emission from quasars. At this frequency range, it is also possible to observe emission from dust in extremely dense cores, which are opaque at higher frequencies.
Other galaxies with radio emission, particularly the less luminous sources, are found to be spiral galaxies where stars are still being formed. Certain young stars may undergo supernova explosions, which are exceedingly bright for a few days. The stellar explosion generates a shock wave that, as it expands, can accelerate the surrounding interstellar material to relativistic velocities, and the electron component becomes a source of synchrotron radiation. Although the relation is not well understood, there is a close connection between the radio and far infrared luminosity of these star-forming regions. However, it is only at radio wavelengths that the radiation from star forming regions is not obscured by interstellar matter, so radio observations are a uniquely powerful way of determining the rate of star formation in galaxies and how it evolves with cosmic time.
At the extreme end of star forming galaxies are the so-called submillimeter galaxies, which are thought to represent galaxies in the earliest stages of evolution. The discovery of these objects has been one of the key developments of recent years. The emission from submillimeter galaxies arises from dense gas and dust heated by a burst of newly formed stars in the system. Because this emission is intrinsically strong at infrared wavelengths and because, for objects at great distances, it is redshifted from the far-infrared into the submillimeter/millimeter band, these objects can be detected to great distances at submillimeter wavelengths (see Box 2.2). ALMA and other modern facilities are able to measure submillimeter galaxies out to very large redshifts giving further insight to the evolutionary history of the development of galaxies and the star formation that occurs within them. This includes the measurement of dust emission, CO rotational lines, and also atomic lines of ionized carbon and nitrogen.
The radio emission from active galaxies generally is highly polarized, and so can be used as probes of the gas and magnetic fields through which their radiation propagates. The magnetic fields of clusters of galaxies, individual galaxies, the interstellar medium of our own Milky Way, and even the solar corona have all been estimated from their observed Faraday rotation. The degree of polarization of radio waves is highest at higher frequencies, but the influence of the ionized interstellar medium is greatest at lower frequencies. The frequency range from 30 MHz to 10 GHz is especially important for these polarization measurements.
2.5 COSMOLOGY AND STRUCTURE OF THE UNIVERSE
Cosmology is the study of the history of the universe from its fiery beginning to the way it is today. Radio astronomy has made many critical contributions to cosmology.
2.5.1 Cosmic Microwave Background
The evolution of tiny fluctuations in the density of the universe into galaxies and clusters of galaxies is one of the most exciting research areas in modern astrophysics. The cosmic microwave background (CMB) is uniform to 1 part in 105 and fills the sky. This radiation, which is a remnant of the Big Bang, follows the Planck law at a present-day temperature of 2.73 K. It represents emission as the ionized material recombined 380,000 years after the initiation of the Big Bang. The existence of weak density fluctuations in the microwave background was revealed by NASA’s Cosmic Background Explorer (COBE) mission and imaged by NASA’s Wilkinson Microwave Anisotropy Probe (WMAP) and the European Space Agency/NASA Planck satellite (see Figure 2.14). All of these satellites operate at radio frequencies. Ground-based and balloon-borne CMB experiments also continue to play vital roles in the study of the angular distribution, spectral energy distribution, polarization, and small-scale structure of the CMB. While observations of the cosmic background from the ground are severely limited by the strongly variable intensity of atmospheric emission near the continuum peak (see Figure 2.6), observations in the 1.2 mm (200-300 GHz) window are important for such fundamental measurement as the
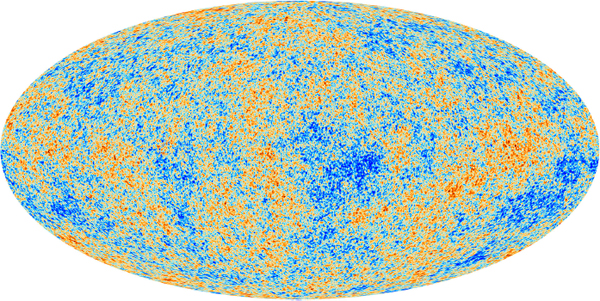
FIGURE 2.14 The anisotropies of the cosmic microwave background (CMB) as observed by the European Space Agency (ESA)/NASA Planck satellite. The foreground emission has been removed, leaving fluctuations at the level of 10-5 relative to the mean temperature of the signal. The CMB is a snapshot of the oldest light in our universe, imprinted on the sky when the universe was just 380,000 years old. It shows tiny temperature fluctuations that correspond to regions of slightly different densities, representing the seeds of all future structure: the stars and galaxies of today. SOURCE: ESA, “Plank CMB,” March 21, 2013, http://www.esa.int/spaceinimages/Images/2013/03/Planck_CMB; courtesy of ESA and the Planck Collaboration.
velocity of the galaxy with respect to the background radiation field and the rotation and symmetry of the universe.
Furthermore, while the CMB intensity fluctuations have been mapped extremely deeply by the Planck mission, there is additional information encoded in the CMB that will require additional observations. Most importantly, it is possible to infer the existence of gravitational waves from the Big Bang and probe the process of cosmic inflation through study of the polarization of the CMB. These so called B-mode signals are currently unknown in amplitude, but are expected to be another factor of 10 to 100 smaller than the intensity fluctuations mapped by WMAP and Planck. At this exquisitely small level (below 1 micro-Kelvin), foreground signals will likely dominate any background fluctuation. Thus, to create images of only the CMB, measurements at multiple frequencies spanning 40-200 GHz will be required to identify and remove foreground synchrotron emission at low frequencies and foreground dust emission at higher frequencies. Indisputably, radio observations serve as the best way to study the CMB, which has yielded a remarkable picture of the initial conditions of the universe (see Figure 2.2).
2.5.2 Dark Energy, Dark Matter, and Cosmic Evolution
The history of radio astronomy has been one of increasing sensitivity and angular resolution and now reaches sources with flux densities as faint as 10-32 W/m2/Hz (1 micro-Jansky), which can be localized in the sky to an accuracy better than a milliarcsecond. The way in which the number of radio sources is detected as a function of flux density is related to their intrinsic luminosity function, the geometry of the universe, and the evolution with cosmic time of their luminosity and space density. Indeed the first evidence for cosmic evolution came from the early number counts of radio galaxies, which was dramatically confirmed with the discovery of the CMB. Currently, with the aid of a powerful new generation of high-energy, optical, and infrared telescopes, sources detected in radio surveys are identified with a variety of galaxy and active galactic nuclei types, and their redshifts (distances) determined (see Box 2.2). In this way, astronomers are able to study the different cosmic populations, including the relation between supermassive black holes and star formation and how they evolve with cosmic time. The radio surveys used for these studies are conducted at frequencies between 1 and 10 GHz using large bandwidths in order to obtain the highest possible sensitivity.
Galaxies can also be detected in the radio by the 21 cm emission from the hyperfine transition of neutral hydrogen (see Section 2.3.1). At present, discrete galaxies can be detected only at low redshift, but several experiments are under construction or planned to detect the integrated emission from many galaxies (so-called “intensity mapping”) up to redshifts of 2.5 or more. This requires observations at as many frequencies as possible between 400 and 1400 MHz. The technique traces the distribution of hydrogen gas, and thus matter, in the universe. Imprinted in the distribution of matter is a standard ruler with which to measure the universe’s expansion history: the “baryonic acoustic oscillation” (BAO) length scale, which is related to the distance sound could travel between the Big Bang and the time when the universe changed from plasma to neutral hydrogen. The goal is to measure the apparent size of the BAO scale as a function of cosmic epoch and hence the expansion history of the universe (see Figure 2.2), which depends on the density of mass and dark energy. Other experiments are looking for neutral hydrogen at even higher redshifts at frequencies below 200 MHz. These frequencies probe the Epoch of Reionization (EoR, see Section 2.5.5), the period in the history of the universe during which the predominately neutral intergalactic medium was re-ionized by the emergence of the first luminous sources. These observations will help us understand the origin of the first stars, galaxies, and quasars. Intensity mapping of redshifted spectral lines of carbon monoxide and ionized carbon at frequencies between 15 and 200 GHz are also being planned, and will provide a complementary probe of the history of the universe.
Surveys of the radio sky also reveal examples of cosmic sources that are gravitationally lensed (see Figure 2.15). Strong gravitational lenses occur when there is sufficient mass in front of a source such that the light rays are bent to create multiple images. The lens also magnifies the background source, providing a natural method to amplify weak signals from the distant universe. The orientation and spatial separation of the multiple images are used to create a mass model for the lensing system, independent of the visible matter. Thus, gravitational lenses provide significant insight into the distribution of matter, both luminous and dark. Although gravitational lensing requires a fortuitous alignment of source and lens, both the number of and the properties of lensed systems provide a measure of cosmological parameters, including the expansion rate of the universe and the mean density. Combined with timing experiments of the variability of the background source, gravitational lenses also provide insight into the acceleration of the expansion rate of the universe (see Figure 2.2) and dark energy. Observations of gravitational lenses can be conducted at any radio frequency; large bandwidths are preferred in order to obtain the highest possible sensitivity.
The history of the clustering of galaxies in the universe can be studied by surveys/observations of the Sunyaev-Zel’dovich (SZ) effect. The ionized gas that collects in the central region of a cluster of galaxies scatters the cosmic background radiation, producing a depression in the intensity of the background radiation at the location of the cluster. The radio data can be combined with x-ray observations to yield the redshift of the cluster. Large SZ surveys will trace the history of clustering of galaxies from early epochs. These surveys are conducted at millimeter wavelengths.
Observations of galaxy clusters at centimeter wavelengths can reveal information about their magnetic field strengths either through the observations of synchrotron emission, or via studies of Faraday rotation. The origin of these cluster magnetic fields is an area of active research.
2.5.4 Galaxies in the Early Universe
To study the nature of early galaxies as well as other objects, astronomers use radio astronomy data synergistically with optical data from the Hubble Space Telescope, infrared data from the Spitzer Space Telescope, and x-ray data from the Chandra X-ray Observatory (see Figure 2.16). The class of high redshift objects known as submillimeter galaxies are detected with the use of ultra-wideband continuum detectors and bolometers, which make use of most of the available frequency space within the millimeter and submillimeter atmospheric windows (see Figure 2.6). Because the sensitivity of these measurements is greatly enhanced by the use of wide bandwidths, this places a premium on continuous, interference-free allocations for radio astronomy observations. Moreover, it is important to measure the redshift of these objects to determine their distance (see Box 2.2). These radio redshift determinations are made using molecular-line observations. The redshifts of new objects are not known a priori, and these lines may be redshifted to any lower frequency. The ability to determine a redshift is directly related to the ability to cover the widest possible bandwidth in a search; therefore, it is important to preserve large portions of the spectrum to allow this fundamental information to be measured.
Studies are just beginning of the EoR, during which radiation from the first generation of stars and galaxies (re)ionized the universe (see Figure 2.2). Observations of HI at redshifts of z = 6 to 15 (88-200
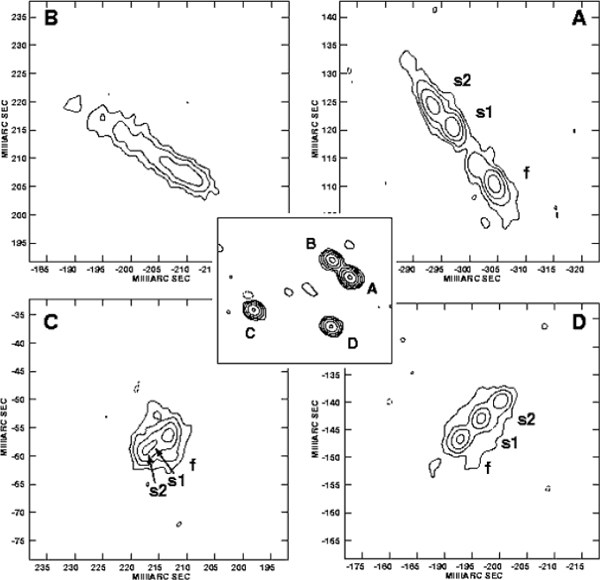
FIGURE 2.15 Very Long Baseline Array 5-GHz maps of the gravitational lens system CLASS B0128+437. This is formed by the deflection of the light from a distant (z = 3.12) quasar by an intervening galaxy (the lens), resulting in four images of the quasar being seen from Earth (MERLIN map—middle). The high resolution of the VLBA reveals that the lensed source consists of at least three sub-components. The detection of sub-structure in the lensed image enables models of the mass distribution in the lensed galaxy to be tightly constrained. SOURCE: A. Biggs, I. Browne, N. Jackson, T. York, M. Norbury, J. McKean, and P. Phillips, “The Gravitational Lens System CLASS B0128+437,” NRAO, March 2004, http://www.vlba.nrao.edu/imgmonth/CLASS_B0128_437/.
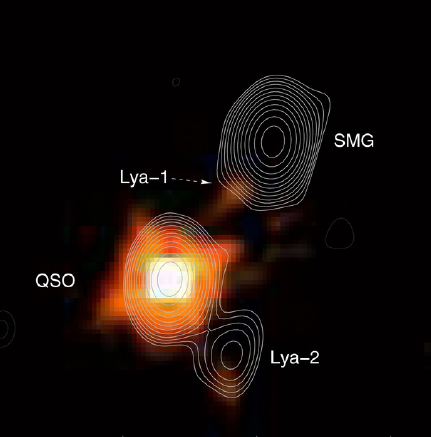
FIGURE 2.16 Radio and optical image of the 4.7 redshift quasar known as BR 1202-07 showing the galaxy at 814 nm (color) observed with the Hubble Space Telescope overlaid by 340 GHz contours observed with the Atacama Large Millimeter Array (ALMA) radio telescope. Also seen in the radio is a bright submillimeter galaxy lying to the northwest of the quasar that is obscured in the optical, and two faint Lyman-α emission regions, one of which is a strong 340 GHz radio source. SOURCE: Courtesy of NRAO/AUI; see C.L. Carilli, D. Riechers, F. Walter, R. Maiolino, J. Wagg, L. Lentati, R. McMahon, and A. Wolfe, The anatomy of an extreme starburst within 1.3 Gyr of the Big Bang revealed by ALMA, The Astrophysical Journal 763:120, 2013.
MHz) will probe the EoR. Indeed, HI may be observable in absorption against the cosmic background radiation itself at a redshift of z = 30 (45 MHz). An advantage of this approach is that the HI is optically thin, allowing the gas distribution to be measured throughout the universe. Detection and subsequent observations of redshifted hydrogen from this epoch are expected to yield valuable insights into the energetics of the early universe and the processes of initial galaxy formation. A detection of neutral hydrogen from this epoch would place strong constraints on the spin temperature of the hydrogen gas, the neutral fraction, and the timeline of the re-ionization.


