
14
Prevalence of Autism Spectrum Disorder
Autism spectrum disorder (ASD) is an important mental impairment for the Social Security Administration (SSA) as well as for stakeholders in the health care system and disability community, due in part to the considerable and continuous growth in the rates of disability attributed to ASD. From 2004 to 2013, the ASD and developmental disorders category grew more than any other mental disorder in the Supplemental Security Income (SSI) program. As reported in Chapter 3, over that decade the ASD category had the largest increase in the number of allowances per year, the largest increase in the number of determinations per year, the largest increase in the number of recipients, and the largest increase in the recipient proportion of all selected mental disorders—from 8.08 percent due to autistic disorder in 2004 to 20.53 percent in 2014. In addition, the autistic disorders category has the second highest allowance rate. These findings are of particular significance since there seems to be little or no indication of when growth in the number of children applying for and receiving SSI benefits for ASD will abate.
This chapter addresses the question of whether trends in the disability attributed to autistic disorders in the SSI program for children are consistent with trends observed in the general population of children in the United States and in the Medicaid child population.
ESTIMATES OF AUTISM PREVALENCE AND PREVALENCE TRENDS FROM THE GENERAL POPULATION
Prevalence of Autism
The first studies of the prevalence of autism, which were conducted in the 1960s and 1970s in Europe and the United States, reported prevalence estimates in the range of 2 to 4 cases per 10,000 children (Lotter, 1966; Rutter, 2005; Treffert, 1970). This led to the impression that autism was a rare childhood disorder. The earliest prevalence studies also found a consistent sex difference, with boys being three to four times more likely to have autism than girls. Following an expansion of diagnostic criteria for autism that occurred in the late 1980s and 1990s, autism prevalence studies around the world showed dramatic increases (Fombonne, 2009; Rice, 2013; Rutter, 2005). The association between rising autism prevalence estimates and changes in the criteria for diagnosing autism can be seen in Figure 14-1.
By 2002, estimates of the prevalence of autism in the United States were in the range of 6 to 7 per 1,000 children, more than a 30-fold increase from the first studies of autism prevalence (Fombonne, 2009; Lotter, 1966; Rice et al., 2007; Treffert, 1970). These studies also found the prevalence of ASD to be three to four times higher in boys than girls.
It is likely that the rise in autism prevalence during the latter decades of the 20th century, based on epidemiologic studies, can be attributed largely
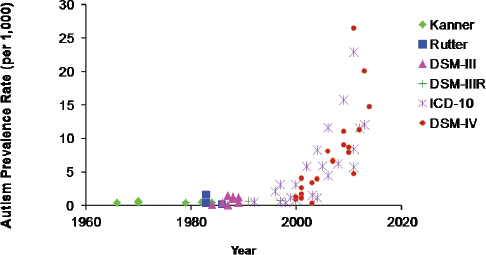
FIGURE 14-1 Evolution and expansion of diagnostic criteria for ASD.
SOURCE: Rice, 2013.
to the expansion of diagnostic criteria and the adoption of the concept of autism as a spectrum of impairments (ASD) that occurred during this period (Fombonne, 2009; King and Bearman, 2009; Rice, 2013; Wing and Potter, 2002). It is also possible that other factors, including improvements in screening and services for children with ASD and increases in specific risk factors for ASD (such as increases in the proportion of births to older parents) have also contributed to increases in the prevalence of ASD over time (Durkin et al., 2008; Grether et al., 2009; Rice, 2013; Rice et al., 2013; Schieve et al., 2011).
Prevalence Trends
We describe recent trends in the frequency of ASD in the United States based on four types of data sources: (1) epidemiologic studies, (2) special education “child counts,” (3) administrative data on developmental services from the state of California, and (4) national surveys based on parental reports. For purposes of this review of ASD prevalence among children in the United States, which focuses on the years 2000–2012, it is important to emphasize that no formal changes in diagnostic criteria were introduced or adopted between the years 2000 and 2012. Thus, changes in the prevalence of ASD during this period cannot be readily explained by the evolution of diagnostic criteria, though the gradual adoption and increasing application of diagnostic criteria introduced in the 1990s could have affected prevalence trends during the 2000–2012 period.
It is important to acknowledge that there are no perfect sources of data for evaluating trends in the prevalence of autism in the United States. An ideal source that would allow evaluation of trends over time might be generated by large-scale, nationally representative, population-based epidemiologic studies conducted periodically, and using validated and comparable methods and diagnostic criteria over time. No such data source exists. The data sources used for the purposes of this study have complementary strengths and weaknesses. For example, the epidemiologic data source described below, from the Centers for Disease Control and Prevention’s (CDC’s) Autism and Developmental Disabilities Monitoring (ADDM) Network, has the advantages of being population-based, including large and diverse populations of U.S. children, relying on validated methods for classifying cases of ASD that were comparable over a multiple-year period (2000–2010), and allowing evaluation of trends over time. The ADDM Network data are, however, not nationally representative and they rely on administrative records of developmental and/or educational assessments. In contrast, special education “child count” data have the advantages of being nationally representative and available annually, but do not necessarily rely on standard case definitions or diagnostic criteria that are comparable
over time and across states and school districts. Administrative data from the California Department of Developmental Services (CDDS) have the advantages of representing one large, U.S. state and allowing monitoring of annual trends in the number of children in the state receiving services for autism, but the disadvantage of not being nationally representative. The national survey data have the advantage of being based on national probability samples, but the disadvantages of relying on parental reports rather than diagnostic assessments and standard criteria, and of response rates less than 100 percent. Despite the limitations of each data source, taken together they provide valuable and complementary evidence for evaluating trends over time in the frequency of ASD in U.S. children.
Trends Based on Epidemiologic Studies
Since 2000, the ADDM Network of the CDC has conducted surveillance of ASD among 8-year-old children in multiple U.S. sites every 2 years using methods that have been comparable over time and that are based on the diagnostic criteria from the Diagnostic and Statistical Manual of Mental Disorders, 4th Edition (DSM-IV-TR; APA, 2013). The ADDM Network ASD prevalence estimate for the year 2000 was 6.7 per 1,000. As shown in Table 14-1, by 2010, the most recent year for which data are available, the prevalence had more than doubled, to 14.7/1,000 or 1.5 percent (95
TABLE 14-1 Prevalence of ASD in the United States, Based on ADDM Network Studies Published from 2007 to 2014 (surveillance years 2000–2010)
| Surveillance Year | Birth Year | Total Population Aged 8 Years Under Surveillance | ASD Prevalence per 1,000 (95 percent confidence interval) | Approximately 1 in x Children |
| 2000 | 1992 | 187,761 | 6.7 (6.3, 7.1) | 1 in 150 |
| 2002 | 1994 | 407,578 | 6.6 (6.4, 6.9) | 1 in 150 |
| 2004 | 1996 | 172,335 | 8.0 (7.6, 8.4) | 1 in 125 |
| 2006 | 1998 | 307,790 | 9.0 (8.6, 9.3) | 1 in 110 |
| 2008 | 2000 | 337,093 | 11.3 (11.0, 11.7) | 1 in 88 |
| 2010 | 2002 | 363,749 | 14.7 (14.3, 15.1) | 1 in 68 |
SOURCE: Adapted from http://www.cdc.gov/ncbddd/autism/data.html (accessed July 15, 2015).
percent confidence interval [CI] 1.43–1.51 percent) (Baio, 2012, 2014; Rice, 2009; Rice et al., 2007).
Although ASD can be diagnosed before age 2 years in some children and is typically a lifelong condition or disability, population-based studies have shown that the median age at which children receive a formal diagnosis or ASD classification is 5.2 to 5.7 years (Maenner et al., 2014; Shattuck et al., 2009). The ADDM Network approach to monitoring ASD prevalence assumes that most children in the United States with ASD will have received a developmental assessment or a special educational assessment providing documentation of ASD diagnostic criteria by the age of 8 years (Durkin et al., 2014). For this reason, the ADDM Network monitors the prevalence of ASD at the single year of age 8 as the most efficient way to monitor trends over time. Because children who have ASD at the age of 8 years most likely have this condition throughout childhood, the prevalence at age 8 can provide an estimate of ASD prevalence among children of all ages.
An important caveat about the ASD prevalence estimates from ADDM Network data is that the sites represented in the network are selected in a competitive process and do not provide a probability sample of U.S. children (Baio, 2014). For this reason, the resulting prevalence estimates cannot be generalized to the nation. However, the ASD prevalence estimates from the ADDM Network are population based in the sense that efforts are made at each participating site to count every 8-year-old child with ASD in the defined populations rather than just counting those who receive care through a particular health care provider or who receive special education services for autism (Baio, 2014; Durkin et al., 2014).
A consistent finding in virtually all epidemiologic studies of ASD is the excess prevalence among boys relative to girls (Fombonne, 2009). This can be seen in the trend lines from the ADDM Network prevalence findings shown in Figure 14-2, which also show that the rise in ASD prevalence from 2000 to 2010 was somewhat steeper for boys than girls, resulting in an increase in the sex ratio (boys to girls) from 3.5 in 2000 to 4.5 in 2010 (Baio, 2012, 2014; Rice, 2009; Rice et al., 2007).
Persistent racial and ethnic disparities in ASD prevalence as determined by the ADDM Network are seen for each surveillance year between 2002 and 2010, with the prevalence being highest among white non-Hispanic children and lowest among Hispanic children (see Figure 14-3). The trend of rising prevalence of ASD over time occurred for all racial and ethnic subgroups monitored (Baio, 2012, 2014; Rice, 2009; Rice et al., 2007).
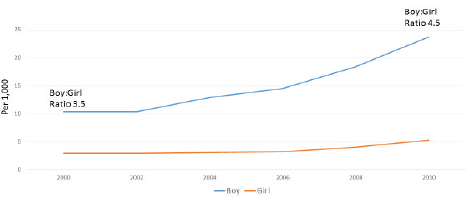
FIGURE 14-2 Prevalence of autism from 2000 to 2010 by sex.
SOURCE: ADDM Network ASD prevalence reports published in Morbidity and Mortality Reports, 2007–2014.
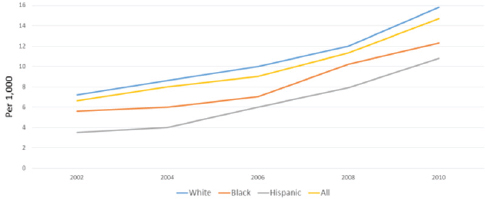
FIGURE 14-3 Trends in the prevalence (per 1,000) of ASD among 8-year-old children by race and ethnicity, U.S. ADDM Network Surveillance Sites, 2002–2010.
SOURCE: ADDM Network ASD prevalence reports published in Morbidity and Mortality Reports, 2007–2014.
Trends Based on the Number of Children Receiving Special Educational Services for ASD
In 1992, 15,556, children (ages 6 to 22 years) in the United States received special education services for ASD. By 2011 this number had increased by more than 25-fold, to 406,957. Figure 14-4 shows the increasing trend between 2001 and 2012 in the number per 1,000 of U.S. children, ages 6–17 years, who received special educational services under the ASD
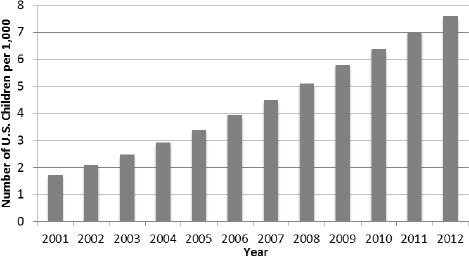
FIGURE 14-4 Trend in the number of U.S. children per 1,000 receiving special education services for autism, ages 6 to 17 years, 2001–2012.
NOTE: Denominators of child population were obtained for ages 5–17 for the years 2001–2012. Numerators were obtained from Part B child count data for autism for the 50 states, Washington, DC, and Puerto Rico, ages 6–17 for the years 2001–2011. Numerator was obtained for autism for the 50 states, Washington, DC, and Puerto Rico for ages 6–17 for year 2012.
SOURCES: U.S. Census Bureau, 2011, 2015a; U.S. Department of Education, 2013, 2014.
disability category. This number increased from 1.7 per 1,000 in 2001 to 7.6 per 1,000 in 2012.
Trends Based on the Number of Children Receiving Disability Services with an Autism Diagnosis in California
The state of California provides support and services to individuals with developmental disabilities. The determination of eligibility is administered by the CDDS. Eligibility for services from the CDDS is determined through a systematic evaluation of diagnostic elements and the functional level for the majority of children aged 3 and above. In 2007 the CDDS published data collected on the agency’s caseload due to autistic disorder from 1987 to 2007. This source of data has unique strengths. Each case is based on the application of some diagnostic and functional criteria for the determination of eligibility for state-administered supports and services. In
addition, this program reaches most individuals in the state of California, California has a large and diverse population, and the program has continuous data available over two decades. Below are two figures from the 2007 report. The first figure (see Figure 14-5) shows the approximately 12-fold increase in the number of people in California who have autism. The second figure (see Figure 14-6) shows the percent growth from year to year among the four primary diagnostic categories for eligibility in the state program. The frequency of ASD in California grew more than 1,100 percent from 1987 to 2007. ASD grew nine times more than the other diagnostic categories between 2002 and 2007 (Cavagnaro, 2007).
Trends Based on National Surveys of Parents
National Health Interview Survey In each of four national surveys conducted between 1997 and 2008, the National Health Interview Survey (NHIS) asked parents from a probability sample of noninstitutionalized U.S. children if a health professional had ever told them their child had ASD (Boyle et al., 2011). As shown in Table 14-2, the results of these surveys show a nearly fourfold increase in the estimated prevalence of autism among children ages 3–17 years, from 1.9 per 1,000 in 1997–1999 to 7.4 per 1,000 in 2006–2008.
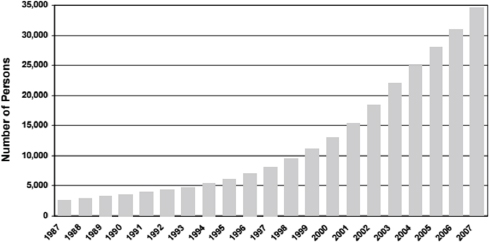
FIGURE 14-5 Annual frequencies of persons with autism from June 1987 to June 2007.
SOURCE: Cavagnaro, 2007.
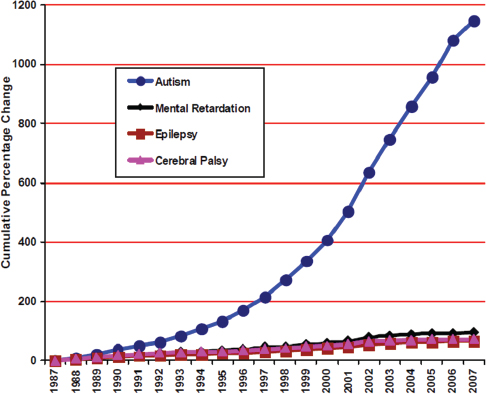
FIGURE 14-6 Cumulative percentage change of autism, cerebral palsy, epilepsy, and mental retardation over two decades.
SOURCE: Cavagnaro, 2007.
TABLE 14-2 Trends from the NHIS, Parent Report, Ever Told If Child Had Autism
| Year (Age Range) | Prevalence Estimate |
| 1997–1999 (3–17) | 1.9 per 1,000 |
| 2000–2002 (3–17) | 3.5 per 1,000 |
| 2003–2005 (3–17) | 5.9 per 1,000 |
| 2006–2008 (3–17) | 7.4 per 1,000 |
SOURCE: Boyle et al., 2011.
National Survey of Children’s Health The National Survey of Children’s Health (NSCH) has included questions about ASD in three survey years: 2003–2004, 2007, and 2011–2012 (Blumberg et al., 2013). Between 2003–2004 and 2007, the frequency with which parents reported that their child had ever been diagnosed with ASD increased from 5.5 to 11.6 per 1,000
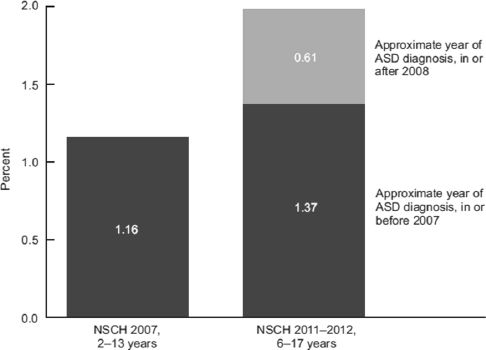
FIGURE 14-7 The frequency of autism spectrum disorder based on parent surveys: The National Survey of Children’s Health.
SOURCES: Blumberg et al., 2013; Schieve et al., 2006.
(see Figure 14-7). By 2011–2012, it had increased to 20 per 1,000 or 2 percent. Note that the age ranges for children included in these surveys differed over time. In the 2003–2004 survey it was 4–17 years, in 2007 it was 2–13 years, and in 2011–2012 it was 6–17 years (Blumberg et al., 2013).
POTENTIAL EXPLANATIONS FOR THE RISING PREVALENCE OF AUTISM
ASD was first introduced as a category for receiving special education in the United States in 1991. The gradual adoption and use of this reporting category by school districts has led to a gradual increase in the number of children identified with autism in school settings. Children with autism, who might have been served under the intellectual disability (ID) category or another disability category in the past, are increasingly being served under the autism category, a process referred to as “diagnostic substitution” (Shattuck, 2006). Evidence of diagnostic substitution of autism for ID can be seen in the special education data shown in Figure 14-8. Additional
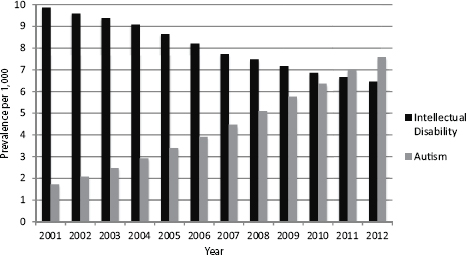
FIGURE 14-8 Evidence of diagnostic substitution. Trends in the prevalence per 1,000 of receipt of special education services for intellectual disability and autism, ages 6–17 years, United States, 2001–2012.
NOTE: Denominators of child population were obtained for ages 5–17 for the years 2001–2012. Numerators were obtained from Part B child count data for autism and intellectual for the 50 states, Washington, DC, and Puerto Rico, ages 6–17 for the years 2001–2011. Numerators were obtained for autism and intellectual disability for the 50 states, Washington, DC, and Puerto Rico for ages 6–17 for year 2012.
SOURCES: U.S. Census Bureau, 2011, 2015a; U.S. Department of Education, 2013, 2014.
evidence of this can be seen in epidemiologic data for 8-year-old children in metropolitan Atlanta, which showed a decline in ID without co-occurring ASD between 1996 and 2010 and also showed corresponding increases in ASD (with and without co-occurring ID) during the same period (Braun et al., 2015). Figure 14-9 shows this relationship.
Other factors that have likely contributed to the increasing numbers of children identified as having ASD include increased awareness of autism due to media attention and advocacy; increased training of clinicians and the increased availability of standard screening and diagnostic tools for identifying ASD; new policies for routine pediatric screening for ASD during well-child examinations; an increase in the assignment of co-occurring diagnoses among children with developmental disabilities, a process referred to as “diagnostic accrual” (King and Bearman, 2009); and the frequent requirement that a child first receive a diagnosis of ASD in order to receive needed services (Rice, 2013).
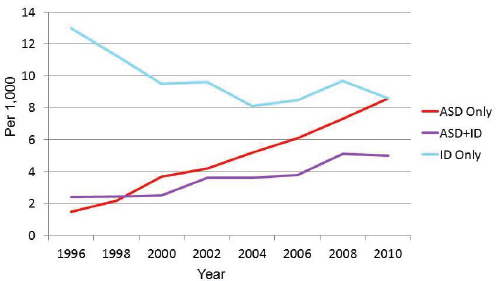
FIGURE 14-9 Contrasting trends in the prevalence of ASD and ID.
SOURCE: Braun et al., 2015.
A recent study from Sweden provides some evidence that the rise over time in autism diagnoses in that country among children born between 1993 and 2002 was steeper than the increase observed during the same period in the frequency of autism behavioral characteristics reported in telephone surveys of parents (Lundstrom et al., 2015). The authors concluded that the increase in autism diagnoses could not be fully explained by the corresponding increase in reported autism behavioral characteristics in the population.
As previously discussed, changes in the frequency of risk factors for ASD in the population, including changes in known or suspected risk factors, such as parental age, maternal obesity, and in vitro fertilization, may contribute to variations in trends, but they are unlikely to explain much of the observed increase.
Association Between Socioeconomic Status and ASD Prevalence in the United States and Potential Under-Identification of ASD Among Low-Income Children
In the United States, the prevalence of ASD as identified in both the ADDM Network surveillance system and in the National Health Interview Survey increases with increasing socioeconomic status (SES) (Boyle et al., 2011; Durkin et al., 2010). This SES gradient in ASD prevalence could be
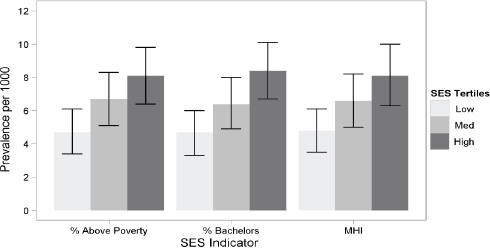
FIGURE 14-10 Prevalence per 1,000 of ASD by three SES indicators based on census block group of residence.
NOTE: Thin bars indicate 95 percent confidence intervals. MHI refers to median household income.
SOURCE: Durkin et al., 2010.
due to disparities in access to services. Figure 14-10 displays the results of an analysis of ADDM Network data showing the prevalence of ASD to be nearly twice as high in children in the highest SES tertile compared with those in the lowest SES tertile. Similarly, the NHIS data show a dose–response association between maternal education and the prevalence of reported ASD in children, which ranged from 2.5 per 1,000 among offspring of mothers with less than a high school education to 6.1 per 1,000 among offspring of mothers with a bachelor’s degree (Boyle et al., 2011). This SES gradient suggests that low-income children with ASD might be underidentified and less likely to be receiving ASD-related services than middle- and high-income children with ASD. This observation is relevant for the SSA, as applications for benefits may continue to rise for children in low-income families.
TRENDS IN THE PREVALENCE OF ASD AMONG SSI AND MEDICAID POPULATIONS
This section of the report presents data on trends in the rates of ASD in the SSI program for children from 2004 to 2013 and in Medicaid from 2001 to 2010.
SSI
Table 14-3 presents SSI administrative data on ASD in children from 2004 to 2013. Column 1 shows the number of new child allowances made each year on the basis of ASD. Column 2 shows the number of child recipients who received SSI benefits on the basis of ASD in December of each year. Note that the number of recipients includes both new allowances and existing cases. Column 3 shows the estimated number of children in households with income less than 200 percent of the federal poverty level (FPL) for each year. To control for the changes in the magnitude of child poverty, allowance and recipient rates are shown as a percentage of the number of children in households under 200 percent FPL for each year. Column 4 shows the frequency of children in households under 200 percent FPL who were allowed benefits for ASD (i.e., were found to be severely impaired with
TABLE 14-3 SSI Child Initial Allowances and Recipient Numbers for ASD
| Year | 1 | 2 | 3 | 4 | 5 |
| # of Child SSI Allowances for ASD | # of Child SSI Recipients for ASD | # of Children in Households Under 200 % FPL | Children Under 200 % FPL Allowed SSI Benefits for ASD per 1,000 | Children Under 200% FPL Who Are Recipients of SSI Benefits for ASD per 1,000 | |
| 2004 | 9,677 | 43,628 | 28,753,000 | 0.3 | 1.5 |
| 2005 | 10,626 | 50,078 | 28,539,000 | 0.4 | 1.8 |
| 2006 | 11,613 | 56,976 | 28,757,000 | 0.4 | 2.0 |
| 2007 | 12,925 | 64,883 | 28,999,000 | 0.4 | 2.2 |
| 2008 | 15,812 | 73,161 | 30,064,000 | 0.5 | 2.4 |
| 2009 | 18,231 | 83,801 | 31,505,000 | 0.6 | 2.7 |
| 2010 | 20,317 | 94,606 | 32,254,000 | 0.6 | 2.9 |
| 2011 | 22,931 | 106,910 | 32,678,000 | 0.7 | 3.3 |
| 2012 | 24,159 | 121,699 | 32,269,000 | 0.7 | 3.8 |
| 2013 | 23,398 | 134,310 | 31,364,000 | 0.7 | 4.3 |
NOTE: The Current Population Survey table creator was used to generate numbers of children below 200 percent of the federal poverty level. Parameters used to generate the numbers include get count of: persons in poverty universe (everyone except unrelated individuals under 15); years: 2004 to 2013; Census 2010 weights; row variable: age; column variable: income-to-poverty ratio; and customized formatting: income-to-poverty ratio percent cutoff of 200 percent.
SOURCES: U.S. Census Bureau, 2015b; unpublished data set provided by the SSA.
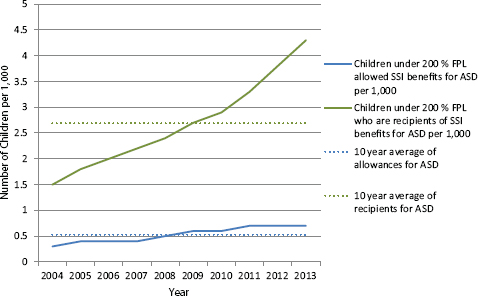
FIGURE 14-11 Numbers of SSI child initial allowances and recipients for ASD under 200 percent FPL per 1,000.
NOTE: The Current Population Survey table creator was used to generate numbers of children below 200 percent of the federal poverty level. Parameters used to generate the numbers include get count of: persons in poverty universe (everyone except unrelated individuals under 15); years: 2004 to 2013; Census 2010 weights; row variable: age; column variable: income-to-poverty ratio; and customized formatting: income-to-poverty ratio percent cutoff of 200 percent.
SOURCES: U.S. Census Bureau, 2015b; unpublished data provided by the SSA.
a primary diagnosis of ASD) in each year, per 1,000 children. The numbers in Column 4 can be interpreted as the incidence rate (per 1,000) of new allowances for ASD each year. Column 5 shows the frequency of children in households under 200 percent FPL who were recipients of SSI payments for ASD in December of each year, per 1,000 children. These numbers can be interpreted as the prevalence each year of children under 200 percent FPL receiving SSI benefits for ASD per 1,000 children. Figure 14-11 graphs the column 4 and 5 data.
Figure 14-11 plots the rate from columns 4 and 5 along with the 10-year averages of the percentages of allowances and recipients for ASD as visual reference points. Over the 10-year period from 2004 to 2013, the rates of child SSI ASD allowances and recipients both increased. During that same period, the incidence of child ASD allowances among children in households under 200 percent FPL more than doubled, from 0.3 to 0.7
TABLE 14-4 Prevalence of Child Medicaid Enrollees and SSI Medicaid Enrollees Diagnosed with ASD
| Year | 1 | 2 |
| Prevalence of All Child Medicaid Enrollees with ASD Diagnosis per 1,000 | Prevalence of Child SSI Medicaid Enrollee Subpopulation with ASD Diagnosis per 1,000 | |
| 2001 | 2 | 22 |
| 2002 | 2 | 24 |
| 2003 | 3 | 27 |
| 2004 | 3 | 30 |
| 2005 | 4 | 38 |
| 2006 | 5 | 42 |
| 2007 | 6 | 49 |
| 2008 | 6 | 57 |
| 2009 | 7 | 60 |
| 2010 | 7 | 67 |
SOURCE: MAX data.
per 1,000. The prevalence of child ASD recipients nearly tripled during the same period, from 1.5 to 4.3 per 1,000.
Medicaid
Table 14-4 shows the prevalence of children who were diagnosed with ASD per 1,000 in two different groups of Medicaid enrollees for each year from 2001 to 2010. Column 1 shows the prevalence of ASD diagnoses per 1,000 among all Medicaid enrollees1 for each year. Column 2 shows the prevalence of ASD diagnoses per 1,000 among the smaller subpopulation of Medicaid enrollees who were eligible to be enrolled in Medicaid as an SSI beneficiary.2
As shown in Figure 14-12, the rate of ASD diagnoses among all child Medicaid enrollees and among child SSI-eligible Medicaid enrollees increased more than threefold between 2001 and 2010. The frequency of ASD diagnoses among all Medicaid enrollees increased from 2 per 1,000 in 2001 to 7 per 1,000 in 2010. The frequency of ASD diagnoses among the SSI-eligible subpopulation of Medicaid enrollees increased from 22 to
_________________
1 Refer to Appendix F for Rutgers methods section.
2 Ibid.
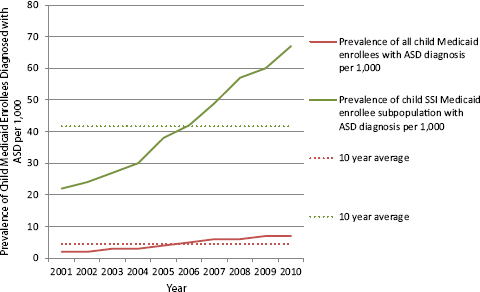
FIGURE 14-12 Prevalence of child Medicaid enrollees and SSI Medicaid enrollees diagnosed with ASD.
SOURCE: MAX data.
67 per 1,000 during the same period. The greater frequency of ASD in the SSI-eligible subpopulation is expected since having a disability is an eligibility criterion for the SSI, while the general Medicaid population includes children with and without disabilities.
For the years in which the Medicaid data and the SSI administrative data overlapped, 2004–2010, the rate of ASD diagnoses among all Medicaid-enrolled children increased by 133 percent; the rate of ASD diagnoses among the SSI-eligible Medicaid-enrolled children increased by 123 percent, and the rate of SSI recipients for ASD among children in households under 200 percent FPL increased by 93 percent. These findings confirm that recipients of SSI benefits on the basis of an ASD diagnosis have not grown faster than comparison populations.
DISCUSSION
The increasing trend in the rate of ASD observed in the SSI program for children is consistent with trends in the prevalence estimates of ASD in the general population. The data presented in this chapter uniformly indicate an increase in the frequency of ASD diagnosis or identification among children in the United States, regardless of the population studied or the
methods for identifying a case of ASD. Increases in the rates are observed in data from active surveillance efforts, from national surveys, from administrative records on service utilization for ASD, and from among children enrolled in Medicaid. Some of these categories may be more sensitive than others to variations caused by changes in diagnostic practices or standards. The consistency observed across all the data sources supports a finding that the trends observed in the SSI program are not unexpected.
A notable pattern observed in both the SSI data and the special education service utilization data is the increase in the frequency of ASD and the concurrent decrease in the frequency of ID over the time period from 2004 to 2013 (see Figure 3-5 and Figures 14-13 and 14-14). These patterns could be explained in part by diagnostic substitution (Shattuck, 2006). Special education service use data and SSI data might be particularly sensitive to diagnostic substitution because both are benefit programs that generally require a diagnosis as a prerequisite for benefit or for service eligibility. The data presented here do not provide additional evidence to support a conclusion that diagnostic substitution is, in fact, a cause of the observed trends, but the trends observed in the SSI program are consistent with the possibility that there are children with developmental/cognitive/social impairments who were previously eligible for services or benefits on the basis of a diagnosis of ID or MR but who are more recently deemed eligible on the basis of a diagnosis of ASD.
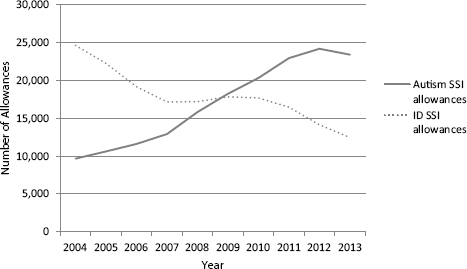
FIGURE 14-13 Autism and intellectual disability initial allowances for SSI.
SOURCE: Unpublished data set provided by the SSA.
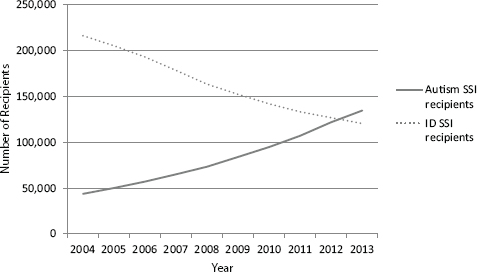
FIGURE 14-14 Autism and intellectual disability recipients for SSI.
SOURCE: Unpublished data set provided by the SSA.
Based on the National Survey of Child Health estimates for 2011–2012, the prevalence of severe or moderate ASD among U.S. children of ages 2–17 years was 0.8 percent, or 8 per 1,000 (NSCH, 2012). Severity determinations were based on parental ratings. After 2008, parents rated 41.7 percent of ASD cases as moderate or severe. The estimated number of children below 200 percent FPL in 2012 was 32,269,000. Therefore, the expected number of children with severe or moderate autism living in families below 200 percent FPL would be 258,152. By comparison, in 2012 there were 121,699 child recipients of the SSI benefits for autism, fewer than half the number expected based on the NSCH estimate. Figure 14-15 illustrates these relationships.
Based on national special education child counts, the estimated prevalence of ASD among school-aged children in the United States in 2012 was 0.76 percent, or 7.6 per 1,000. Applying this prevalence estimate to the number of children below 200 percent FPL in 2012, the expected number of children in low-income households with ASD would be 245,244, similar to the expected number based on the NSCH data and more than double the number of child recipients of SSI benefits for autism in 2012.
The ADDM estimated that the prevalence for ASD in 2010 among 8-year-old children was 1.47 percent or 14.7 per 1,000 (CDC, 2015). In 2010 the estimated number of children below 200 percent FPL was 32,254,000. Applying the ADDM prevalence estimate for 2010 to children
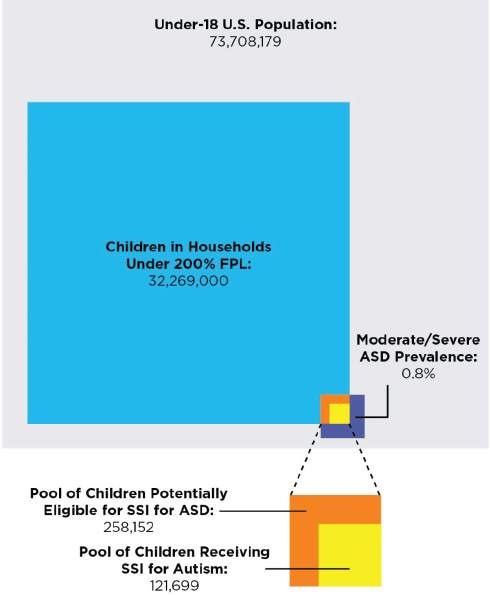
FIGURE 14-15 Children potentially eligible for SSI for ASD versus children receiving SSI for ASD in 2011–2012, according to the NSCH.
NOTE: The Current Population Survey table creator was used to generate numbers of children below 200 percent of the federal poverty level. Parameters used to generate the numbers include get count of: persons in poverty universe (everyone except unrelated individuals under 15); years: 2004 to 2013; Census 2010 weights; row variable: age; column variable: income-to-poverty ratio; and customized formatting: income-to-poverty ratio percent cutoff of 200 percent.
SOURCES: NSCH, 2012; U.S. Census Bureau, 2014, 2015b; unpublished data provided by the SSA.
below 200 percent FPL, the expected number of children in low-income households with ASD in 2010 would be 474,133. However, recognizing the much lower prevalence of diagnosed ASD in children in low-income households, compared to middle- or upper-socioeconomic-class children, this estimate of the number of children in low-income households with ASD may be a substantial overestimate. In 2010, there were 94,606 recipients of SSI benefits for ASD. It is likely that the high rate of allowances for ASD in the SSI system has considerably closed the gap between potential and actual recipients of benefits. Figure 14-16 illustrates these relationships.
Prevalence of ASD
Findings
- Recent prevalence estimates for ASD in the general under-18 population range from 1.5 to 2 percent.
- An increasing trend in the prevalence of ASD has been observed across all data sources, including national surveys, epidemiological studies, special education service use counts, and Medicaid reimbursements. The trends in the rate of the child SSI recipients for ASD among children in low-income households are consistent with trends in the rate of ASD observed in both the general population and others.
- There is evidence of diagnostic substitution between ASD and ID in both the general population data and the SSI program data. From 2004 to 2013, decreases in the rate and number of recipients of SSI for ID were similar to decreases in the rate of special education service use for ID in the general population; significant increases in the rate and number of recipients of SSI for autistic disorder are similar to increases in the rate of special education services for ASD in the general population.
- The trend in ASD diagnoses among Medicaid-enrolled children was similar to general population trends between 2001 and 2010. The yearly prevalence estimates of ASD diagnoses among children enrolled in Medicaid were similar to estimates based on special education child counts, but lower than ASD prevalence estimates from surveillance and survey data for the general population.
Conclusion
- Based on current prevalence estimates of autism and on estimates of the number of children in low-income households in this country, there is significant evidence that not all children in low-income
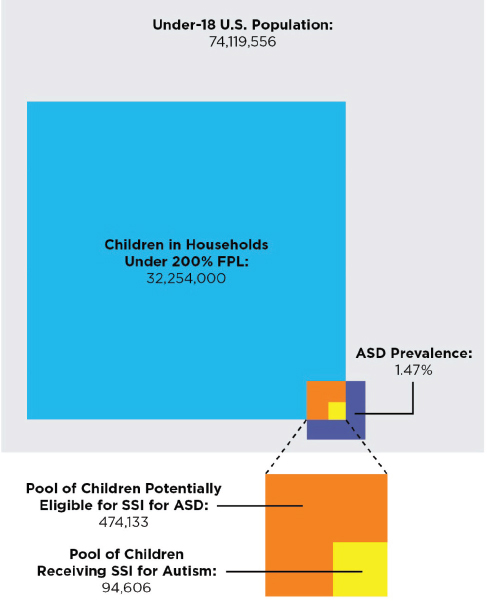
FIGURE 14-16 Children potentially eligible for SSI for ASD versus children receiving SSI for ASD in 2010.
NOTE: The Current Population Survey table creator was used to generate numbers of children below 200 percent of the federal poverty level. Parameters used to generate the numbers include get count of: persons in poverty universe (everyone except unrelated individuals under 15); years: 2004 to 2013; Census 2010 weights; row variable: age; column variable: income-to-poverty ratio; and customized formatting: income-to-poverty ratio percent cutoff of 200 percent.
SOURCES: CDC, 2015; U.S. Census Bureau, 2014, 2015b; unpublished data provided by the SSA.
- households who would be eligible for SSI benefits due to ASD are currently recipients of these benefits. Depending on the prevalence estimate, only 20 to 50 percent of potentially eligible children received SSI benefits. However, unlike the case with other mental disorders, the evidence shows higher rates of ASD identification in middle- and high-income children, and lower rates of identification among low-income children. This suggests ASD in low-income children may be under-identified and underestimated.
REFERENCES
APA (American Psychiatric Association). 2013. Diagnostic and statistical manual of mental disorders, fifth edition. Washington, DC: APA.
Baio, J. 2012. Prevalence of autism spectrum disorders: Autism and developmental disabilities monitoring network, 14 sites, United States, 2008. Morbidity and Mortality Weekly Report 61(SS03):1–19.
Baio, J. 2014. Prevalence of autism spectrum disorder among children aged 8 years: Autism and developmental disabilities monitoring network, 11 sites, United States, 2010. Morbidity and Mortality Weekly Report 63(SS02):1–21.
Blumberg, S. J., M. D. Bramlett, M. D. Kogan, L. A. Schieve, J. R. Jones, and M. C. Lu. 2013. Changes in prevalence of parent-reported autism spectrum disorder in school-aged U.S. children: 2007 to 2011–2012. National Health Statistics Reports 65(20):1–12.
Boyle, C. A., S. Boulet, L. A. Schieve, R. A. Cohen, S. J. Blumberg, M. Yeargin-Allsopp, S. Visser, and M. D. Kogan. 2011. Trends in the prevalence of developmental disabilities in U.S. children, 1997–2008. Pediatrics 127(6):1034–1042.
Braun, K. V. N., D. Christensen, N. Doernberg, L. Schieve, C. Rice, L. Wiggins, D. Schendel, and M. Yeargin-Allsopp. 2015. Trends in the prevalence of autism spectrum disorder, cerebral palsy, hearing loss, intellectual disability, and vision impairment, metropolitan Atlanta, 1991–2010. PLoS ONE 10(4):e0124120.
Cavagnaro, A. 2007. Autistic spectrum disorders: Changes in the California caseload. An update: June 1987-June 2007. California Health and Human Services Agency. www.dds.ca.gov/Autism/docs/AutismReport_2007.pdf (accessed July 15, 2015).
CDC (Centers for Disease Control and Prevention). 2015. Autism and Developmental Disabilities Monitoring (ADDM) Network. www.cdc.gov/ncbddd/autism/addm.html (accessed August 3, 2015).
Durkin, M. S. M., J. Matthew, C. J. Newschaffer, L.–C. Lee, C. M. Cunniff, J. L. Daniels, R. S. Kirby, L. Leavitt, L. Miller, W. Zahorodny, and L. A. Schieve. 2008. Advanced parental age and the risk of autism spectrum disorder. American Journal of Epidemiology 168(11):1268–1276.
Durkin, M. S., M. J. Maenner, F. J. Meaney, S. E. Levy, C. DiGuiseppi, J. S. Nicholas, R. S. Kirby, J. A. Pinto-Martin, and L. A. Schieve. 2010. Socioeconomic inequality in the prevalence of autism spectrum disorder: Evidence from a U.S. cross-sectional study. PLoS ONE 5(7):e11551.
Durkin, M. S., D. A. Bilder, S. Pettygrove, and W. Zahorodny. 2014. The validity and usefulness of public health surveillance of autism spectrum disorder. Autism 19(1):118–119.
Fombonne, E. 2009. Epidemiology of pervasive developmental disorders. Pediatric Research 65(6):591–598.
Grether, J. K., N. J. Rosen, K. S. Smith, and L. A. Croen. 2009. Investigation of shifts in autism reporting in the California Department of Developmental Services. Journal of Autism and Developmental Disorders 39(10):1412–1419.
King, M., and P. Bearman. 2009. Diagnostic change and the increased prevalence of autism. International Journal of Epidemiology 38(5):1224–1234.
Lotter, V. 1966. Epidemiology of autistic conditions in young children. Social Psychiatry 1(3):124–135.
Lundstrom, S., A. Reichenberg, H. Anckarsater, P. Lichtenstein, and C. Gillberg. 2015. Autism phenotype versus registered diagnosis in Swedish children: Prevalence trends over ten years in general population samples. British Medical Journal 350:h1961. doi: http://dx.doi.org/10.1136/bmj.h1961.
Maenner, M. J., C. E. Rice, C. L. Arneson, C. Cunniff, L. A. Schieve, L. A. Carpenter, K. Van Naarden Braun, R. S. Kirby, A. V. Bakian, and M. S. Durkin. 2014. Potential impact of DSM-5 criteria on autism spectrum disorder prevalence estimates. JAMA Psychiatry 71(3):292–300.
NSCH (National Survey of Children’s Health). 2012. Data query from the Child and Adolescent Health Measurement Initiative. http://childhealthdata.org/browse/survey/results?q=2408&r=1 (accessed August 3, 2015).
Rice, C. 2009. Prevalence of autism spectrum disorders: Autism and Developmental Disabilities Monitoring Network, United States, 2006. Morbidity and Mortality Weekly Report 58(SS10):1–20.
Rice, C. 2013. Time trends in diagnosis. In Encyclopedia of autism spectrum disorders, edited by F. Volkmar. New York: Springer. Pp. 3120–3125.
Rice, C., K. V. N. Braun, Autism and Developmental Disabilities Monitoring Network, and Centers for Disease Control and Prevention. 2007. Prevalence of autism spectrum disorders—Autism and developmental disabilities monitoring network, six sites, United States, 2000; Prevalence of autism spectrum disorders—Autism and developmental disabilities monitoring network, 14 sites, United States, 2002; and Evaluation of a methodology for a collaborative multiple source surveillance network for autism spectrum disorders—Autism and Developmental Disabilities Monitoring Network, 14 sites, United States, 2002. Washington, DC: U.S. Government Printing Office.
Rice, C. E., M. Rosanoff, G. Dawson, M. S. Durkin, L. A. Croen, A. Singer, and M. Yeargin-Allsopp. 2013. Evaluating changes in the prevalence of the autism spectrum disorders (ASDs). Public Health Reviews 34(2):1–22.
Rutter, M. 2005. Aetiology of autism: Findings and questions. Journal of Intellectual Disability Research 49(4):231–238.
Schieve, L. A., C. Rice, C. Boyle, S. N. Visser, and S. J. Blumberg. 2006. Mental health in the United States: Parental report of diagnosed autism in children aged 4–17 years—United States, 2003–2004. Morbidity and Mortality Weekly Report 55(17):481–486.
Schieve, L. A., C. Rice, O. Devine, M. J. Maenner, L.-C. Lee, R. Fitzgerald, M. S. Wingate, D. Schendel, S. Pettygrove, and K. van Naarden Braun. 2011. Have secular changes in perinatal risk factors contributed to the recent autism prevalence increase? Development and application of a mathematical assessment model. Annals of Epidemiology 21(12): 930–945.
Shattuck, P. T. 2006. The contribution of diagnostic substitution to the growing administrative prevalence of autism in U.S. special education. Pediatrics 117(4):1028–1037.
Shattuck, P. T., M. Durkin, M. Maenner, C. Newschaffer, D. S. Mandell, L. Wiggins, L.-C. Lee, C. Rice, E. Giarelli, and R. Kirby. 2009. Timing of identification among children with an autism spectrum disorder: Findings from a population-based surveillance study. Journal of the American Academy of Child & Adolescent Psychiatry 48(5):474–483.
Treffert, D. A. 1970. Epidemiology of infantile autism. Archives of General Psychiatry 22(5): 431–438.
U.S. Census Bureau. 2011. National intercensal estimates (2000–2010): Table 1 Intercensal estimates of the resident population by sex and age for the United States: April 1, 2000 to July 1, 2010. www.census.gov/popest/data/intercensal/national/nat2010.html (accessed July 28, 2015).
U.S. Census Bureau. 2014. Total population by child and adult populations. http://datacenter.kidscount.org/data/tables/99-total-population-by-child-and-adult-populations?loc=1&loct=1#detailed/1/any/false/35,18,17,16,15/39,41/416,417 (accessed November 14, 2014).
U.S. Census Bureau. 2015a. Annual estimates of the resident population for selected age groups by sex for the United States, states, and counties, and Puerto Rico Commonwealth and municipios: April 1, 2010 to July 1, 2014. http://factfinder.census.gov/faces/tableservices/jsf/pages/productview.xhtml?src=bkmk (accessed July 15, 2015).
U.S. Census Bureau. 2015b. CPS table creator. www.census.gov/cps/data/cpstablecreator.html (accessed July 13, 2015).
U.S. Department of Education. 2013. Thirty-fifth annual report to Congress on the implementation of the Individuals with Disabilities Education Act, Parts B and C. 2013: Part B data descriptions and data files. http://www2.ed.gov/about/reports/annual/osep/2013/parts-b-c/part-b-data/index.html (accessed July 28, 2015).
U.S. Department of Education. 2014. 2012 IDEA part B child count and educational environments. https://inventory.data.gov/dataset/2012-idea-part-b-child-count-and-educationalenvironments/resource/a68a23f3-3981-47db-ac75-98a167b65259?inner_span=True (accessed August 3, 2014).
Wing, L., and D. Potter. 2002. The epidemiology of autistic spectrum disorders: Is the prevalence rising? Mental Retardation and Developmental Disabilities Research Reviews 8(3):151–161.
This page intentionally left blank.


