
18
Medicaid Analytic eXtract Study
STUDY DESIGN AND METHODS
Study Population
The study population included all Medicaid-eligible youth aged 3–17 years in a selected subset of states for the years 2001–2010. The year 2010 is the most recent year that Medicaid Analytic eXtract (MAX) data were made publicly available. Enrollee age, for the purposes of inclusion in analyses, was computed as of July 1 of each year. Eleven months (not necessarily consecutive) of Medicaid eligibility in the year were required for inclusion in the study. The 20 states selected for inclusion were those that we and others found, in internal analyses as well as in published work, to provide relatively complete diagnosis and treatment detail (Byrd and Dodd, 2012; Nysenbaum et al., 2012).
Data Sources
The primary data source consisted of Medicaid enrollment, claims, and prescription drug-fill data from the MAX. The MAX data provide a set of research files constructed from mandated periodical data submissions by the state Medicaid programs, compiled and processed by the Centers for Medicare & Medicaid Services (CMS). Enrollment data include information on beneficiary characteristics such as age, sex, and race/ethnicity; Medicaid eligibility class; managed care participation; and other details that affect how care is organized and paid. Claims are provided separately
for inpatient, long-term care, and other (primarily outpatient) services and include details on diagnoses received and services delivered. A prescription drug file provided records for each filled prescription, allowing researchers to identify which medications were received, when the prescriptions were filled, how much of the drug was provided, and for how long. Drug data are not directly linked to specific inpatient or outpatient visits. The prescription drug records were linked to the First Data Bank National Drug Data File (NDDF), which provides the means to look up drug details using the national drug codes provided in the MAX data. Prescription medications were extracted from the MAX data by their generic names.
Database Construction and Analysis
The preliminary MAX data analyses included 44 states and the District of Columbia. A subset of 20 states was then identified that in 2009 either (1) had predominantly fee-for-service youth Medicaid populations or (2) had been identified as having relatively complete and usable managed care encounter data for that population (Byrd and Dodd, 2012; Nysenbaum et al., 2012). Key variables included in these data sets were sociodemographic characteristics (age, sex, race/ethnicity), month-by-month eligibility data, diagnoses recorded, services received, and prescriptions filled. The few youth with dual Medicaid–Medicare eligibility were excluded from analyses because records from Medicare, which is the first payer for many services, were not observable.
Enrollees were assigned to one of three basis-of-eligibility (BoE) groups following examination of their eligibility records: Supplemental Security Income (SSI)/Medicaid, foster care, and other (including a large group eligible solely because of household income). In general, households eligible for Medicaid through income are poor or near poor (<200 percent of the federal poverty level). Analyses were stratified by this grouping variable. We used each enrollee’s last observed BoE category in each year to assign her or him an overall status for the year. This was necessary in order to establish mutually exclusive eligibility categories. Preliminary analyses revealed 96 percent consistency throughout the year for the focal SSI/Medicaid group, suggesting that our method of assigning BoE categories on the basis of the last observation of the year did not distort these enrollees’ eligibility histories. The mappings from MAX BoE categories to these three groupings are detailed in Appendix F, Part A. The presence of ADHD and other diagnoses was identified using the multiple diagnosis fields in the MAX claims files, excluding long-term care claims. A threshold of either one or more inpatient claims or two or more outpatient claims on different dates was used to establish the presence of the following conditions for each enrollee for each
year of analysis (via codes from the International Classification of Diseases, Ninth Revision, Clinical Modification [ICD-9-CM]):
- Attention deficit hyperactivity disorder (ADHD; both alone and comorbid with other conditions)
- Conduct disorder (CD)
- Emotional disturbances
- Oppositional defiant disorder (ODD)
- Mood disorders (depression)
- Mood disorders (bipolar disorders)
- Anxiety disorders
- Autism spectrum disorder (ASD)
- Intellectual disorders (IDs)
- Speech and language disorders
- Hearing disorders
- Learning disorders (LDs)
- Cerebral palsy (control)
- Asthma (control)
Cerebral palsy and asthma were selected as control conditions in order to judge whether data for mental health disorders were distinctly different from data for other fairly frequent MAX conditions. The ICD-9-CM codes used to establish diagnoses are listed in Appendix B.
Pharmacological treatments were identified via generic drug names associated with filled prescriptions in the linked MAX/NDDF data and reported using the following categories of medications: ADHD medications (which include stimulants, atomoxetine, alpha agonists, bupropion, and three tricyclic antidepressants), antipsychotic medications, antidepressants, anxiolytic/hypnotic medications, and mood stabilizers. The generic drug names for each category are listed in Appendix F, Part C. Nonpharmacological treatments were identified via procedure codes recorded in the MAX claims (using Current Procedural Terminology codes and detailed in Appendix F, Part D).
Once enrollees’ eligibility, sociodemographic characteristics, diagnoses, prescriptions, and services were identified, analyses were performed to track diagnosis and treatment trends between 2001 and 2010.
10-YEAR TRENDS IN THE PREVALENCE OF COMMON CHILD MENTAL DISORDERS AMONG CHILDREN ENROLLED IN MEDICAID
Trends in the Number and Proportion of Children Enrolled in Medicaid by Basis of Eligibility
Table 18-1 summarizes the 10-year trends for the total number of children enrolled in Medicaid and the proportion of children within the three eligibility groups: SSI/disability, foster care, and other. Overall, the total number of child Medicaid enrollees among the 20 states increased by 57 percent, from approximately 5.23 million in 2001 to 8.21 million in 2010. For all SSI Medicaid enrollees, the total number of enrollees increased by 33 percent, from 361,106 to 478,822 (see Table 18-3b) during this time period. However, relative to the total number of all Medicaid enrollees, the percentage of the total population representing SSI Medicaid enrollees decreased by 16 percent (6.9 to 5.8 percent) from 2001 to 2010. Within this same time period, the proportion of children eligible for Medicaid due to foster care status also decreased by more than 30 percent (4.8 to 3.3 percent).
Trends in the Diagnosis of Mental Disorders Among All Medicaid Enrollees and Among SSI Medicaid Enrollees
Tables 18-2a and 18-2b summarize the number of mental disorder diagnoses, speech/language and hearing diagnoses, asthma diagnoses, and cerebral palsy diagnoses among all Medicaid enrollees and SSI Medicaid enrollees, respectively. In this analysis, children received Medicaid-funded care, and were also diagnosed for one or more disorders during the index year. For example, a child could receive paid treatment for more than one mental disorder or for at least one mental disorder and for a speech and language or hearing disorder during the index year.
Tables 18-3a and 18-3b summarize the 10-year trends in the estimated prevalence of mental disorders, speech/language and hearing disorders, asthma, and cerebral palsy diagnoses among all Medicaid enrollees and SSI Medicaid enrollees, respectively. A prevalence estimate for each diagnosis was generated by dividing the number of diagnoses by the number of all Medicaid enrollees within each year. The denominator was the total number of all Medicaid enrollees for each year, designated by the row labeled “N.” The numerator was the number of diagnoses.
The proportion of all Medicaid enrollees with a diagnosis of any one of the mental disorders included in the Medicaid study (see Table 18-3a) (ADHD, CD, emotional disturbances, ODD, depression, bipolar, anxiety
TABLE 18-1 Medicaid Basis of Eligibility (BoE) for All Medicaid Enrollees
| Basis of Eligibility | 2001 | 2002 | 2003 | 2004 | 2005 | 2006 | 2007 | 2008 | 2009 | 2010 |
| Foster care | 4.8% | 4.7% | 4.5% | 4.4% | 4.3% | 4.4% | 4.4% | 4.2% | 3.6% | 3.3% |
| Other | 88.3% | 88.8% | 89.1% | 89.2% | 89.4% | 89.2% | 89.1% | 89.4% | 90.2% | 90.9% |
| SSI/Disability (Medicaid) | 6.9% | 6.5% | 6.4% | 6.4% | 6.3% | 6.4% | 6.6% | 6.4% | 6.2% | 5.8% |
| Total | 100% | 100% | 100% | 100% | 100% | 100% | 100% | 100% | 100% | 100% |
| N (total # of all medicaid enrollees) | 5,232,083 | 5,749,809 | 6,144,784 | 6,356,411 | 6,658,353 | 6,630,423 | 6,593,490 | 6,899,748 | 7,545,081 | 8,208,507 |
NOTE: Inclusion criteria: youth ages 3–17 with 11+ months of Medicaid eligibility and no dual eligibility in the year, in the last month of observation for the enrollee.
SOURCE: Medicaid Analytic eXtract (MAX) data for 20 states: AK, AL, AR, CA, FL, ID, IL, IN, LA, MI, MS, MT, NC, ND, NH, NM, SD, VA, VT, WY.
TABLE 18-2a Number of Diagnoses Among All Medicaid Enrollees
| Diagnosis | 2001 | 2002 | 2003 | 2004 |
| ADHD | 157,867 | 181,400 | 217,970 | 248,157 |
| Conduct disorder | 56,189 | 63,443 | 69,909 | 73,841 |
| Emotional disturbances | 72,318 | 78,655 | 86,569 | 94,186 |
| Oppositional defiant disorder | 44,399 | 49,045 | 54,325 | 59,301 |
| Depression | 88,177 | 100,314 | 114,817 | 124,624 |
| Bipolar disorders | 15,923 | 19,417 | 24,416 | 29,740 |
| Anxiety disorders | 26,957 | 31,009 | 35,776 | 40,385 |
| Autism spectrum disorders | 11,746 | 13,465 | 16,373 | 18,753 |
| Intellectual disorders | 33,110 | 33,856 | 33,877 | 33,811 |
| Learning disorders | 62,126 | 64,606 | 66,378 | 66,428 |
| Any of the abovea | 411,670 | 458,502 | 515,838 | 561,252 |
| Speech and language disorders | 82,362 | 90,749 | 100,442 | 113,563 |
| Hearing disorders | 257,026 | 279,457 | 311,864 | 275,211 |
| Cerebral palsy | 27,694 | 28,937 | 31,612 | 32,373 |
| Asthma | 117,849 | 141,537 | 171,114 | 185,860 |
aAny of the above means a child with any one of the diagnoses, including if the child had comorbid diagnoses. A child with multiple co-occurring diagnoses would still be counted only once for this estimate of prevalence.
disorders, ASD, ID, and LD) increased by 41 percent (from 7.9 to 11.1 percent; also see Figure 18-1), even as the total number of children increased from 5,232,083 to 8,208,507. Across this time period, the most common mental health diagnosis was ADHD. The percentage of children enrolled in Medicaid with a diagnosis of ADHD rose by 83 percent, from 3.0 to 5.5 percent. In 2010 the prevalence of other specific mental health diagnoses ranged from 0.5 to 2.2 percent, with depression being the second most common mental health diagnosis across the years.
Of note, the substantial percent increase in the prevalence of asthma among all Medicaid enrollees was the same as that among children with ADHD (83 percent, from 2.3 percent in 2001 to 4.2 percent in 2010) (see Figure 18-1). In contrast, the percentage of All Medicaid enrollees with a diagnosis of cerebral palsy decreased by 20 percent, from 0.5 to 0.4 percent across the 2001–2010 decade.
As can be seen in Table 18-3b, among SSI Medicaid enrollees the percentage of children with a diagnosis of any one of the mental disorders
| 2005 | 2006 | 2007 | 2008 | 2009 | 2010 |
| 280,223 | 286,997 | 306,834 | 349,037 | 405,795 | 448,796 |
| 76,985 | 78,507 | 82,497 | 92,676 | 107,546 | 113,367 |
| 98,804 | 103,241 | 110,256 | 121,807 | 137,217 | 145,629 |
| 74,345 | 82,324 | 90,149 | 99,998 | 113,359 | 118,009 |
| 126,300 | 128,527 | 131,713 | 145,324 | 167,063 | 182,931 |
| 34,189 | 36,616 | 40,266 | 43,427 | 46,999 | 48,018 |
| 54,941 | 62,256 | 66,570 | 77,325 | 91,666 | 105,234 |
| 28,486 | 32,772 | 38,155 | 44,804 | 49,699 | 57,758 |
| 35,988 | 36,553 | 39,146 | 42,123 | 42,346 | 43,137 |
| 68,794 | 72,325 | 69,711 | 75,656 | 85,646 | 101,565 |
| 612,024 | 626,073 | 659,001 | 731,818 | 831,780 | 907,731 |
| 131,657 | 138,423 | 134,313 | 151,430 | 177,688 | 222,132 |
| 310,570 | 305,634 | 316,366 | 355,360 | 432,264 | 446,534 |
| 33,028 | 33,582 | 34,440 | 35,134 | 35,811 | 36,488 |
| 214,890 | 215,554 | 225,655 | 254,077 | 323,083 | 342,512 |
increased by 32 percent (from 29.2 to 38.6 percent; also see Figure 18-2), even as the total number of children increased from 361,106 to 478,822. The most common mental health diagnosis was ADHD, with a 65 percent prevalence increase (from 10.7 to 17.7 percent) across this 10-year period, from 38,466 children in 2001 to 84,519 children in 2010. The second most common mental health disorder was learning disorders (6.8 percent), followed by autism spectrum disorder (6.7 percent), and intellectual disability (6.4 percent) in 2010.
The percent increase among children with asthma and ADHD among SSI Medicaid enrollees was roughly the same as among all Medicaid enrolled children in the study states (see Figure 18-2). The percentage of SSI Medicaid enrollees with an asthma diagnosis increased by 61 percent (from 4.9 to 7.9 percent), corresponding to an increase from 17,622 children in 2001 to 38,034 children in 2010. The percentage of SSI Medicaid enrollees with a diagnosis of cerebral palsy decreased by 8 percent (from 6.2 to 5.7 percent).
TABLE 18-2b Number of Diagnoses Among SSI Medicaid Enrollees
| Diagnosis | 2001 | 2002 | 2003 | 2004 |
| ADHD | 38,466 | 42,603 | 48,485 | 53,357 |
| Conduct disorder | 12,473 | 14,083 | 15,228 | 16,226 |
| Emotional disturbances | 15,180 | 16,534 | 17,907 | 19,168 |
| Oppositional defiant disorder | 9,884 | 10,902 | 11,781 | 12,412 |
| Depression | 14,478 | 16,198 | 17,769 | 18,745 |
| Bipolar disorders | 5,211 | 6,337 | 7,640 | 9,206 |
| Anxiety disorders | 2,916 | 3,150 | 3,557 | 3,970 |
| Autism spectrum disorders | 8,072 | 9,075 | 10,859 | 12,273 |
| Intellectual disorders | 23,872 | 24,371 | 24,499 | 25,079 |
| Learning disorders | 20,266 | 21,352 | 22,941 | 23,992 |
| Any of the abovea | 105,298 | 113,586 | 122,609 | 131,420 |
| Speech and language disorders | 22,787 | 24,742 | 27,333 | 30,509 |
| Hearing disorders | 30,919 | 32,074 | 33,438 | 30,981 |
| Cerebral palsy | 22,426 | 23,212 | 24,956 | 25,610 |
| Asthma | 17,622 | 19,885 | 22,719 | 24,144 |
aAny of the above means a child with any one of the diagnoses, including if the child had comorbid diagnoses. A child with multiple co-occurring diagnoses would still be counted only once for this estimate of prevalence.
Comparing Trends Between Medicaid and SSI Recipients from 2004 to 2010
Making direct comparisons of trends observed in the Medicaid population with trends observed in the full SSI program is possible only from 2004 to 2010 because the SSI program data were generated and delivered by the Social Security Administration (SSA) for the committee for the years specified in the study contract, from 2004 to 2013, and Medicaid data are only available up to 2010.
As shown in the left-hand sections of Table 18-4 and detailed above, among all Medicaid enrollees, there is a steady increase over time in the proportion of children who are diagnosed with a mental disorder—rising from 8.8 percent in 2004 to 11.1 percent in 2010, an increase of 26.1 percent over this interval. SSI Medicaid enrollees all have some qualifying disability by definition. Of these, 32.2 percent were diagnosed with a mental disorder in 2004, and 38.6 percent in 2010, an increase of 19.8
| 2005 | 2006 | 2007 | 2008 | 2009 | 2010 |
| 59,756 | 60,492 | 62,787 | 69,149 | 81,051 | 84,519 |
| 16,788 | 16,478 | 16,730 | 18,506 | 21,835 | 22,067 |
| 19,628 | 20,184 | 21,117 | 22,702 | 25,464 | 25,870 |
| 14,565 | 15,840 | 17,246 | 18,639 | 21,331 | 21,320 |
| 18,576 | 18,669 | 19,004 | 21,295 | 25,213 | 26,251 |
| 10,167 | 10,693 | 11,511 | 12,364 | 13,846 | 13,550 |
| 5,117 | 5,677 | 6,295 | 7,234 | 8,522 | 9,473 |
| 15,685 | 18,056 | 21,284 | 25,203 | 28,132 | 31,876 |
| 26,506 | 27,407 | 29,515 | 31,153 | 30,956 | 30,563 |
| 24,758 | 25,742 | 24,419 | 25,650 | 28,195 | 32,546 |
| 140,233 | 141,913 | 146,859 | 158,246 | 177,280 | 184,856 |
| 35,141 | 37,667 | 37,256 | 41,885 | 48,361 | 57,106 |
| 31,853 | 32,106 | 33,110 | 35,497 | 40,537 | 40,861 |
| 25,598 | 25,953 | 26,504 | 26,872 | 27,266 | 27,361 |
| 26,243 | 26,893 | 28,078 | 30,708 | 37,307 | 38,034 |
percent. Thus, among the sizable population of children who are eligible for Medicaid (more than 8 million in 2010), there is a growing trend of diagnoses of mental disorders. The rise in the prevalence of mental disorders observed among the SSI recipients is exceeded by the increasing prevalence among the entire Medicaid population, thus reflecting a larger secular trend. This observation is further supported by data shown in the two right-hand columns in Table 18-4. Drawing on data described in Chapter 3, we present estimates of the entire eligible U.S. population of youth who were SSI recipients for mental disorders in 2004 and in 2010. Here too we observe a small increase between 2004 and 2010, supporting the view that an increasing number of U.S. families are receiving SSI benefits due to mental disorders. However, the rates of SSI receipt for mental disorders among the U.S. population lag behind the increase in diagnoses for mental disorder among Medicaid enrollees. We interpret this pattern of results as indicating a growing demand for mental health services among low-income families (Medicaid enrollees), which is, to a lesser extent, reflected by increases in SSI recipients with mental disorders.
TABLE 18-3a Estimated Prevalence Among All Medicaid Enrollees
| Diagnosis | 2001 | 2002 | 2003 | 2004 |
| ADHD | 3.0% | 3.2% | 3.5% | 3.9% |
| Conduct disorder | 1.1% | 1.1% | 1.1% | 1.2% |
| Emotional disturbances | 1.4% | 1.4% | 1.4% | 1.5% |
| Oppositional defiant disorder | 0.8% | 0.9% | 0.9% | 0.9% |
| Depression | 1.7% | 1.7% | 1.9% | 2.0% |
| Bipolar disorders | 0.3% | 0.3% | 0.4% | 0.5% |
| Anxiety disorders | 0.5% | 0.5% | 0.6% | 0.6% |
| Autism spectrum disorders | 0.2% | 0.2% | 0.3% | 0.3% |
| Intellectual disorders | 0.6% | 0.6% | 0.6% | 0.5% |
| Speech and language disorders | 1.6% | 1.6% | 1.6% | 1.8% |
| Hearing disorders | 4.9% | 4.9% | 5.1% | 4.3% |
| Learning disorders | 1.2% | 1.1% | 1.1% | 1.0% |
| Any of the abovea | 7.9% | 8.0% | 8.4% | 8.8% |
| Cerebral palsy | 0.5% | 0.5% | 0.5% | 0.5% |
| Asthma | 2.3% | 2.5% | 2.8% | 2.9% |
| N (total # of all medicaid enrollees) | 5,232,083 | 5,749,809 | 6,144,784 | 6,356,411 |
aAny of the above means a child with any one of the diagnoses, including if the child had comorbid diagnoses. A child with multiple co-occurring diagnoses would still be counted only once for this estimate of prevalence.
Discussion of Trends Observed in the Medicaid Study
Overall, these data indicate an increasing prevalence of mental disorder diagnoses among children enrolled in Medicaid which exceeds the growth rate among SSI recipients between 2001 and 2010. Additionally, the trend direction for mental disorder prevalence observed in the SSI program for children is consistent with overall trends among all Medicaid enrollees as well as among the subset of SSI Medicaid enrollees. However, while these global mental disorder trend comparisons are useful, comparisons of disorder specific trends may show different patterns. Disorder-specific trends are reviewed in Part III of the report.
Trend findings from the MAX data support several conclusions. First, the number of child Medicaid enrollees grew substantially between 2001 and 2010. This growth may reflect increases in child poverty as well as
| 2005 | 2006 | 2007 | 2008 | 2009 | 2010 |
| 4.2% | 4.3% | 4.7% | 5.1% | 5.4% | 5.5% |
| 1.2% | 1.2% | 1.3% | 1.3% | 1.4% | 1.4% |
| 1.5% | 1.6% | 1.7% | 1.8% | 1.8% | 1.8% |
| 1.1% | 1.2% | 1.4% | 1.4% | 1.5% | 1.4% |
| 1.9% | 1.9% | 2.0% | 2.1% | 2.2% | 2.2% |
| 0.5% | 0.6% | 0.6% | 0.6% | 0.6% | 0.6% |
| 0.8% | 0.9% | 1.0% | 1.1% | 1.2% | 1.3% |
| 0.4% | 0.5% | 0.6% | 0.6% | 0.7% | 0.7% |
| 0.5% | 0.6% | 0.6% | 0.6% | 0.6% | 0.5% |
| 2.0% | 2.1% | 2.0% | 2.2% | 2.4% | 2.7% |
| 4.7% | 4.6% | 4.8% | 5.2% | 5.7% | 5.4% |
| 1.0% | 1.1% | 1.1% | 1.1% | 1.1% | 1.2% |
| 9.2% | 9.4% | 10.0% | 10.6% | 11.0% | 11.1% |
| 0.5% | 0.5% | 0.5% | 0.5% | 0.5% | 0.4% |
| 3.2% | 3.3% | 3.4% | 3.7% | 4.3% | 4.2% |
| 6,658,353 | 6,630,423 | 6,593,490 | 6,899,748 | 7,545,081 | 8,208,507 |
other policy or program changes that affect child Medicaid enrollment. The large increases in the number of enrollees observed from 2008 to 2010 coincide with the period of recession and growth in child poverty. In addition, the numbers of uninsured children decreased during the 10-year period, as the numbers enrolled in Medicaid and the Children’s Health Insurance Program increased, likely the result of policies incentivizing the enrollment of eligible children in Medicaid (HHS, 2010).
Second, among Medicaid enrollees, the percentage with SSI coverage or foster care eligibility decreased over the decade, indicating that from 2001 to 2010 the number of children eligible due to low income increased more quickly than the number of children in foster care or with SSI.
Third, mental disorder diagnoses increased at roughly similar rates among all eligibility categories and at rates that paralleled increases in
TABLE 18-3b Estimated Prevalence Among SSI Medicaid Enrollees
| Diagnosis | 2001 | 2002 | 2003 | 2004 |
| ADHD | 10.7% | 11.3% | 12.3% | 13.1% |
| Conduct disorder | 3.5% | 3.7% | 3.8% | 4.0% |
| Emotional disturbances | 4.2% | 4.4% | 4.5% | 4.7% |
| Oppositional defiant disorder | 2.7% | 2.9% | 3.0% | 3.0% |
| Depression | 4.0% | 4.3% | 4.5% | 4.6% |
| Bipolar disorders | 1.4% | 1.7% | 1.9% | 2.3% |
| Anxiety disorders | 0.8% | 0.8% | 0.9% | 1.0% |
| Autism spectrum disorders | 2.2% | 2.4% | 2.7% | 3.0% |
| Intellectual disorders | 6.6% | 6.5% | 6.2% | 6.2% |
| Speech and language disorders | 6.3% | 6.6% | 6.9% | 7.5% |
| Hearing disorders | 8.6% | 8.5% | 8.4% | 7.6% |
| Learning disorders | 5.6% | 5.7% | 5.8% | 5.9% |
| Any of the abovea | 29.2% | 30.2% | 31.0% | 32.2% |
| Cerebral palsy | 6.2% | 6.2% | 6.3% | 6.3% |
| Asthma | 4.9% | 5.3% | 5.7% | 5.9% |
| N (total # of SSI medicaid enrollees) | 361,106 | 376,196 | 395,718 | 407,703 |
aAny of the above means a child with any one of the diagnoses, including if the child had comorbid diagnoses. A child with multiple co-occurring diagnoses would still be counted only once for this estimate of prevalence.
asthma diagnoses. Children in low-income households have higher rates of both mental disorders and asthma; thus, the finding of increased rates of asthma reinforces the importance of poverty as a factor contributing to the increasing rates of mental disorders in children.
Findings from Table 18-4 raise four other points of relevance. First, a very low percentage of all children living in poverty receive SSI for mental disorders, even though a substantial minority of all Medicaid-enrolled children have mental disorder diagnoses. While the SSI eligibility requirement for a severe medically determinable impairment likely accounts for much of this difference, the marked discrepancy raises questions about the number of children in poverty with mental disorders who may be eligible for SSI but who do not receive benefits.
Second, the much higher rates of mental disorder diagnoses observed among SSI Medicaid than among all Medicaid enrollees is likely explained
| 2005 | 2006 | 2007 | 2008 | 2009 | 2010 |
| 14.4% | 14.2% | 14.5% | 15.7% | 17.3% | 17.7% |
| 4.0% | 3.9% | 3.9% | 4.2% | 4.7% | 4.6% |
| 4.7% | 4.7% | 4.9% | 5.2% | 5.4% | 5.4% |
| 3.5% | 3.7% | 4.0% | 4.2% | 4.6% | 4.5% |
| 4.5% | 4.4% | 4.4% | 4.8% | 5.4% | 5.5% |
| 2.4% | 2.5% | 2.7% | 2.8% | 3.0% | 2.8% |
| 1.2% | 1.3% | 1.5% | 1.6% | 1.8% | 2.0% |
| 3.8% | 4.2% | 4.9% | 5.7% | 6.0% | 6.7% |
| 6.4% | 6.4% | 6.8% | 7.1% | 6.6% | 6.4% |
| 8.4% | 8.8% | 8.6% | 9.5% | 10.3% | 11.9% |
| 7.7% | 7.5% | 7.7% | 8.1% | 8.6% | 8.5% |
| 5.9% | 6.0% | 5.7% | 5.8% | 6.0% | 6.8% |
| 33.7% | 33.3% | 34.0% | 36.0% | 37.8% | 38.6% |
| 6.1% | 6.1% | 6.1% | 6.1% | 5.8% | 5.7% |
| 6.3% | 6.3% | 6.5% | 7.0% | 8.0% | 7.9% |
| 416,367 | 426,454 | 431,901 | 440,135 | 468,735 | 478,822 |
by the SSI eligibility criteria. Medicaid-enrolled children who receive SSI will all have significant impairments, with a substantial proportion based on mental disorders, while many other Medicaid-enrolled children will have no impairment or mental disorder diagnosis. Furthermore, the Medicaid study selection criteria include only children who had either one inpatient or two outpatient encounters; children who fail to meet those criteria were not included. As a result, the Medicaid study data may generate a higher estimate of the prevalence of mental disorders than studies that include enrollees who have not submitted claims.
Third, Table 18-4 shows a notable discrepancy between the number of SSI recipients with mental disorders and the number of SSI Medicaid enrollees with a mental disorder diagnosis. In 2010 there were 615,772 child recipients for mental disorders, while there were only 184,856 children who were enrolled in Medicaid and on SSI with a mental disorder diagnosis.
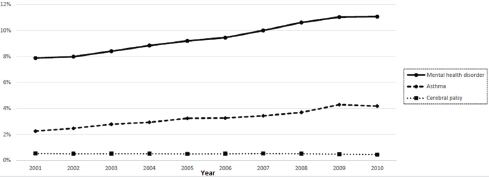
FIGURE 18-1 Diagnoses among all Medicaid enrollees, 2001–2010.
NOTES: Mental health disorder: ADHD, conduct disorders, emotional disturbances, oppositional defiant disorder, depression, bipolar disorders, anxiety disorders, intellectual disorders, learning disorders, autism spectrum disorders. Inclusion criteria: youth age 3–17 with 11+ months of Medicaid eligibility and no dual eligibility in the year. A diagnosis was established based on the presence of one or more inpatient or two or more non-inpatient claims with qualifying ICD-9-CM codes.
SOURCE: MAX data for 20 states: AK, AL, AR, CA, FL, ID, IL, IN, LA, MI, MS, MT, NC, ND, NH, NM, SD, VA, VT, WY.
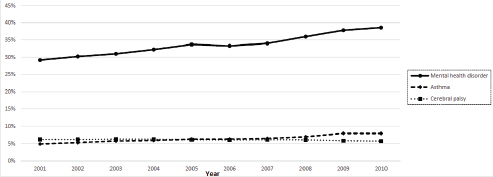
FIGURE 18-2 Diagnoses among SSI Medicaid enrollees, 2001–2010.
NOTES: Mental health disorder: ADHD, conduct disorders, emotional disturbances, oppositional defiant disorder, depression, bipolar disorders, anxiety disorders, intellectual disorders, learning disorders, autism spectrum disorders. Inclusion criteria: youth age 3–17 with 11+ months of Medicaid eligibility and no dual eligibility in the year. A diagnosis was established based on the presence of one or more inpatient or two or more non-inpatient claims with qualifying ICD-9-CM codes.
SOURCE: MAX data for 20 states: AK, AL, AR, CA, FL, ID, IL, IN, LA, MI, MS, MT, NC, ND, NH, NM, SD, VA, VT, WY.
TABLE 18-4 Change in Prevalence Estimates of Mental Disorders from 2004 to 2010 Among Children Enrolled in Medicaid and on SSI
| All Medicaid Enrollees | SSI Medicaid Enrollees | SSI Medicaid Enrollees | ||||
| Percent Diagnosed with Any of the 10 Mental Disorders | Number of All Medicaid Enrollees Diagnosed with Any Mental Disorder | Percent Diagnosed with Any Mental Disorder | Number of SSI/Disability Enrollees Diagnosed with Any Mental Disorder | Percent of Children from Households Under 200% FPL with Any of the 10 Major Mental Disorders | Number of SSI Recipients with Any of the 10 Major Mental Disorders | |
| 2004 | 8.80% | 561,252 | 32.20% | 131,420 | 1.88% | 540,051 |
| 2010 | 11.10% | 907,731 | 38.60% | 184,856 | 1.91% | 615,772 |
| Percentage increase in the % of children with a mental disorder diagnosis | 26.1% | 19.8% | 1.6% | |||
NOTE: FPL = federal poverty level.
Similarly, in 2010 the total number of child SSI recipients was 1,239,269, while the total number SSI Medicaid enrollees included in the study for 2010 was 478,822. Several issues contribute to this difference. First, the Medicaid study includes only 20 states, while the SSI program includes all 50 states. Second, the Medicaid study likely underestimates the number of children who are both SSI recipients and enrolled in Medicaid because only children meeting study criteria for continuous enrollment for each index year were included. One inclusion criterion was that an individual must have had 11 months of Medicaid eligibility within 1 year. As such, enrolled individuals who submitted one or no claims or who lost Medicaid coverage during an index year would be excluded from the study.
Fourth, the proportion of children with a mental health diagnosis may be underestimated in the Medicaid study because a child was identified as receiving Medicaid paid care for an index disorder if the individual had at least one inpatient claim or two or more outpatient claims on different dates for the same mental health diagnosis. As such, children who dropped out of care after one outpatient visit would be excluded from the study.
Finally, the difference between the large 2004–2010 growth in numbers of children in the Medicaid population who have mental disorder diagnoses and the much smaller growth in numbers of children with a mental disorder diagnosis in the SSI recipient population (see Table 18-4) cannot be definitively explained by the information at hand. Two potential contributing factors, worthy of future analyses, are (1) an increasing rate of diagnosis of mental disorders for children who are Medicaid enrollees and who do not meet the moderate to severe impairment SSI criteria, and (2) stricter SSI adjudication processes for mental disorder impairment during this 7-year window.
Given that the number of impoverished and Medicaid-eligible children has increased over the period of interest, and given that the prevalence of mental disorder diagnoses within the child Medicaid population increased at a rate commensurate with SSI recipients with mental disorders over the same period, it is likely that there is a substantial and growing population of children who are eligible to receive SSI benefits for mental disorders but who are not recipients.
COMORBIDITY
Although no comparable comorbidity data are available from the SSI data, findings from the Medicaid study are consistent with those from epidemiologic studies that suggest high rates of comorbidity among children with mental disorders. Upon close reading of Tables 18-2a and 18-2b, findings suggest that there is a high rate of comorbidity between mental disorder diagnoses in the child Medicaid population. In these tables, the “Any
of the Above” row corresponds to a child who received Medicaid-funded care, and also had one or more of these diagnoses recorded related to an episode of care during the index year as well as may include children who may have more than one mental disorder diagnosis recorded during a service encounter. The number of children with any one diagnosis is therefore much smaller than the sum each individual diagnosis in each row above. For example, of SSI Medicaid enrollees in 2010, there were approximately 184,856 enrollees with at least one of the clinically treated diagnoses, but each of the clinically treated diagnoses sum to nearly 300,000. This indicates that there are at least approximately 115,000 additional diagnoses among the 184,856 children with at least one diagnosis.
In addition, the Medicaid study included an analysis of the frequency of co-occurring mental disorder diagnosis among children with a diagnosis of ADHD. The committee recommended a more detailed descriptive data analysis describing comorbidity among children receiving Medicaid-funded care for ADHD because it was the most common mental disorder among all Medicaid and SSI enrollees and has high rates of comorbidity clinically. Tables 18-5a and 18-5b summarize the 10-year trends in the proportion of children with a comorbid mental disorder, speech and language disorder, hearing disorder, cerebral palsy and asthma among children with ADHD, among all Medicaid and SSI enrollees, respectively. In both 2001 and 2010, the most common comorbid mental disorders among all Medicaid enrollees who received paid treatment for ADHD were emotional disturbances (2001, 11.6 percent; 2010, 13.4 percent), oppositional defiant disorder (2001, 9.4 percent; 2010, 11.7 percent), and depression (2001, 9.3 percent; 2010, 11.2 percent). Among SSI Medicaid enrollees with paid treatment for ADHD, emotional disturbances (2001, 13.5 percent; 2010, 16.7 percent) and oppositional defiant disorder (2001, 11.2 percent; 2010, 14.9 percent) were the top two comorbid disorders. In 2001, the third most common comorbid disorder was conduct disorder (10.2 percent), but in 2010 depression rose to the rank of the third most common comorbid disorder (13.4 percent). Tables 18-6a and 18-6b summarize the 10-year trends in the proportion of children receiving Medicaid-funded care for ADHD who have any comorbid mental health or developmental disorder and any externalizing behavior disorder (defined as oppositional defiant disorder or conduct disorder) among all Medicaid and SSI enrollees, respectively. Overall, the rates of comorbidity were high. Among all Medicaid enrollees, the proportion of children with ADHD and any comorbid mental or developmental disorder rose 12 percent between 2001 and 2010 (38.2 to 43.3 percent). The rates of comorbid externalizing behavior problems among children with ADHD rose by 14 percent during this same time period (15.8 to 18.3 percent). Among SSI Medicaid enrollees, the overall rates of comorbidity were higher. The proportion of children with ADHD and any comorbid
TABLE 18-5a Comorbid Diagnoses, All Enrollees with ADHD
| Diagnosis | 2001 | 2002 | 2003 | 2004 |
| ADHD | ||||
| Conduct disorder | 8.1% | 8.0% | 7.9% | 7.8% |
| Emotional disturbances | 11.6% | 11.4% | 11.2% | 10.9% |
| Oppositional defiant disorder | 9.4% | 9.4% | 9.3% | 9.1% |
| Depression | 9.3% | 9.1% | 9.5% | 9.8% |
| Bipolar disorders | 3.4% | 3.6% | 4.0% | 4.6% |
| Anxiety disorders | 2.7% | 2.7% | 3.0% | 3.1% |
| Autism spectrum disorders | 1.0% | 1.1% | 1.2% | 1.3% |
| Intellectual disorders | 2.1% | 2.0% | 1.8% | 1.6% |
| Learning disorders | 4.1% | 4.1% | 3.8% | 3.7% |
| Speech and language disorders | 4.5% | 4.4% | 4.7% | 4.9% |
| Hearing disorders | 7.7% | 7.6% | 7.9% | 6.9% |
| Cerebral palsy | 0.5% | 0.4% | 0.5% | 0.4% |
| Asthma | 4.2% | 4.6% | 5.1% | 5.4% |
| N | 157,867 | 181,400 | 217,970 | 248,157 |
NOTE: Inclusion criteria: youth age 3–17 with 11+ months of Medicaid eligibility and no dual eligibility in the year. A diagnosis was established based on the presence of one or more inpatient or two or more non-inpatient claims with qualifying ICD-9-CM codes.
SOURCE: MAX data for 20 states: AK, AL, AR, CA, FL, ID, IL, IN, LA, MI, MS, MT, NC, ND, NH, NM, SD, VA, VT, WY.
mental or development disorder rose 17 percent (46.3 to 55.8 percent), and for ADHD and any comorbid externalizing disorder the proportion of children rose 18 percent (19.2 to 23.4 percent).
MENTAL DISORDERS BY RACE AND ETHNICITY
The SSA does not keep or provide information on the race and the ethnicity of SSI recipients. Thus, all information regarding race and ethnicity comes from other reports, mainly of characteristics of children and adolescents who receive Medicaid for disability. Table 18-7 shows the estimated prevalence of mental disorder diagnoses among SSI Medicaid enrollees, in 2010, by race and ethnicity. The analysis carried out in support of the work of this committee shows an overrepresentation of African American children in the identified SSI population (32 percent African American, 10 percent Latino, 22 percent white, with 34 percent mixed or unidentified).
Previous studies have shown varied findings regarding racial and ethnic characteristics of children with chronic conditions in general (Halfon et al.,
| 2005 | 2006 | 2007 | 2008 | 2009 | 2010 |
| 7.9% | 8.4% | 8.5% | 8.7% | 8.8% | 8.6% |
| 11.4% | 12.8% | 13.2% | 13.4% | 13.5% | 13.4% |
| 9.6% | 11.1% | 11.6% | 11.8% | 11.9% | 11.7% |
| 9.6% | 10.4% | 10.2% | 10.4% | 10.8% | 11.2% |
| 4.9% | 5.4% | 5.4% | 5.3% | 5.0% | 4.7% |
| 3.4% | 3.8% | 3.9% | 4.2% | 4.6% | 5.1% |
| 1.9% | 2.2% | 2.6% | 2.9% | 2.9% | 3.2% |
| 1.6% | 1.7% | 1.7% | 1.6% | 1.4% | 1.4% |
| 3.6% | 3.8% | 3.5% | 3.5% | 3.6% | 3.9% |
| 4.9% | 5.2% | 5.1% | 5.3% | 5.6% | 6.4% |
| 6.9% | 6.6% | 6.6% | 6.8% | 7.0% | 6.7% |
| 0.4% | 0.5% | 0.5% | 0.4% | 0.4% | 0.4% |
| 6.0% | 6.1% | 6.2% | 6.3% | 7.0% | 6.9% |
| 280,223 | 286,997 | 306,834 | 349,037 | 405,795 | 448,796 |
2012; Van Cleave et al., 2010); however, previous studies of the SSI population (usually using similar methodology to the MAX studies) have also shown a predominance of African American children (Perrin et al., 1998, 1999). There have also been several reports indicating racial and ethnic differences in diagnosis and receipt of services for mental health conditions (HHS, 2001). Some of this represents differential access to care by race and ethnicity (especially, for example, in diagnostic and treatment services for autism spectrum disorder). Others represent effects of language on diagnosis, where some diagnosticians and some commonly used tests may be limited to English-speaking children and families. Variation in prevalence of diagnoses across race and ethnic categories must be cautiously interpreted due not only to the effects of socioeconomic status and poverty, but also due to the effects of test bias and diagnostic bias.
Race and ethnicity data are generally not reliable for routine use in analyses of Medicaid claims data. First, the administrative claims forms in many states do not employ standard race/ethnicity questions across the recommended Office of Management and Budget categories that separate
TABLE 18-5b Comorbid Diagnoses, SSI/Disability Enrollees with ADHD
| Diagnosis | 2001 | 2002 | 2003 | 2004 |
| ADHD Conduct disorder | 10.2% | 10.6% | 10.8% | 10.8% |
| Emotional disturbances | 13.5% | 13.6% | 14.1% | 13.6% |
| Oppositional defiant disorder | 11.2% | 11.5% | 11.9% | 11.4% |
| Depression | 9.7% | 9.9% | 10.4% | 10.6% |
| Bipolar disorders | 5.4% | 5.8% | 6.5% | 7.3% |
| Anxiety disorders | 2.0% | 2.0% | 2.2% | 2.5% |
| Autism spectrum disorders | 2.6% | 2.8% | 3.3% | 3.7% |
| Intellectual disorders | 5.5% | 5.5% | 5.3% | 4.8% |
| Learning disorders | 6.3% | 6.6% | 6.4% | 6.4% |
| Speech and language disorders | 6.7% | 6.9% | 7.3% | 8.1% |
| Hearing disorders | 7.8% | 7.8% | 7.8% | 7.0% |
| Cerebral palsy | 1.3% | 1.3% | 1.4% | 1.4% |
| Asthma | 4.7% | 5.5% | 6.2% | 6.5% |
| N | 38,466 | 42,603 | 48,485 | 53,357 |
NOTE: Inclusion criteria: youth age 3–17 with 11+ months of Medicaid eligibility and no dual eligibility in the year. A diagnosis was established based on the presence of one or more inpatient or two or more non-inpatient claims with qualifying ICD-9-CM codes.
SOURCE: MAX data for 20 states: AK, AL, AR, CA, FL, ID, IL, IN, LA, MI, MS, MT, NC, ND, NH, NM, SD, VA, VT, WY.
race and ethnicity as separate variables. Even in the consideration of race alone, the field is missing in approximately 20 percent of the claims filed (IOM, 2009). Because these data are also missing from the SSA data fields, additional analyses on race/ethnicity were not conducted.
TREATMENT
For certain mental disorders in children, appropriate treatment, including medication and psychological services, can significantly reduce impairment and improve outcomes. Treatment among the SSI disability population may have an effect on the rates of disability; as such, the SSA directed the committee to identify the types of care documented or reported to be received by children in the SSI population. The SSI program does not systematically collect any information on treatment after adjudications of eligibility are made.
| 2005 | 2006 | 2007 | 2008 | 2009 | 2010 |
| 10.6% | 11.2% | 11.2% | 11.4% | 11.6% | 11.4% |
| 13.9% | 15.8% | 16.8% | 17.0% | 16.9% | 16.7% |
| 11.9% | 13.9% | 15.0% | 15.2% | 15.3% | 14.9% |
| 10.4% | 11.3% | 11.3% | 12.2% | 12.7% | 13.4% |
| 7.7% | 8.5% | 8.9% | 8.6% | 8.3% | 8.0% |
| 2.6% | 3.0% | 3.3% | 3.6% | 3.7% | 4.2% |
| 4.4% | 5.4% | 6.4% | 7.4% | 7.4% | 8.2% |
| 4.8% | 5.3% | 5.4% | 5.2% | 4.4% | 4.4% |
| 6.2% | 6.4% | 6.0% | 6.1% | 6.1% | 6.8% |
| 8.1% | 8.7% | 8.8% | 9.5% | 10.1% | 11.5% |
| 6.9% | 6.7% | 7.0% | 7.1% | 7.2% | 6.9% |
| 1.3% | 1.5% | 1.5% | 1.4% | 1.3% | 1.3% |
| 7.3% | 7.5% | 7.6% | 7.9% | 8.6% | 8.6% |
| 59,756 | 60,492 | 62,787 | 69,149 | 81,051 | 84,519 |
Thus, to meet the requirements of the task order the committee summarized what is known about mental health treatment among children enrolled in Medicaid (Section 2) and assessed trends in treatment by modality and mental health diagnosis using the MAX data. As previously described in Chapter 2 and earlier in this chapter, the MAX data contain administrative claims data on individual Medicaid enrollees, including information on their basis of eligibility, diagnosis, service use, and payments. The MAX data thus include rates of diagnoses and rates of adjudicated claims for medication prescriptions filled and receipt of any type of psychotherapy (i.e., individual, group, or family). As a result, the types of medication and psychotherapy services that are paid on behalf of children enrolled in Medicaid with mental disorders can be tracked over time.
TABLE 18-6a ADHD Type, All Enrollees
| ADHD Type | 2001 | 2002 | 2003 | 2004 |
| ADHD with no other mental health/ developmental diagnosis | 1.9% | 2.0% | 2.2% | 2.4% |
| ADHD with one or more other mental health/developmental diagnosis | 1.2% | 1.2% | 1.4% | 1.5% |
| Proportion with one or more other mental health diagnoses | 38.2% | 37.8% | 38.4% | 37.8% |
| ADHD without externalizing disorder (CD/ODD) | 2.5% | 2.7% | 3.0% | 3.3% |
| ADHD with externalizing disorder (CD/ODD) | 0.5% | 0.5% | 0.6% | 0.6% |
| Proportion with externalizing disorder (CD/ODD) | 15.8% | 15.7% | 15.5% | 15.2% |
| N | 5,232,083 | 5,749,809 | 6,144,784 | 6,356,411 |
NOTE: Row groups are not all mutually exclusive, but each “with/without” pair is.
SOURCE: MAX data for 20 states: AK, AL, AR, CA, FL, ID, IL, IN, LA, MI, MS, MT, NC, ND, NH, NM, SD, VA, VT, WY.
Background Information on Treatment of Children with Mental Disorders on SSI and in Medicaid
Few studies describe the treatment of children with mental disorders who also receive SSI benefits. The available literature on the treatment of children on SSI has relied on MAX data and has generally concentrated on smaller populations by region, including the mid-Atlantic states, southwestern Pennsylvania, and New York State. Studies have also focused on treatment patterns for SSI recipients compared with enrollees in foster care, Temporary Assistance for Needy Families, and the State Children’s Health Insurance Program (DosReis, 2001; DosReis et al., 2011; Harman et al., 2000; Zito et al., 2005, 2013).
Treatment rates vary by Medicaid eligibility category. In one regional study, DosReis found that foster care–enrolled youths and SSI-recipient youths use significantly more mental health services than youths in other aid categories (DosReis, 2001). Some studies have focused on the trends in treatment rates among children on Medicaid. A 2013 regional cross-sectional study of Medicaid enrollees in the mid-Atlantic states found that the prevalence of antipsychotic use increased from 1997 to 2006 (Zito et al., 2013). Among children in poverty, rates of treatment often differ by both race and eligibility category (Zito et al., 2005).
| 2005 | 2006 | 2007 | 2008 | 2009 | 2010 |
| 2.6% | 2.5% | 2.7% | 2.9% | 3.1% | 3.1% |
| 1.6% | 1.8% | 1.9% | 2.1% | 2.3% | 2.4% |
| 38.7% | 41.2% | 41.6% | 42.2% | 42.7% | 43.3% |
| 3.5% | 3.6% | 3.8% | 4.1% | 4.4% | 4.5% |
| 0.7% | 0.8% | 0.8% | 0.9% | 1.0% | 1.0% |
| 15.7% | 17.5% | 18.1% | 18.4% | 18.6% | 18.3% |
| 6,658,353 | 6,630,423 | 6,593,490 | 6,899,748 | 7,545,081 | 8,208,507 |
Prior literature on the treatment of mental disorders for all children enrolled in Medicaid and the subset on SSI is predominantly regional, cross sectional, and focused almost exclusively on psychiatric drug prescriptions rather than other types of treatment. Across all prior studies, youths eligible for Medicaid through foster care or SSI have been found to have higher costs and rates of psychiatric drug prescriptions than those eligible solely based on income. Regional variations have been noted, but their cause and implications are uncertain.
Trends in ADHD Treatment Modalities from 2001 to 2010
Tables 18-8a and 18-8b summarize the treatment received by children with a diagnosis of ADHD among all Medicaid enrollees and among SSI Medicaid enrollees.
Among all Medicaid-enrolled children diagnosed with ADHD, most received some Medicaid-paid treatment for their condition, ranging from 87 percent in 2001 to 92 percent in 2010. These proportions were similar to those among children who were SSI Medicaid enrollees, which increased from 85 percent in 2001 to 92 percent in 2010. However, it should be noted that the absolute rates of treatment may be underestimated because
TABLE 18-6b ADHD Type, SSI/Disability Enrollees
| ADHD Type | 2001 | 2002 | 2003 | 2004 |
| ADHD with no other mental health/developmental diagnosis | 5.7% | 6.0% | 6.3% | 6.8% |
| ADHD with one or more other mental health/developmental diagnosis | 4.9% | 5.4% | 5.9% | 6.3% |
| Proportion with one or more other mental health diagnoses | 46.3% | 47.3% | 48.3% | 48.1% |
| ADHD without externalizing disorder (CD/ODD) | 8.6% | 9.1% | 9.8% | 10.5% |
| ADHD with externalizing disorder (CD/ODD) | 2.0% | 2.2% | 2.5% | 2.6% |
| Proportion with externalizing disorder (CD/ODD) | 19.2% | 19.8% | 20.3% | 19.7% |
| N | 361,106 | 376,196 | 395,718 | 407,703 |
NOTE: Row groups are not all mutually exclusive, but each “with/without” pair is.
SOURCE: MAX data for 20 states: AK, AL, AR, CA, FL, ID, IL, IN, LA, MI, MS, MT, NC, ND, NH, NM, SD, VA, VT, WY.
only children who were continuously enrolled in Medicaid were included and treatment provided in schools and foster care may not be captured in Medicaid claims. In addition, the direction of the selection bias may be mixed because SSI Medicaid enrollees may have greater clinical severity that could drive greater service utilization because functional impairment is part of SSI benefit eligibility criteria.
Treatment trends among SSI Medicaid enrollees were similar to those among all Medicaid enrollees. Overall, medication alone remained the most common treatment regimen over the decade, with approximately 50 percent of children diagnosed with ADHD receiving only medication treatment. Over time, however, there was a shift from medication-only treatment to combined treatment for both groups, indicating an increasing consistency with treatment guidelines. Among all Medicaid enrollees with ADHD, treatment with medication only decreased by 22 percent (from 65.2 to 53.2 percent), while combined treatment increased by 74 percent (from 18.5 to 32.1 percent). Among SSI Medicaid enrollees with ADHD, medication only treatment decreased by 35 percent (from 67.6 to 50.2 percent), while increase in combined treatment more than doubled (14.9 to 36.4 percent).
| 2005 | 2006 | 2007 | 2008 | 2009 | 2010 |
| 7.4% | 6.8% | 6.7% | 7.1% | 7.9% | 7.8% |
| 6.9% | 7.4% | 7.8% | 8.6% | 9.4% | 9.8% |
| 48.3% | 52.1% | 53.9% | 54.5% | 54.5% | 55.8% |
| 11.5% | 11.0% | 11.2% | 12.0% | 13.2% | 13.5% |
| 2.9% | 3.1% | 3.4% | 3.7% | 4.1% | 4.1% |
| 19.9% | 22.1% | 23.2% | 23.5% | 23.8% | 23.4% |
| 416,367 | 426,454 | 431,901 | 440,135 | 468,735 | 478,822 |
Treatment for SSI Children, by Mental Disorder, in 2010
Tables 18-9a and 18-9b summarize the treatment modalities received by mental disorder diagnosis among all Medicaid enrollees and SSI Medicaid enrollees in 2010. The rates of treatment varied by mental disorder among both groups.
Children with a diagnosis of either bipolar or ADHD were the most likely to receive any treatment. Among all Medicaid enrollees the rate of receipt of paid treatment for bipolar and ADHD was 95.4 and 93.1 percent, respectively; among SSI Medicaid enrollees the rate was even higher, at 96.9 percent for bipolar and 94.6 percent for ADHD. Among all Medicaid enrollees, the percentages of children receiving any treatment for depression, anxiety disorders, and ASD were 78.2, 73.8, and 71.2 percent, respectively. Among SSI Medicaid enrollees, the percentage of children with these disorders who received any treatment was 89.7, 84.7, and 69.2 percent.
Although few children with bipolar disorder were untreated, the proportion of children who received the recommended (reference) treatment among all Medicaid enrollees and SSI Medicaid enrollees in 2010 ranged,
TABLE 18-7 MAX Diagnoses by Race/Ethnicity, SSI Medicaid Enrollees, 2010
| Diagnosis | White | Black/African American | Am. Indian/Alaskan Native | Asian | Hispanic/Latino | More Than 1/Unknown |
| ADHD | 23.3% | 18.8% | 18.4% | 4.5% | 10.3% | 15.7% |
| Conduct disorder | 5.2% | 5.1% | 4.3% | 2.1% | 3.7% | 4.1% |
| Emotional disturbances | 6.9% | 6.6% | 7.6% | 1.0% | 3.2% | 4.1% |
| Oppositional defiant disorder | 5.6% | 5.8% | 5.7% | 0.7% | 2.2% | 3.3% |
| Depression | 8.0% | 5.5% | 8.1% | 1.9% | 5.2% | 3.9% |
| Bipolar disorders | 5.6% | 2.2% | 3.4% | 0.7% | 1.9% | 1.9% |
| Anxiety disorders | 3.5% | 1.3% | 2.8% | 1.0% | 2.1% | 1.7% |
| Autism spectrum disorders | 12.5% | 3.7% | 5.1% | 11.0% | 6.0% | 5.8% |
| Intellectual disorders | 10.6% | 3.8% | 3.5% | 25.9% | 11.6% | 3.9% |
| Learning disorders | 8.5% | 5.5% | 10.4% | 5.3% | 5.5% | 7.3% |
| Speech and language disorders | 14.6% | 9.0% | 17.1% | 10.9% | 8.4% | 14.0% |
| Hearing disorders | 11.4% | 4.8% | 10.6% | 7.4% | 10.1% | 9.7% |
| Cerebral palsy | 8.6% | 3.3% | 5.1% | 12.8% | 9.1% | 4.9% |
| Asthma | 6.3% | 9.2% | 8.5% | 4.2% | 7.4% | 8.1% |
| N | 104,116 | 152,011 | 5,320 | 3,635 | 49,189 | 161,876 |
TABLE 18-8a ADHD Treatment Among All Medicaid Enrollees with a Diagnosis of ADHD, 2001–2010
| Treatment Status | 2001 | 2002 | 2003 | 2004 | 2005 | 2006 | 2007 | 2008 | 2009 | 2010 |
| Not treated | 13.1% | 12.2% | 10.3% | 8.5% | 9.9% | 10.0% | 9.8% | 9.3% | 8.8% | 8.0% |
| Treated with medication only | 65.2% | 66.8% | 60.9% | 52.6% | 53.2% | 52.5% | 51.7% | 51.8% | 52.4% | 53.2% |
| Treated with psychotherapy only | 3.2% | 2.9% | 4.6% | 6.1% | 6.2% | 7.0% | 7.2% | 7.2% | 7.0% | 6.7% |
| Treated with both medication and psychotherapy | 18.5% | 18.1% | 24.2% | 32.8% | 30.8% | 30.6% | 31.4% | 31.7% | 31.8% | 32.1% |
| N (# of children among all Medicaid enrollees with an ADHD diagnosis) | 157,867 | 181,400 | 217,970 | 248,157 | 280,223 | 286,997 | 306,834 | 349,037 | 405,795 | 448,796 |
TABLE 18-8b ADHD Treatment Among SSI Medicaid Enrollees with a Diagnosis of ADHD, 2001–2010
| Treatment Status | 2001 | 2002 | 2003 | 2004 | 2005 | 2006 | 2007 | 2008 | 2009 | 2010 |
| Not treated | 15.3% | 14.6% | 12.6% | 11.0% | 11.5% | 10.2% | 9.5% | 9.3% | 8.6% | 7.6% |
| Treated with medication only | 67.6% | 68.4% | 60.2% | 49.6% | 50.7% | 50.5% | 48.6% | 48.0% | 50.1% | 50.2% |
| Treated with psychotherapy only | 2.2% | 1.9% | 3.6% | 5.0% | 5.2% | 6.1% | 6.6% | 6.9% | 6.0% | 8.2% |
| Treated with both medication and psychotherapy | 14.9% | 15.1% | 23.6% | 34.4% | 32.6% | 33.1% | 35.3% | 35.8% | 35.3% | 36.4% |
| N (# of children among SSI Medicaid enrollees with an ADHD diagnosis) | 38,466 | 42,603 | 48,485 | 53,357 | 59,756 | 60,492 | 62,787 | 69,149 | 81,051 | 84,519 |
TABLE 18-9a Mental Health Treatment Among All Medicaid Enrollees with One or More Mental Health Diagnoses in 2010
| Diagnosis | Not Treated | Treated with Medication Only | Treated with Psychotherapy Only | Treated with Both Medication and Psychotherapy |
| ADHD | 6.9% | 54.3% | 5.2% | 33.6% |
| Conduct disorder | 27.4% | 21.7% | 18.2% | 32.7% |
| Emotional disturbances | 22.8% | 19.6% | 19.1% | 38.4% |
| Oppositional defiant disorder | 20.6% | 19.9% | 18.4% | 41.1% |
| Depression | 21.8% | 25.2% | 14.1% | 38.9% |
| Bipolar disorders | 4.6% | 35.4% | 4.2% | 55.8% |
| Anxiety disorders | 26.2% | 15.3% | 29.5% | 29.0% |
| Autism spectrum disorders | 28.8% | 31.7% | 12.0% | 27.5% |
| Intellectual disorders | 42.0% | 35.3% | 7.3% | 15.3% |
| Learning disorders | 49.9% | 19.2% | 17.2% | 13.8% |
| Any of the abovea | 24.3% | 36.6% | 13.9% | 25.3% |
| Speech and language disorders | 70.4% | 15.1% | 7.0% | 7.5% |
| Hearing disorders | 84.4% | 8.3% | 3.7% | 3.7% |
aAny of the above means a child with any one of the diagnoses, including if the child had comorbid diagnoses. A child with multiple co-occurring diagnoses would still be counted only once for this estimate of prevalence.
respectively, from 55.8 to 54.7 percent. Only slightly more than one-half of children received at least one visit for psychotherapy in any format (individual, family, group) and had at least one psychotropic medication prescription filled during the study year. A similar prevalence of combined therapies is noted for other behavioral disorders. The reasons for the gap between indicated and delivered care fall outside the scope of this study.
Limitations
The Medicaid Study treatment findings have several limitations. Medicaid claims data provide no information on the quality of the mental health care received. Appropriate use of medication cannot be determined
TABLE 18-9b Mental Health Treatment Among SSI Medicaid Enrollees with One or More Mental Health Diagnoses in 2010
| Diagnosis | Not Treated | Treated with Medication Only | Treated with Psychotherapy Only | Treated with Both Medication and Psychotherapy |
| ADHD | 5.4% | 52.3% | 3.6% | 38.6% |
| Conduct disorder | 16.1% | 33.4% | 8.9% | 41.7% |
| Emotional disturbances | 13.1% | 26.3% | 10.3% | 50.3% |
| Oppositional defiant disorder | 10.7% | 26.0% | 9.4% | 54.0% |
| Depression | 10.3% | 33.5% | 6.5% | 49.8% |
| Bipolar disorders | 3.1% | 40.3% | 1.9% | 54.7% |
| Anxiety disorders | 15.3% | 26.4% | 14.5% | 43.9% |
| Autism spectrum disorders | 30.8% | 38.1% | 7.2% | 23.9% |
| Intellectual disorders | 43.9% | 39.1% | 4.4% | 12.6% |
| Learning disorders | 45.9% | 29.7% | 10.0% | 14.5% |
| Any of the abovea | 25.3% | 41.5% | 6.9% | 26.3% |
| Speech and language disorders | 56.7% | 25.9% | 6.2% | 11.3% |
| Hearing disorders | 61.8% | 24.3% | 4.6% | 9.3% |
aAny of the above means a child with any one of the diagnoses, including if the child had comorbid diagnoses. A child with multiple co-occurring diagnoses would still be counted only once for this estimate of prevalence.
because there is no information available on child clinical need for psychotropic medication. The use of evidence-based psychotherapies cannot be determined because Medicaid procedure codes do not specify the types of psychological services, such as parent training for ADHD.
The receipt of behavioral or educational interventions also may be under-reported because children with mental health conditions may receive services through special education programs or state-funded programs for persons with disabilities. Services that are not paid for by Medicaid could account for the low rates of treatment observed among children with intellectual and learning disorders. Psychotherapy may also be under-reported among children receiving mental health care in a primary care setting because priority may be placed on billing for other procedure codes (Zima
et al., 2010). In short, the Medicaid study cannot provide any information about children who do not receive Medicaid-paid treatment.
As noted earlier, the Medicaid data do not allow a direct linkage of treatment use with a specific diagnosis in cases of enrollees who have multiple co-occurring mental disorder diagnoses. For example, an enrollee with co-occurring ASD and depression may receive antidepressant medication; however, the data will show reimbursement for medication treatment for both the ASD and depression diagnoses. As a result, the ASD diagnoses would be associated with medication treatment, although the treatment would be for the comorbid depression.
Finally, the Medicaid study and our other data sources cannot address the questions of whether parents seek services to increase the likelihood that their child’s SSI application will be approved or whether treatment status affects adjudication eligibility.
CONCLUSIONS
- The number of ADHD diagnoses among all Medicaid enrollees in the study nearly tripled during the decade of our inquiry. Increases in SSI benefits for ADHD during this decade are therefore expected in view of this growth rate in the Medicaid population of children who have received paid Medicaid services.
- Child Medicaid enrollment increased from 2001 to 2010. The growing numbers of all Medicaid enrollees during the study period likely reflect increases in childhood poverty as well as policies that encouraged the enrollment of eligible children in Medicaid.
FINDINGS
- The percentage of all Medicaid enrollees with a mental disorder diagnosis increased from 7.9 percent in 2001 to 11.1 percent in 2010, a growth rate similar to the increase observed for asthma diagnoses. The percentage of SSI Medicaid enrollees with a mental disorder diagnosis increased from 29.2 percent in 2001 to 38.6 percent in 2010.
- There are high rates of co-occurring mental disorder diagnoses among children enrolled in Medicaid. The frequency of co-occurring mental diagnoses among disabled children enrolled in Medicaid is higher than the frequency of co-occurring mental disorder diagnoses in all children enrolled in Medicaid.
- The rates of treatment with medication, psychotherapy, or combinations of the two varied depending on the specific mental disorder diagnosis.
- All Medicaid enrollees with ADHD experienced increased rates of treatment with medications, psychotherapy, or a combination of the two. This increase suggests improving adherence to guidelines by providers serving the Medicaid population.
- The number of SSI Medicaid enrollees with ADHD with no recorded paid claims for treatment declined by almost 50 percent during the period, consistent with the other indicators of increased frequency of treatment.
- Combination therapy for mental disorders was used with increasing frequency from 2001 to 2010, but was documented in only about a quarter of the total mental disorder diagnoses by 2010.
REFERENCES
Byrd, V. L. H., and A. H. Dodd. 2012. Accessing the usability of encounter data for enrollees in comprehensive managed care across MAX 2007–2009. Mathematica Policy Research Medicaid Policy Brief No. 15. www.cms.gov/Research-Statistics-Data-and-Systems/Computer-Data-and-Systems/MedicaidDataSourcesGenInfo/Downloads/MAX_IB_15_AssessingUsability.pdf (accessed July 18, 2015).
DosReis, S. C. 2001. Mental health services for youths in foster care and disabled youths. American Journal of Public Health 91(7):1094–1099.
DosReis, S., Y. Yoon, D. M. Rubin, M. A. Riddle, E. Noll, and A. Rothbard. 2011. Antipsychotic treatment among youth in foster care. Pediatrics 128(6):1459–1466.
Halfon, N., A. Houtrow, K. Larson, and P. W. Newacheck. 2012. The changing landscape of disability in childhood. The Future of Children 22(1):13–42.
Harman, J. S., G. E. Childs, and K. J. Kelleher. 2000. Mental health care utilization and expenditures by children in foster care. Archives of Pediatric and Adolescent Medicine 154(11):1114–1117.
HHS (U.S. Department of Health and Human Services). 2001. Mental health: Culture, race, and ethnicity—A supplement to mental health: A report to the surgeon general. Rockville, MD: U.S. Department of Health and Human Services, Substance Abuse and Mental Health Services Administration, Center for Mental Health Services.
HHS. 2010. Connecting kids to coverage: Continuing the progress. 2010 CHIPRA annual report. http://www.insurekidsnow.gov/professionals/reports/chipra/2010_annual.pdf (accessed July 18, 2015).
IOM (Institute of Medicine). 2009. Race, ethnicity, and language data: Standardization for health care quality improvement. Washington, DC: The National Academies Press.
Nysenbaum, J., E. Bouchery, and R. Malsberger. 2012. The availability and usability of behavioral health organization encounter data in MAX 2009. Mathematica Policy Research Medicaid Policy Brief No. 14. www.mathematica-mpr.com/~/media/publications/PDFs/health/MAX_IB14.pdf (accessed July 18, 2015).
Perrin, J. M., K. Kuhlthau, S. L. Ettner, T. J. McLaughlin, and S. T. Gortmaker. 1998. Previous Medicaid status of children newly enrolled in Supplemental Security Income. Health Care Financing Review 19(4):117.
Perrin, J. M., K. Kuhlthau, T. J. McLaughlin, S. L. Ettner, and S. L. Gortmaker. 1999. Changing patterns of conditions among children receiving Supplemental Security Income disability benefits. Archives of Pediatrics and Adolescent Medicine 153(1):80–84.
Van Cleave, J., S. L. Gortmaker, and J. M. Perrin. 2010. Dynamics of obesity and chronic health conditions among children and youth. JAMA 303(7):623–630.
Zima, B. T., R. Bussing, L. Tang, L. Zhang, S. Ettner, T. R. Belin, and K. B. Wells. 2010. Quality of care for childhood attention-deficit/hyperactivity disorder in a managed care Medicaid program. Journal of the American Academy of Child &Adolescent Psychiatry 49(12):1225–1237.
Zito, J. M., D. J. Safer, I. H. Zuckerman, J. F. Gardner, and K. Soeken. 2005. Effect of Medicaid eligibility category on racial disparities in the use of psychotropic medications among youths. Psychiatric Services 56(2):157–163.
Zito, J. M., M. Burcu, A. Ibe, D. J. Safer, and L. S. Magder. 2013. Antipsychotic use by Medicaid-insured youths: Impact of eligibility and psychiatric diagnosis across a decade. Psychiatric Services 64(3):223–229.
This page intentionally left blank.


