
4
State Variation in the SSI Program for Children
There are substantial interstate variations in the Supplemental Security Income (SSI) program for children with mental disorders. These variations from state to state have not been closely studied and are not well understood; however, they are important because these variations mean that the probability of applying for and receiving disability benefits for a child with disabilities may differ depending on the state in which he or she lives. Furthermore, analysis of aggregate trends at the national level may obscure different trends at the state level. State-level analysis is necessary to determine whether the national trends are representative of all states, or whether trends in individual states have different trends with potentially different causes. This chapter reviews the state variation in the rates of reported mental health disorders; the variation in the numbers of determinations, in the numbers of recipients, and in the allowance rates across states in 2013; and the changes in the number of determinations between states from 2004 to 2013.
STATE VARIATION IN THE RATES OF REPORTED MENTAL HEALTH DISORDERS
Some studies have shown substantial state-to-state variations in the rates of reported mental health disorders among children and adolescents. The Mental and Emotional Well-Being of Children, a publication of the Maternal and Child Health Bureau (2010), detailed substantial variations in the presence of mental health conditions by state, ranging from a prevalence of 8.1 percent in Hawaii to 16.0 percent in North Carolina.
Ghandour and colleagues used the 2007 National Survey of Children’s Health and found that almost 8 percent of all children ages 6 to 17 years had had a diagnosis of depression or anxiety and 5.4 percent a behavior or conduct disorder (Ghandour et al., 2012). The study found wide state-to-state variations in these diagnoses, with about a threefold difference between highest and lowest reported rates (Ghandour et al., 2012). For example, depression/anxiety rates varied from 4.8 percent in Georgia to 14.4 percent in Vermont (Ghandour et al., 2012). This study also found higher rates of reported diagnoses among children in lower-income households and among children reported as having poor or fair health (Ghandour et al., 2012). In an older study of state-to-state variation in rates of attention deficit hyperactivity disorder (ADHD), children were more likely to have the diagnosis if they lived in the South than in the West (Fulton et al., 2009). Additionally, medication use varied between states (Fulton et al., 2009). This study found that the number of physicians in a state was associated with both diagnostic rates and medication prescriptions, but educational policies were not associated with either (Fulton et al., 2009). A more recent study by the Centers for Disease Control and Prevention found significant variations in the diagnosis of and medication use by children for ADHD by state (Visser et al., 2013). Nationally in 2007, 7.2 percent of children were diagnosed with ADHD; Nevada had the lowest prevalence (3.7 percent), and North Carolina had the highest prevalence (12.8 percent) (Visser et al., 2013). This study also found that 66 percent of children with ADHD were treated with medication, but the state-based rates varied from a low of 33 percent to a high of 79 percent (Visser et al., 2013).
State-to-state variations in reported prevalence exist for all types of health conditions as well as for overall child health status. Nationwide, 84.2 percent of children are in excellent or very good health, but only 77.6 percent of California’s children are, compared with 91.7 percent of children in South Dakota (NSCH, 2012a). Among children with special health care needs with functional limitations, the degree to which children are affected varies by state. The District of Columbia has the lowest reported percentage of severely affected children (52.5 percent) and New York has the highest (78.0) (NSCH, 2012b). The causes of the state variations in the prevalence of reported health conditions are likely to be multifactorial and could explain some of the variations in SSI findings concerning children’s mental health conditions. One important factor is the rate of poverty in each state since child health in general and child mental health in particular both track with poverty.
STATE-TO-STATE VARIATION IN 2013
Number of Determinations and Allowances
In fiscal year (FY) 2013, disability determination services (DDSs) made more than 225,000 initial determinations involving the 10 mental impairments addressed by this report. By state, the number of initial determinations ranged from 153 in Wyoming to 26,513 in Texas (see Figure 4-1).
A few DDSs adjudicated most of the initial determinations in FY 2013. The Texas DDS, for example, performed more than 10 percent of the national total (see Figure 4-1). Eight states—California, Florida, Georgia, Michigan, New York, Ohio, Pennsylvania, and Texas—accounted for just more than half (50.6 percent).
The raw number of determinations and allowances will naturally vary between states because of differences in the populations of children in low-income households in each state. However, even after controlling for the number of children in low-income households within each state, in FY 2013 the rate of SSI child initial determinations from a state’s population of children in low-income households varied significantly. Using children under 18 in families with income less than 200 percent of the federal poverty level (FPL) as a proxy for the number of children who are income- and asset-eligible for SSI, the rate of claims for the 10 mental impairments varied by a factor of 5.7, from a low of 252 per 100,000 in Nevada to a high of 1,441 per 100,000 in Pennsylvania (see Figure 4-2). As can be seen within Figure 4-2, the ratio of allowances to denials varies from state to state as well. This variation in the ratio of allowances to determinations is addressed in additional detail below. Figure 4-3 shows the variation in the rate of determinations among children in low-income households geographically. There appears to be a gradient in the rates of determinations in children in low-income households, with the rates of determinations in Western states lower than those in Eastern states.
It is useful to compare the raw numbers of determinations by state with the rate of determinations within children in low-income households by state. In particular, some states with high numbers of determinations appear to actually be evaluating a smaller proportion of the state’s children in low-income households for disabilities than are evaluated in other states. For example, consider Texas, which in 2013 had the highest number of determinations and number of allowances. After adjusting the numbers of determinations and allowances for the estimated number of children in low-income households in the state, Texas is actually the 21st highest state. The disparate rates of determinations within state-specific populations of children in low-income households indicate that across the United States,
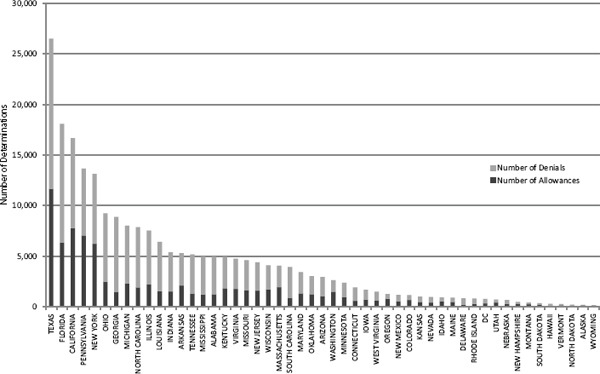
FIGURE 4-1 Number of determinations, broken down by allowances and denials, for 10 selected mental disorders, per state, for 2013.
SOURCE: Unpublished data set provided by the SSA.
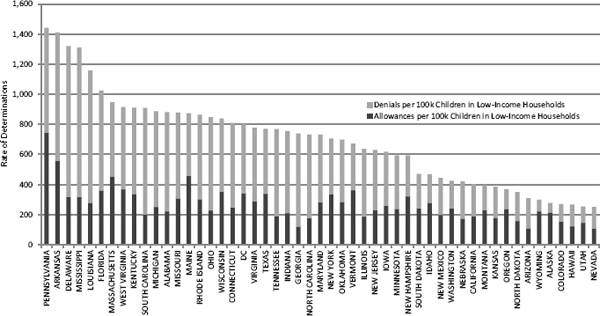
FIGURE 4-2 Rates of SSI child initial determinations for 10 select mental impairments, by state: fiscal year 2013 (per 100,000 children in families with income less than 200 percent of the federal poverty level).
NOTE: The Current Population Survey table creator was used to generate numbers of children below 200 percent of the federal poverty level. Parameters used to generate the numbers include get count: of persons in poverty universe (everyone except unrelated individuals under 15) from years 2004 to 2013; Census 2010 weights; row variable: age; column variable: income-to-poverty ratio; and customized formatting: income-to-poverty ratio percent cutoff of 200 percent.
SOURCES: U.S. Census Bureau, 2015; unpublished data set provided by the SSA.
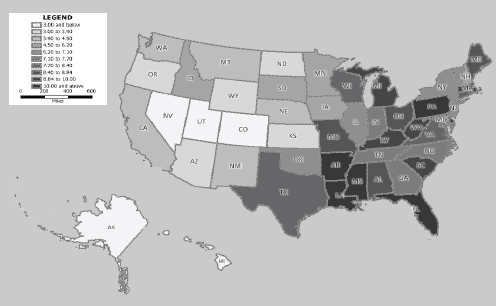
FIGURE 4-3 Rates of the SSI child initial determinations for 10 select mental impairments, by state: fiscal year 2013 (per 100,000 children in families with income less than 200 percent of the federal poverty level).
SOURCES: U.S. Census Bureau, 2015; unpublished data set provided by the SSA.
some children in low-income households are far more likely to be determined for disability benefits than others.
Differences in Allowance Rates
There is substantial variation in initial allowance rates from state to state, i.e., in the percentage of determinations in which the applicant is found to be disabled. In 2013, for example, the combined initial allowance rate for child SSI claims with the 10 selected mental impairments ranged from 16 percent in Georgia to 78 percent in Alaska. Nationally, the initial allowance rate averaged 37 percent, but it was more than 50 percent in 13 states and less than 25 percent in 7 states (see Figure 4-4).
The reasons for the wide differences in allowance rates from DDS to DDS are not fully understood. According to an SSA analysis of 1990s program data for the SSI adult claimants, about half the variation in the allowance rate from the national mean could be explained by factors external to the SSA, including application rates, economic factors such as the poverty rate, disability prevalence rates, demographic factors, and health indicators such as insurance coverage (Strand, 2002). No similar study has
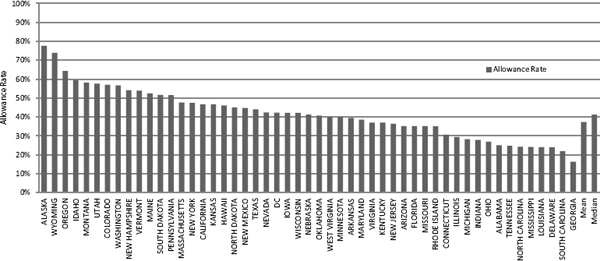
FIGURE 4-4 Child SSI initial allowance rate for 10 selected mental impairments, by disability determination service: fiscal year 2013 (percentage).
SOURCE: Unpublished data set provided by the SSA.
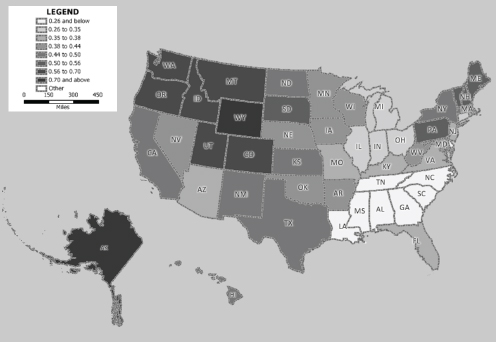
FIGURE 4-5 Child SSI initial allowance rate for 10 selected mental impairments, by disability determination service: fiscal year 2013 (percentage).
SOURCE: Unpublished data set provided by the SSA.
been done of the SSI child allowance rates. As illustrated by Figure 4-5, another potential factor could be related to geography: A cluster of states with low determination rates appears in the Southeast, and states with high allowance rates appear to cluster in the Northwest and West.
Recipients
There are also significant variations in the percentage of children who receive SSI benefits for the 10 selected mental disorders between states. In 2013, 0.7 percent of children in low-income households in Hawaii were recipients of such benefits, while 5.3 percent of children in low-income households in Pennsylvania were, a percentage that was approximately 7.6 times as great as the percentage in Hawaii (see Figure 4-6). Because recipients are the children who cumulatively have been allowed and remain currently eligible for benefits, the percentage of poor children who are recipients within a state can serve as an indication of the coverage of the SSI program for children with mental disorders in that state. The variation in the rates of poor children who are recipients for SSI benefits for the selected mental disorders strongly suggests that there are state-specific DDS differences
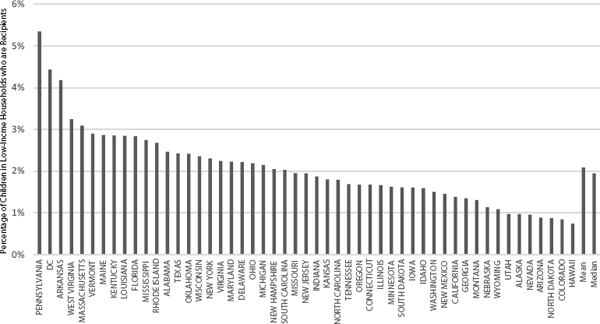
FIGURE 4-6 Percentages of children in low-income households in each state who are recipients of SSI benefits for the 10 selected mental disorders.
SOURCE: Unpublished data set provided by the SSA.
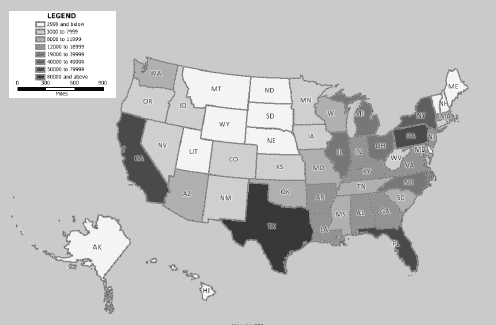
FIGURE 4-7 Numbers of recipients for the 10 selected mental disorders in 2013, by state.
SOURCE: Unpublished data set provided by the SSA.
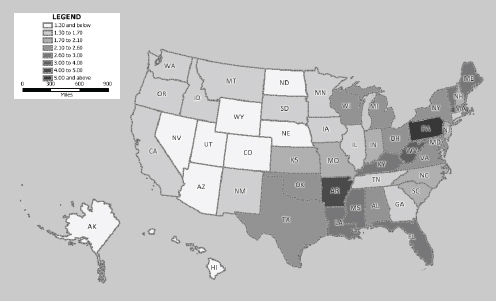
FIGURE 4-8 Percentages of children in low-income households who are recipients of SSI benefits for the selected mental disorders, by state, for 2013.
SOURCES: U.S. Census Bureau, 2015; unpublished data set provided by the SSA.
influencing the likelihood that a potentially eligible child with a mental disorder will receive SSI benefits. This is further illustrated by Figures 4-7 and 4-8. Figure 4-7 shows the number of under-18 SSI recipients for the 10 selected mental disorders in 2013; Figure 4-8 shows the rate of recipients for the selected mental disorders in families that are under 200 percent of the FPL. A significant difference is observed for California, which has a high raw number of recipients but a low rate of recipients among children in low-income households. In contrast, Arkansas has a relatively low number of recipients but a high percentage of children in low-income households who are recipients. Pennsylvania appears to be an outlier in having both high numbers of recipients and high rates of recipients among children in low-income households.
CHANGE IN STATE-SPECIFIC DETERMINATION RATES IN CHILDREN IN LOW-INCOME HOUSEHOLDS BETWEEN 2004 AND 2013
For the nation as a whole, the average rate of determinations in children in low-income households decreased 2 percent from 2004 to 2013; however, this national level statistic obscures state variations in the specific rate of determinations. For example, between FY 2004 and FY 2013, the rate of determinations in Rhode Island increased by 48 percent, from 584 per 100,000 to 864 per 100,000. Other states with substantially higher determination rates in 2013 than in 2004 included Utah and Texas (32 percent) and Connecticut (31 percent) (see Figure 4-9). In other states, the determination rate decreased substantially between FY 2004 and FY 2013. In Minnesota, North Dakota, Kansas, and Nevada, the rate decreased by one-third or more from 2004 to 2013. These changes in the number of determinations between states also indicate that there are changes occurring within states over time that result in either increasing or decreasing rates of determinations for disabilities caused by the selected mental disorders in children.
SUMMARY OF STATE VARIATIONS IN 2013
The state-to-state variation in the numbers and rates of children being determined for, being allowed, and receiving SSI disability benefits for the selected mental disorders is a significant and concerning observation. A number of factors could contribute to these disparities, including state-to-state variation in the rates of disability caused by the selected mental disorders; however, the degree of between-state variation observed in the SSI program cannot be reasonably explained solely, or even in substantial part, by a variation in the rates of disabilities and mental disorders between
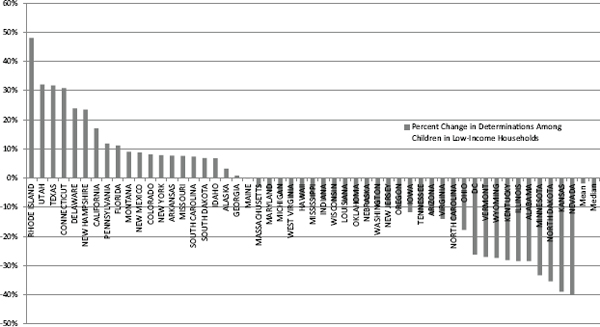
FIGURE 4-9 Percent change in rate of determinations among children in households below 200 percent of the federal poverty level, by state, from 2004 to 2013.
NOTE: The Current Population Survey table creator was used to generate numbers of children below 200 percent of the federal poverty level. Parameters used to generate the numbers include get count of: persons in poverty universe (everyone except unrelated individuals under 15); years: 2004 to 2013; Census 2010 weights; row variable: age; column variable: income-to-poverty ratio; and customized formatting: income-to-poverty ratio percent cutoff of 200 percent.
SOURCES: U.S. Census Bureau, 2015; unpublished data set provided by the SSA.
states. State-specific variations in the population of children in low-income households may contribute to disparities observed in the SSI program; however, those variations have been controlled for in the preceding analyses, and they cannot reasonably be thought to be the cause of the magnitude of variation observed. After controlling for changes in the state-specific populations of children in low-income households, there is still significant state-to-state variation.
A recent analysis from the Office of the Assistant Secretary for Planning and Evaluation (ASPE) at the Department of Health and Human Services examined geographic variation in the child SSI program growth and participation between 2008 and 2013 and confirmed this variation (Wittenburg et al., 2015). The analysis looked at the ratio of child SSI caseloads to number of children by state and found that regional, state, and local factors play a crucial part in the geographic variation in program growth during this period (Wittenburg et al., 2015). Notably, Pennsylvania and Texas experienced substantial state-level growth between 1998 and 2013, and these two states along with Florida and California account for half of the aggregate child SSI caseload increase (Wittenburg et al., 2015). According to ASPE, possible significant factors that lead to state variation include the following:
- Advocacy groups, program administrators, and policy officials vary in outreach levels to eligible children.
- Differences in state economies and in policy and program environments affect the opportunities of youth and their parents to obtain public assistance, employment, and education.
- The demographic and income characteristics of youth vary by state.
- DDSs must follow federal policy in eligibility determinations, but they have flexibility in DDS review process management, the compensation and hiring of disability examiners, and the use of private contractors.
Overall, however, there was not a single state or local trend or a singular demographic, economic, or other factor that explained the variations (Wittenburg et al., 2015).
It is the committee’s consensus that state-to-state variation cannot be solely or substantially attributed to variation in the rates of mental disorders among states. Other factors that likely contribute to the observed variation include state-specific benefit policies and state-specific approaches to the implementation of public benefit programs, such as substituting SSI benefits (which are federal dollars) for Temporary Assistance for Needy Families benefits (which use state dollars). State-specific changes over time reinforce a conclusion that state program management is a variable and fluid factor in SSI benefits access and assignment. However, an analysis and
discussion of these factors is outside the scope of this committee’s task, and the factors will not be discussed further in this report.
FINDING
- There is considerable state-to-state variation in the rates of children allowed SSI disability benefits for mental disorders. There is also variation in the rates of children who are recipients of SSI for mental disorders.
CONCLUSION
- Variation among states indicates that the likelihood of a child with a disability becoming a recipient of SSI varies depending on the state of residence. Although studies have shown state variations in prevalence rates for children’s mental health disorders, these prevalence variations cannot fully explain differences in state allowances or recipients.
REFERENCES
Fulton, B. D., R. M. Scheffler, S. P. Hinshaw, P. Levine, S. Stone, T. T. Brown, and S. Modrek. 2009. National variation of ADHD diagnostic prevalence and medication use: Health care providers and education policies. Psychiatric Services 60(8):1075–1083.
Ghandour, R. M., M. D. Kogan, S. J. Blumberg, J. R. Jones, and J. M. Perrin. 2012. Mental health conditions among school-aged children: Geographic and sociodemographic patterns in prevalence and treatment. Journal of Developmental and Behavioral Pediatrics 33(1):42–54.
Maternal and Child Health Bureau. 2010. The mental and emotional well-being of children: A portrait of states and the nation, 2007. Rockville, MD: U.S. Department of Health and Human Services, Health Resources and Services Administration, Maternal and Child Health Bureau.
NSCH (National Survey of Children’s Health). 2012a. National Survey of Children’s Health 2011/12. Data query from the Child and Adolescent Health Measurement Initiative. www.childhealthdata.org (accessed April 14, 2015).
NSCH. 2012b. National Survey of Children with Special Health Care Needs 2009/10. Data query from the Child and Adolescent Health Measurement Initiative. www.childhealthdata.org (accessed April 14, 2015).
Strand, A. 2002. Social Security disability programs: Assessing the variation in allowance rates. www.ssa.gov/policy/docs/workingpapers/wp98.html (accessed June 30, 2015).
U.S. Census Bureau. 2015. CPS table creator. www.census.gov/cps/data/cpstablecreator.html (accessed July 13, 2015).
Visser, S. N., S. J. Blumberg, M. L. Danielson, R. H. Bitsko, and M. D. Kogan. 2013. State-based and demographic variation in parent-reported medication rates for attention-deficit/hyperactivity disorder, 2007–2008. Preventing Chronic Disease 10:20073.
Wittenburg, D., J. Tambornino, E. Brown, G. Rowe, M. DeCamillis, and G. Crouse. 2015. ASPE research brief: The child SSI program and the changing safety net. http://aspe.hhs.gov/hsp/15/ChildSSInet/rb_ChildSSInet.pdf (accessed April 21, 2015).


