
5
Poverty and Childhood Disability
One requirement of the task order for this committee was to compare trends in the prevalence of mental disorders in the population of children who receive disability benefits with trends in the prevalence of mental disorders in the general U.S. population, aged 0 through 17 years. This task is complicated by the facts that both poverty and having a disability are eligibility criteria for disability benefits, while the majority of children in the general population comparison group neither live in poverty nor have a disability. In addition, disability is generally more common among children living in poverty than among those not living in poverty. Therefore, in addition to comparing trends in the prevalence of mental disorders among those receiving SSI benefits to trends of these disorders in the general child population, this chapter and the remainder of the report present trends in the prevalence of mental disorders that take into account the population of children who are living in poverty. Parts III and IV of this report present trends in an additional comparison group that is socioeconomically more comparable to the Supplemental Security Income (SSI) population, namely, children receiving Medicaid benefits.
An additional caveat in comparing populations stems from the fact that information on trends in the frequency of mental disorders among children in the general population is dependent on engagement of affected children with the health care system or on parent recall of relevant diagnostic information and reporting of that information in surveys. It is known that various disparities in health care access exist, and such disparities may cause some subpopulations of youth with mental disorders to be misrepresented by general surveys or analyses of medical or other service system data.
Furthermore, parental reports may not accurately capture the disability associated with mental health diagnoses. Therefore, while some information on the prevalence of mental health conditions is available from numerous studies, information on the functional impact of these conditions on children who are affected is not. In contrast, the data for monitoring trends in mental disorder prevalence in SSI beneficiaries is dependent on selection criteria for eligibility, specifically, poverty and disability. The large majority of SSI recipients live in families that are “poor,” that is, with a family income less than 200 percent of the federal poverty level (FPL). Families under 200 percent FPL represent more than 40 percent of the general population (DeNavas-Walt and Proctor, 2014). Furthermore, the number of families with incomes less than 200 percent of the FPL is not static. As economic conditions deteriorate, more families join the ranks of those with incomes at or below a defined poverty level. This most recently occurred following the 2008–2009 “Great Recession,” or economic downturn, in the United States. As a result, more children with disability owing to mental disorders would have met the poverty criterion for SSI benefits. This means that an increase in the percentage of children with mental health disorders on SSI may not reflect an increase of mental health disorders, but may instead arise from an increased percentage of children with these disorders meeting the poverty threshold for SSI eligibility.
Differences between the general population and the population of children receiving SSI or Medicaid benefits are further compounded by the facts that poverty itself is a risk factor for mental disorders in children and that functional impairment is more severe for children diagnosed with a mental disorder who live in poverty than for those diagnosed with such a disorder who do not (see the section in this chapter on the interactions of poverty and disability) (Parish and Cloud, 2006). Furthermore, the presence of a child with disability is itself a risk factor for family poverty (Wolfe and Hill, 1995).
Thus, it is difficult to make direct comparisons of prevalence trends between all children in the general population with a mental disorder and children with a mental disorder in the SSI or Medicaid beneficiary population, and data presented in this report must be interpreted with this in mind. In subsequent sections of this report the committee has attempted to mitigate population differences by using the number of children in households under 200 percent FPL each year as a proxy for the SSI income-eligible population of children. In response to the task order, this report focuses on comparisons of the trends in the prevalence of mental disorders over time, rather than on differences in prevalence among the populations.
CHILDHOOD POVERTY
Rates of poverty among children can be measured—and the year-to-year trends in those rates determined—using objective standards established by the government. The most common measure of poverty being used in the United States is whether a child lives in a household whose income is below an absolute poverty level (the FPL). This poverty measure has been calculated in nearly the same way since the mid-1960s. The level is based on the cost of a minimum food diet multiplied by a factor of 3 to allow for all other family expenditures. In 2013, the poverty threshold for a family of three with two children was $18,769, and for a family of four with two children it was $23,624 (DeNavas-Walt and Proctor, 2014). Official national figures on poverty are based on the Annual Social and Economic Supplement to the Current Population Survey. Table 5-1 presents the absolute number of children under age 18 in poverty and the percentage of children who were below the FPL annually from 2004 to 2013. The pattern shows that the percent of children in poverty increased after 2006, peaked in 2010, and declined afterward, although by 2013 it was still well above the 2006 level.
In addition, another 5.7 percent of children were living near poverty (100 to 125 percent of the FPL) in 2012 (Hokayem and Heggeness, 2014).
Other sources provide similar estimates. For example, the American Community Survey provides a higher estimate for the percentage of children living in poverty—22.2 percent in 2013—but this is not the official measure. In addition, the National Center for Children in Poverty tracks the
TABLE 5-1 U.S. Children in Poverty (less than 100 percent of the FPL), 2004–2013 (numbers in thousands)
| Year | Total | Below Poverty | |
| Number | Percent | ||
| 2004 | 73,241 | 13,041 | 17.8 |
| 2005 | 73,285 | 12,896 | 17.6 |
| 2006 | 73,727 | 12,827 | 17.4 |
| 2007 | 73,996 | 13,324 | 18 |
| 2008 | 74,068 | 14,068 | 19 |
| 2009 | 74,579 | 15,451 | 20.7 |
| 2010 | 73,873 | 16,286 | 22 |
| 2011 | 73,737 | 16,134 | 21.9 |
| 2012 | 73,719 | 16,073 | 21.8 |
| 2013 | 73,625 | 14,659 | 19.9 |
SOURCE: DeNavas-Walt and Proctor, 2014.
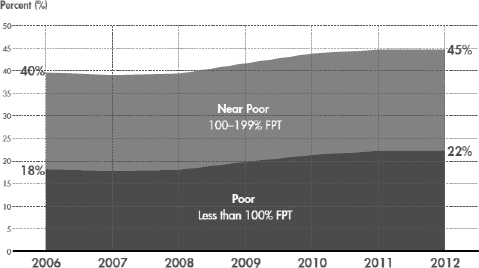
FIGURE 5-1 Children living in near poor (low-income) and poor families, 2006–2012.
SOURCE: Jiang et al., 2014.
number of children who live in “low-income families or families with incomes below 200 percent of the FPL” (Jiang et al., 2014). Figure 5-1 shows the percentage of children living below 100 percent of the FPL (poor) and below 200 percent of the FPL (low-income or near poor and poor) from 2006 to 2012. The numbers in both groups show a steady increase beginning in 2008. The absolute percentages are consistent with the American Community Survey data.
The patterns, regardless of source, suggest that there was an increasing pool of children who would be eligible for income-conditioned programs during the Great Recession of the 21st century.
How Child Poverty Is Represented in the SSI Program for Children with Disabilities
Because of income and resource eligibility criteria, nearly all children who are recipients of SSI disability benefits come from households that are poor or near poor. The Social Security Administration (SSA) does not regularly collect data on the degrees of poverty represented among child SSI recipients; however, the SSA does produce yearly data on the size of benefit payments administered to recipients, and it has also conducted occasional studies of the economic characteristics of households of the child SSI recipients.
TABLE 5-2 Number and Percentage of Families with SSI Recipients Under Age 18, by Poverty Status Minus SSI Payments, 2002 and 2010
| Family Income, Excluding SSI Payments, as a Percentage of Poverty Threshold | Number of Families with a Child Receiving SSI Benefits | |
| 2002 | 2010 | |
| Under 100 percent of the FPL | 475,194 | 692,696 |
| (53) | (58) | |
| 100–150 percent of the FPL | 213,773 | 187,481 |
| (24) | (16) | |
| 150 percent or more of the FPL | 205,959 | 313,670 |
| (23) | (26) | |
| Total | 894,924 | 1,193,848 |
SOURCES: Bailey and Hemmeter, 2014; DeCesaro and Hemmeter, 2008.
Every year in the SSI annual statistical report, the SSA reports the amount of money administered to disability benefit recipients. The 2013 SSI annual statistical report indicated that 62.6 percent of child SSI recipients received the maximum SSI benefit payment of $710.00 per month and therefore were living in households that had no “countable income”1 that could reduce the maximum SSA benefit payment each month.
In 2008 and in 2014 the SSA published research and statistics notes on the characteristics of noninstitutionalized disability insurance and SSI program participants in the years 2002 and 2010, respectively. To generate better information on the economic characteristics of SSI recipients, the SSA used validated Social Security numbers to match SSI disability administrative records to data from the Census Bureau’s Survey of Income and Program Participation (SIPP). By matching SSI recipients to SIPP households, the SSA was able to obtain more detailed estimates of the rates and severity of poverty for children who were recipients of SSI disability benefits. Data from these publications are summarized in Tables 5-2 and 5-3.
Table 5-2 shows the number and percentage of families with SSI recipients under age 18 who were below 100 percent FPL, between 100 and 150 percent FPL, and above 150 percent FPL excluding SSI payments, for 2002 and 2010. As the table shows, in 2010 approximately 58 percent of families with SSI recipients under age 18 were below 100 percent of the FPL. Another 16 percent of families with children receiving SSI payments were between 100 and 150 percent FPL.
_________________
1 An individual’s SSI benefit payment is calculated by subtracting the family’s “countable income” from the SSI federal benefit rate. The family’s countable income is calculated by subtracting income that is not counted by exclusionary SSI criteria from the family’s total income. Every additional dollar of countable income reduces the individual’s SSI payment. For more detail, see www.socialsecurity.gov/ssi/text-income-ussi.htm (accessed March 27, 2015).
Table 5-3 shows the number and percentage of families with SSI recipients under age 18 whose incomes were raised from below to above 100 percent FPL by the receipt of SSI payments. In 2010, 315,440 families were brought above the FPL by SSI payments, an increase from 175,394 in 2002. The percentage of SSI recipient families brought above the FPL also increased, from 36.9 percent in 2002 to 45.5 percent in 2010. As will be discussed further in the remainder of this chapter, poverty exacerbates negative outcomes in children with disabilities and their families.
These data show that a large majority of SSI recipients are from low-income households and that this was increasingly true over the period 2002–2010. Changes in the rates of poverty will directly affect the number of households that would be eligible for SSI and also the need for additional income supports. As such, an increase in the rates of poverty could reasonably be expected to precede or predict an increase in the rates of applications and determinations for disability benefits. Figure 5-2 shows the number of allowances and determinations for the 10 major mental disorders from 2004 to 2013; Figure 5-3 shows the number of children (in thousands) under 100 percent and 200 percent of the federal poverty guidelines.
As would be expected, the trends in the rate of child poverty from 2004 to 2013 coincided with the trends in the rates of SSI disability determinations and allowances over the same time period. The period of time where
TABLE 5-3 Number and Percentage of Families with SSI Recipients Under Age 18, by Poverty Status with and Without SSI Payments, 2002 and 2010
| Number of Families with a Child Receiving SSI benefits | ||
| 2002 | 2010 | |
| Total number of families with a child receiving SSI benefits | 894,924 | 1,193,848 |
| Number (percent) of families with incomes less than 100 percent FPL when SSI payments are excluded | 475,194 (53.1%) |
692,696 (58.0%) |
| Number (percent) of family with incomes less than 100 percent FPL when SSI payments are included | 299,800 (33.5%) |
377,256 (31.6%) |
| Number of families raised above 100 percent FPL by SSI payments | 175,394 | 315,440 |
| Percent of SSI recipients below the FPL, brought above 100 percent FPL by receipt of SSI benefits | 36.9% | 45.5% |
SOURCES: Bailey and Hemmeter, 2014; DeCesaro and Hemmeter, 2008.
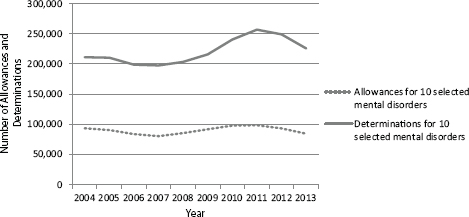
FIGURE 5-2 Allowances and determinations for 10 major mental disorders, 2004–2013.
SOURCE: Unpublished data set provided by the SSA.
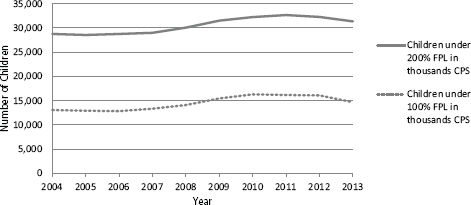
FIGURE 5-3 Estimated number (in thousands) of children in families under 100 percent and 200 percent of the federal poverty level by year, 2004–2013.
NOTE: The Current Population Survey table creator was used to generate numbers of children below 100 percent and 200 percent of the federal poverty level. Parameters used to generate the numbers include get count of: persons in poverty universe (everyone except unrelated individuals under 15); years: 2004 to 2013; Census 2010 weights; row variable: age; column variable: income-to-poverty ratio; and customized formatting: income-to-poverty ratio percent cutoffs of 200 percent and 100 percent.
SOURCE: U.S. Census Bureau, 2015.
there were increases in the rates of allowances and determinations (2008–2011) coincided with a period of serious recession in the U.S. economy. In 2014 the U.S. Census Bureau published a brief analysis that showed trends in poverty among children from 1999 to 2013. Figure 5-4 shows trends in both the number of children in poverty and the child poverty rate as a percentage of all children from 1999 to 2013, with the periods of recession highlighted. The Census Bureau’s analysis found that the first statistically significant decline in child poverty since 2000 was observed between 2012 and 2013, when the child poverty rate dropped from 21.8 to 19.9 percent (DeNavas-Walt and Proctor, 2014). This is consistent with trends observed in the SSI program; the numbers of allowances and determinations for the major mental disorders peaked in 2011 and then decreased through at least 2013.
Any analysis of the potential causes of the change observed in the SSI program for mental disorders in children should account for the variation in the number of children living in poverty. Calculating allowances, determinations, and recipients as a percentage of the number of children in low-income households for each year is a simple way of controlling for the effects of variations in child poverty rates on the SSI program. Year-to-year changes observed in the SSI program after controlling for poverty
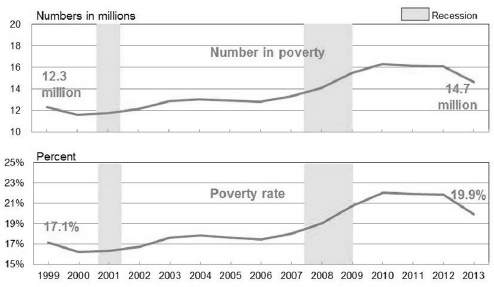
FIGURE 5-4 Child poverty rate and number of children in poverty.
SOURCE: Renwick, 2014.
will be due to factors such as variations in the rates of disability, changes in diagnostic practice, and changes in adjudicative standards or practices.
The last three columns of Table 5-4 show the results of calculating the rate of allowances, determinations, and recipients as a percentage of the number of children in households under 200 percent FPL.
From 2004 to 2013 there was a decrease in the percentage of allowances for the 10 major mental disorders among children in households under 200 percent of the FPL, from 0.32 to 0.27 percent. Furthermore, there was no overall increase in the percentage of determinations of disability among children in households under 200 percent FPL, though there was some variation during the period. The percentage of recipients among children increased, from 1.88 percent in 2004 to 2.09 percent in 2013. As was previously described in Chapter 3, the increase in recipients is likely to have been the result of the number of allowances and reentries from suspensions exceeding the number of suspensions, terminations, and transitions from child SSI to adult SSI.
After adjusting for changes in the number of children in low-income households in the United States, the rates of allowances and determinations for mental disorders did not increase over this time period. In addition, these figures illustrate the relatively small percentage of children in households under 200 percent FPL whose mental disorders are evaluated for SSI eligibility and the even smaller proportion that are found eligible.
Figures 5-5 and 5-6 further illustrate the effect of differences in the severity of child poverty on the rate of allowances and recipients for the 10 major mental disorders. Figure 5-5 shows that the rate of allowances is higher for applicant families that have less income and resources. As expected, the frequency of allowances is highest among the families that are at or below 100 percent FPL. The figure also shows that the rate of allowances among children at all levels of poverty decreased from year to year. The decrease was particularly noticeable for the period 2004–2007, but the entire period 2004–2013 appears to have seen a decrease. The percent change from 2004 to 2010 for children at or below 100 percent FPL was –20 percent, for those at or below 150 percent FPL it was –21 percent, for those at or below 200 percent FPL it was –21 percent, and for all children was –17 percent. The percentage point change between 2004 and 2010 (i.e., the difference between the percentage in 2004 and the percentage in 2010) for children at or below 100 percent FPL was –14 percent, for those at or below 150 percent FPL it was –12 percent, for those at or below 200 percent FPL it was –10 percent, and for all children it was –6 percent. Consistent with these decreases, the rate of allowances for all children in the general population decreased slightly from 2004 to 2013. The decrease in the rate of allowances over time among families in low-income households is likely due to a steady increase in the number of children who
TABLE 5-4 Rate of Allowances, Determinations, and Recipients as a Percentage of the Number of Children in Households Under 200 Percent FPL
| Year | # of (initial) Child Allowances for 10 Major Mental Disorders | # of (initial) Child Determinations for 10 Major Mental Disorders | # of (initial) Child Recipients for 10 Major Mental Disorders | # of Children in Households Under 200 Percent FPL | Percent of Children Under 200 Percent FPL Allowed SSI for 10 Major Mental Disorders | Percent of Children Under 200 Percent FPL Determined for 10 Major Mental Disorders | Percent of Children Under 200 Percent FPL Recipients of SSI Benefits for 10 Major Mental Disorders |
| 2004 | 93,401 | 211,191 | 540,051 | 28,753,000 | 0.32% | 0.73% | 1.88% |
| 2005 | 90,554 | 210,316 | 562,402 | 28,539,000 | 0.32% | 0.74% | 1.97% |
| 2006 | 83,707 | 198,857 | 577,091 | 28,757,000 | 0.29% | 0.69% | 2.01% |
| 2007 | 80,465 | 197,612 | 583,947 | 28,999,000 | 0.28% | 0.68% | 2.01% |
| 2008 | 85,447 | 203,522 | 587,618 | 30,064,000 | 0.28% | 0.68% | 1.95% |
| 2009 | 91,739 | 215,813 | 600,115 | 31,505,000 | 0.29% | 0.69% | 1.90% |
| 2010 | 97,778 | 240,506 | 615,772 | 32,254,000 | 0.30% | 0.75% | 1.91% |
| 2011 | 98,571 | 256,867 | 631,602 | 32,678,000 | 0.30% | 0.79% | 1.93% |
| 2012 | 93,132 | 249,152 | 647,555 | 32,269,000 | 0.29% | 0.77% | 2.01% |
| 2013 | 84,307 | 225,667 | 654,370 | 31,364,000 | 0.27% | 0.72% | 2.09% |
NOTE: The Current Population Survey table creator was used to generate numbers of children below 200 percent of the federal poverty level. Parameters used to generate the numbers include get count of: persons in poverty universe (everyone except unrelated individuals under 15); years: 2004 to 2013; Census 2010 weights; row variable: age; column variable: income-to-poverty ratio; and customized formatting: income-to-poverty ratio percent cutoff of 200 percent.
SOURCES: U.S. Census Bureau, 2015; unpublished data set provided by the SSA.
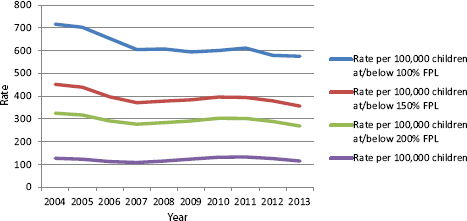
FIGURE 5-5 Rate of SSI child allowances for the 10 major mental disorders per 100,000 children under 100 percent FPL, under 200 percent FPL, and for the total U.S. under-18 population.
NOTE: The Current Population Survey table creator was used to generate numbers of children below 200 percent of the federal poverty level. Parameters used to generate the numbers include get count of: persons in poverty universe (everyone except unrelated individuals under 15); years: 2004 to 2013; Census 2010 weights; row variable: age; column variable: income-to-poverty ratio; and customized formatting: income-to-poverty ratio percent cutoffs of 200 percent, 150 percent, and 100 percent.
SOURCES: U.S. Census Bureau, 2015; unpublished data set provided by the SSA.
are in households that are at or near the FPL (i.e., a steady increase in the denominator). In contrast, the frequency of allowances among all children (i.e., the numerator) did not vary substantially over the period because there was little change in the number of allowances relative to the overall number of children.
Figure 5-6 shows how the rate of recipients of SSI benefits for the 10 major mental disorders in children in low-income households is sensitive to differences in the severity of child poverty. The proportion of all U.S. children receiving SSI benefits for the 10 major mental disorders increased from 2004 to 2013. This increase is reflected in all poverty groups. The dip in rates observed during 2008–2011 in the 100 percent or below FPL population, and also to a lesser degree in the 150 percent and 200 percent FPL or below populations, may be attributed in part to the increased rates of child poverty following the period of recession in 2008.
The rate of recipients among all children in the United States increased gradually from year to year for the entire decade, from approximately 737 per 100,000 children in 2004 to 889 per 100,000 children in 2013. This
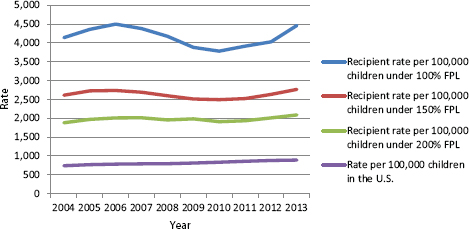
FIGURE 5-6 Rate of SSI child recipients for 10 major mental disorders per 100,000 children under 100 percent FPL, under 200 percent FPL, and for the total U.S. under-18 population.
NOTE: The Current Population Survey table creator was used to generate numbers of children below 100 percent, 150 percent, and 200 percent of the federal poverty level. Parameters used to generate the numbers include get count of: persons in poverty universe (everyone except unrelated individuals under 15); years: 2004 to 2013; Census 2010 weights; row variable: age; column variable: income-to-poverty ratio; and customized formatting: income-to-poverty ratio percent cutoffs: 200 percent, 150 percent, and 100 percent.
SOURCES: U.S. Census Bureau, 2015; unpublished data provided by the SSA.
was a 21 percent increase, and an increase of 0.15 percentage points in the rate per 100,000. In contrast, the rate of recipients among children in households at or below 100 percent FPL varied over the decade, with an increase in rates from 2004 to 2006, a decrease from 2006 to 2010, and then another period of increases from 2010 to 2013. Over the entire 10-year period the rate of recipients within children in households at or below 100 percent FPL increased from 4,141 per 100,000 children in 2004 to 4,464 per 100,000 children in 2013, with a high of 4,499 per 100,000 in 2006 and a low of 3,781 per 100,000 in 2010. Among children at or below 100 percent FPL, the percentage increase from 2004 to 2010 was 8 percent, while the percentage point increase was 0.32 percent.
Figure 5-6 illustrates two findings. First, the rate for receipt of benefits is greatest for the poorest families. Second, the total relative increase in the rate of recipients from 2004 to 2013 was the least for the lowest-income families (100 percent and 150 percent FPL). The variations observed in the rates of recipients are affected by changes in the rates of child poverty. When child poverty is taken into account, there was little or no overall increase in the rates of recipients from 2004 to 2013.
CHILDHOOD DISABILITY
The identification of disability in children is perhaps a more complex and dynamic process than the measurement of poverty. This is in part because children develop new skills as they age and the expectations for their functioning increase dramatically with time. Additionally, the way in which disability is framed has changed substantially in recent decades. In health care and in the determination process of disability by the SSA, disability is understood to be a personal attribute that is the consequence of health-related conditions. The consequences are impairments that limit the activities that a person is able to do. The SSA evaluates how well a child can perform activities in six domains: acquiring and using information, attending to and completing tasks, interacting and relating with others, moving about and manipulating objects, caring for himself or herself, and maintaining health and physical well-being. Newer models of disability blend the “medical model” with an understanding that the experience of disability is contextualized by the world in which a person lives. Models proposed by Nagi in the 1960s and 1970s, by the Institute of Medicine in 1991, by the World Health Organization in 2001 as the International Classification of Functioning, Disability and Health, and by the United Nations Convention in 2006 solidified the definition of disability as the outcome of interactions between persons with impairment and attitudinal and/or environmental barriers that hinder full and effective participation (Stein, 2007).
Data on childhood disability suggest that the proportion of children experiencing disability is steadily increasing, regardless of the definition used. In 1980, 3.8 percent of U.S. children had health-related limitations of activity (Newacheck at al., 1986). Thirty years later, 7.9 percent of children had an activity limitation (Houtrow et al., 2014). In addition, the health conditions associated with disability are shifting. A recent study by Olfson anc colleagues showed a decrease in the percentage of young people with severe mental health impairment; at the same time there were increases in the rates of mental health treatment (Olfson et al., 2015). Between 2000–2001 and 2010–2011 there was a 21 percent increase in disability related to mental health and a 12 percent decline in disability owing to physical conditions (Houtrow et al., 2014). The SSA process for determining disability has changed little over the years, although the populations to which the definitions are applied have changed. Thus, the SSA process for the determination and classification of disability (see Chapter 2) differs from the determination and classification or diagnosis of disability in other contexts, such as determinations for clinical treatment, for the provision of support services, or for epidemiologic surveillance and research. For this reason, shifts in the SSA determination outcomes have not, and in the future
may not, reflect the changes reported by surveys of disability in the general childhood population.
The Relationship Between Childhood Disability and Poverty
The relationship between childhood disability and poverty is best described as complex and interactive (Lustig and Strauser, 2007). Poor health and disability are strongly associated with poverty (Stein and Silver, 2002). This relationship is thought to be a linear one, in which income or socioeconomic status and parental education (which are highly correlated) are correlated with health both within and across societies (Marmot et al., 1987). The same is true for disabilities associated with mental health disorders: children living in or near poverty have higher rates of disability associated with mental health disorders than other children (Houtrow et al., 2014). Poverty has also been shown to be a source of a gradient for overall child health (Brooks-Gunn and Duncan, 1997; Fletcher and Wolfe, 2012; Lubotsky et al., 2002; Starfield et al., 2002). It is clear that poverty is also associated with other social disadvantages, such as minority status, single parenthood, and poor education, which have a cumulative effect on child health and disability (Bauman et al., 2006; Evans, 2004).
Children who are born to mothers in low-income households are more likely to be born pre-term, to have worse birth outcomes, and to demonstrate higher proportions of developmental disadvantage as well as poorer health outcomes (NRC and IOM, 2000). Even when preterm babies have an identical medical status, their prognosis is heavily influenced by their socioeconomic status, with those from less advantaged backgrounds being more likely to experience poorer outcomes (Escalona, 1982; Stein et al., 2010). Furthermore, children who grow up in poverty are less likely to be treated for their conditions, as they generally have more limited access to care, and even those with insurance may face additional barriers and consequently have poorer health outcomes (Van Cleave et al., 2010).
In general, children and youth who live in poverty have increased rates of most chronic health conditions, more severe conditions and complications, and poorer access to care. Thus, for example, children in low-income households with acute lymphocytic leukemia (the most common leukemia in childhood) have higher rates of mortality than middle-income children with the same disease. Similar findings exist for a wide range of childhood conditions, such as cystic fibrosis, spina bifida, and congenital heart disease. Among higher-prevalence conditions, such as obesity and asthma, although these conditions affect children in all socioeconomic status groups, the prevalence is higher and the course of the disorder more severe in lower-income households. The data for mental health conditions may be less well developed than those for other conditions, but here too there is moderate
to strong evidence that these conditions (e.g., attention deficit hyperactivity disorder and depression, conduct disorder) occur more commonly among poor children and likely with greater severity, with the possible exception of Autism (Houtrow and Okumura, 2011).
Furthermore, children who live in low-income households experience more food insecurity, more parental depression and other mental health disorders, and more housing instability and are more likely to live in neighborhoods where there are more environmental hazards which may be associated with higher rates of injury and exposure to traumatic events (Merikangas et al., 2010). As a result, children who live in low-income households are more likely to experience toxic stress, which has been shown to affect long-term health and well-being (Shonkoff et al., 2012).
Additionally, having a child with a disability places financial and other stress on families and may increase the chances of the family becoming poor. There are both direct and indirect effects. Households with children with chronic health conditions face higher costs for caring for the children as well as decreased household income when parents leave the workforce or decrease their paid workload to care for a child with a disability (National Commission on Childhood Disability, 1995). Families with a child with disabilities are also more likely to incur increased out-of-pocket expenses, for example, for childcare or for transportation to locations with specialized medical care (Kuhlthau et al., 2005; Newacheck and Kim, 2005). The time and energy required to take care of such a child and the strain on financial resources often affect parents’ opportunities for advancement in life by interfering with their educational aspirations or promotion in employment (Anderson et al., 2007). These parents’ lives are often interrupted unexpectedly by the need to deal with a child’s condition. Until the passage of the Affordable Care Act, there also was a great likelihood that families with private health insurance would find it difficult to insure children with disabilities, leading to considerable medical expenses and work loss and sometimes to employment discrimination. There has also been evidence that, for some families, parents had to work more in order to secure health insurance, leading to reduced time spent with children (Gould, 2004). The net result is that many families with children with disabilities experience either a lack of economic advancement or decreased overall resources relative to other families and are therefore more likely to enter and remain in poverty.
A number of studies have shown that parents—both fathers and mothers—raising children with disabilities have lower rates of employment than parents with similar characteristics who have children without ongoing health conditions (Kuhlthau and Perrin, 2001; Kuhlthau et al., 2005). Another study documented much higher rates of stopping or decreasing employment as well as lower household income among mothers 6 months after their children’s first hospitalization for a chronic health
condition when compared with mothers of children with acute hospitalizations (Thyen et al., 1999).
In conclusion, children living in poverty are more likely than other children to have mental health problems, and their conditions are more likely to be severe. This too will have an upward effect on numbers of determinations and, perhaps, allowances. When analyzing SSI data and finding comparables for trend examination, the impact of poverty should be factored into the analyses. The committee has attempted to do this in the remainder of the report, and it suggests that prospective acquisition of data by SSI similarly should take poverty into account.
FINDINGS
- The total number of U.S. children changed very little during the 2004–2013 decade, but both the number and percentage of all children who lived in impoverished households increased. The major increase occurred from 2008 to 2010 and coincided with a time of economic recession.
- The biggest percentage increase of children in poor families between 2004 and 2013 occurred in those families with incomes less than 100 percent of the FPL. A small increase was documented for children in families whose income was between 100 percent and 200 percent of the FPL.
- The proportion of all children who are identified as having a disability in the United States has steadily increased each decade since the 1960s.
- The definition of disability has evolved to encompass a variety of factors that influence impairment due to biomedical factors and contextual factors such as poverty as well as functional limitations and barriers to effective participation in usual childhood activities.
- The number of families with an SSI recipient who are living under the FPL when SSI benefits are not included in calculating income increased by 46 percent between 2002 and 2010. In 2010 more than 45 percent of those families were raised above the FPL after receiving SSI benefits, potentially reducing both economic stresses and the risk of worsening child disability.
- Neither the total number of child mental disorder allowances of SSI benefits nor the rate of allowances among children in poverty increased during the 2004–2013 decade. In fact, the total number of allowances was approximately 10 percent lower in 2013 than in 2004.
- Despite the decrease in allowances, the number of recipients increased steadily during the 2004–2013 decade. Total recipients as a percentage of all children in households under 200 percent of the FPL increased by approximately 11 percent. Recipient rates increased for all levels of poverty.
- Allowance and recipient rates per 100,000 children were higher for families under the FPL than for those above, and they increased with progressively more severe levels of poverty.
CONCLUSIONS
- Poverty is a risk factor for child disability, including disability associated with mental disorders. At the same time, child disability is a risk factor for family poverty. At times of economic hardship in the United States, more children with mental disorder–related disabilities will qualify for benefits because they meet the income eligibility threshold. In this situation, the number of SSI determinations and allowances would be expected to increase, unless the SSI determination process becomes more stringent, the income eligibility criteria are changed, or there is a coincidental change in the characteristics of the population applying for SSI benefits.
- Children living in poverty are more likely than other children to have mental health problems, and these conditions are more likely to be severe. Low-income families with a child who has a disability may be particularly vulnerable at times of economic hardship. Access to Medicaid and income supports via the SSI disability program may improve the long-run outcomes for both children with disabilities and their families.
REFERENCES
Anderson, D., S. Dumont, P. Jacobs, and L. Azzaria. 2007. The personal costs of caring for a child with a disability: A review of the literature. Public Health Reports 122(1):3–16.
Bailey, M. S., and J. Hemmeter. 2014. Characteristics of noninstitutionalized DI and SSI program participants, 2010 update. Research and Statistics Note No. 2014-02. www.ssa.gov/policy/docs/rsnotes/rsn2014-02.html (accessed July 1, 2015).
Bauman, L. J., E. J. Silver, and R. E. Stein. 2006. Cumulative social disadvantage and child health. Pediatrics 117(4):1321–1328.
Brooks-Gunn, J., and G. J. Duncan. 1997. The effects of poverty on children. Future of Children 7(2):55–71.
DeCesaro, A., and J. Hemmeter. 2008. Characteristics of noninstitionalized DI and SSI program participants. Research and Statistics Note No. 2008-02. www.ssa.gov/policy/docs/rsnotes/rsn2008-02.html (accessed July 1, 2015).
DeNavas-Walt, C., and B. D. Proctor. 2014. Income and poverty in the United States: 2013. U.S. Census Bureau current population reports, P60-249. Washington, DC: U.S. Government Printing Office. www.census.gov/content/dam/Census/library/publications/2014/demo/p60-249.pdf (accessed July 1, 2015).
Escalona, S. K. 1982. Babies at double hazard: Early development of infants at biologic and social risk. Pediatrics 70(5):670–676.
Evans, G. W. 2004. The environment of childhood poverty. American Psychologist 59(2):77–92.
Fletcher, J., and B. L. Wolfe. 2012. Increasing our understanding of the health–income gradient in children. National Bureau of Economic Research Working Paper No. 18639. www.nber.org/papers/w18639 (accessed July 1, 2015).
Gould, E. 2004. Decomposing the effects of children’s health on mother’s labor supply: Is it time or money? Health Economics 13(6):525–541.
Hokayem, C., and M. L. Heggeness. 2014. Living in near poverty in the United States: 1966–2012. U.S. Census Bureau current population reports, P60-248. Washington, DC: U.S. Government Printing Office. www.census.gov/prod/2014pubs/p60-248.pdf (accessed July 1, 2015).
Houtrow, A. J., and M. J. Okumura. 2011. Pediatric mental health problems and associated burden on families. Vulnerable Children and Youth Studies 6(3):222–233.
Houtrow A. J, K. Larson, L. M. Olson, P. W. Newacheck, and N. Halfon. 2014. Changing trends of childhood disability, 2001–2011. Pediatrics 134(3):530–538.
Jiang, Y., M. Ekono, and C. Skinner. 2014. Basic facts about low-income children: Children under 18 years, 2012. National Center for Children in Poverty, Columbia University, February. http://www.nccp.org/publications/pdf/text_1089.pdf (accessed July 1, 2015).
Kuhlthau, K. A., and J. M. Perrin. 2001. Child health status and parental employment. Archives of Pediatric and Adolescent Medicine 155(12):1346–1350.
Kuhlthau, K., K. Hill, R. Yucel, and J. Perrin. 2005. Financial burden for families of children with special health care needs. Maternal and Child Health Journal 9(2):207–218.
Lubotsky, D., C. Paxson, and A. Case. 2002. Economic status and health in childhood: The origins of the gradient. American Economic Review 92(5):1308–1334.
Lustig, D. C., and D. R. Strauser. 2007. Causal relationships between poverty and disability. Rehabilitation Counseling Bulletin 50(4):194–202.
Marmot, M. G., M. Kogevinas, and M. A. Elston. 1987. Social/economic status and disease. Annual Review of Public Health 8:111–135.
Merikangas, K. R., J.-P. He, M. Burstein, S. A. Swanson, S. Avenevoli, L. Cui, C. Benjet, K. Georgiades, and J. Swendsen. 2010. Lifetime prevalence of mental disorders in U.S. adolescents: Results from the National Comorbidity Survey Replication-Adolescent Supplement (NCS-A). Journal of the American Academy of Child & Adolescent Psychiatry 49(10):980–989.
National Commission on Childhood Disability. 1995. SSI disability benefits for children: Supplemental Security Income for children with disabilities. Report to Congress of the National Commission on Childhood Disability, October, Washington, DC. www.ssa.gov/history/reports/SSI/ChildhoodDisabilityReport.html (accessed July 1, 2015).
Newacheck, P. W., and S. E. Kim. 2005. A national profile of health care utilization and expenditures for children with special health care needs. Archives of Pediatric and Adolescent Medicine 159(1):10–17.
Newacheck, P. W., N. Halfon, and P. P. Budetti. 1986. Prevalence of activity limiting chronic conditions among children based on household interviews. Journal of Chronic Diseases 39(2):63–71.
NRC and IOM (National Research Council and Institute of Medicine). 2000. From neurons to neighborhoods: The science of early childhood development. Committee on Integrating the Science of Early Childhood Development. Jack P. Shonkoff and Deborah A. Phillips, eds. Board on Children, Youth, and Families, Commission on Behavioral and Social Sciences and Education. Washington, DC: National Academy Press.
Olfson, M., B. G. Druss, and S. C. Marcus. 2015. Trends in mental health care among children and adolescents. New England Journal of Medicine 372(21):2029–2038.
Parish, S. L., and J. M. Cloud. 2006. Financial well-being of young children with disabilities and their families. Social Work 51(3):223–232.
Renwick, T. 2014. Child poverty down—Income of families with children up. Random Samplings, September 16. U.S. Census Bureau blog. http://blogs.census.gov/2014/09/16/child-poverty-down-income-of-families-with-children-up (accessed July 1, 2015).
Shonkoff, J. P., A. S. Garner, and the Committee on Psychosocial Aspects of Child and Family Health, Committee on Early Childhood, Adoption, and Dependent Care, and Section on Developmental and Behavioral Pediatrics. 2012. The lifelong effects of early childhood adversity and toxic stress. Pediatrics 129(1):232–246.
Starfield, B., J. Robertson, and A. W. Riley. 2002. Social class gradients and health in childhood. Ambulatory Pediatrics 2(4):238–246.
Stein, M. A. 2007. A quick overview of the United Nations Convention on the Rights of Persons with Disabilities and its implications for Americans with disabilities. Mental and Physical Disability Law Reporter 31(5):679–683.
Stein, R. E., and E. J. Silver. 2002. Comparing different definitions of chronic conditions in a national data set. Ambulatory Pediatrics 2(1):63–70.
Stein, R. E., M. J. Siegel, and L. J. Bauman. 2010. Double jeopardy: What social risk adds to biomedical risk in understanding child health and health care utilization. Academic Pediatrcs 10(3):165–171.
Thyen, U., K. Kuhlthau, and J. M. Perrin. 1999. Employment, child care, and mental health of mothers caring for children assisted by technology. Pediatrics 103(6):1235–1242.
U.S. Census Bureau. 2015. CPS table creator. www.census.gov/cps/data/cpstablecreator.html (accessed July 13, 2015).
Van Cleave, J., S. L. Gortmaker, and J. M. Perrin. 2010. Dynamics of obesity and chronic health conditions among children and youth. JAMA 303(7):623–630.
Wolfe, B. L., and S. C. Hill. 1995. The effect of health on the work effort of single mothers. Journal of Human Resources 30(1):42–62.
This page intentionally left blank.


