
The NIH SBIR/STTR programs are the second largest after the Department of Defense (DoD). In fiscal year (FY) 2014, the programs provided more than $800 million in funding, an increase of more than $100 million from FY2013 following implementation of changes made in the 2011 reauthorization of the SBIR/STTR programs (see Chapter 1).
The FY2014 total can be broken down as follows (see Table 4-1):
- The SBIR program provided $711.1 million (88.3 percent of total funding).
- The STTR program provided $94.4 million (11.7 percent of total funding).
- SBIR grants accounted for $602.0 million. The recently expanded SBIR contracts accounted for $109.1 million.
- SBIR and STTR Fast Track grants totaled $54.4 million (6.8 percent of total funding).
- SBIR and STTR Phase I awards (excluding Fast Track) were $246.7 million (30.6 percent of total funding).
- SBIR and STTR Phase II awards (excluding Fast Track) were $504.4 million (62.6 percent of total funding).
A more extended analysis of the data is provided in the Annex to this chapter. This summary provides an overview of applications and awards for the NIH SBIR/STTR programs, including a review of trends, the distribution of awards by state, and participation by companies new to the program.
TABLE 4-1 SBIR/STTR Funding by Program, Phase, and Funding Mechanism, FY2014
| Funding (Millions of Dollars) | Percentage of Total Funding | |||||
| Phase I | Phase II | Fast Track (Phases I and II combined) | Total | |||
| SBIR grants | ||||||
| competing (new) | 146.1 | 170.4 | 316.5 | 39.3 | ||
| non-competing (renewals) | 26.0 | 212.5 | 238.5 | 29.6 | ||
| Fast Track (new) | 17.1 | 17.1 | 2.1 | |||
| Fast Track (renewals) | 29.9 | 29.9 | 3.7 | |||
| SBIR grants total | 172.1 | 382.9 | 47.0 | 602.0 | 74.7 | |
| STTR grants | ||||||
| competing (new) | 35.8 | 21.7 | 57.5 | 7.1 | ||
| non-competing (renewals) | 5.6 | 23.9 | 29.5 | 3.7 | ||
| Fast Track (new) | 1.1 | 1.1 | 0.1 | |||
| Fast Track (renewals) | 6.3 | 6.3 | 0.8 | |||
| STTR total | 41.4 | 45.6 | 7.4 | 94.4 | 11.7 | |
| SBIR contracts | 33.2 | 75.9 | 109.1 | 13.5 | ||
| Total | 246.7 | 504.4 | 54.4 | 805.5 | 100.0 | |
| SBIR total | 205.3 | 458.8 | 47 | 711.1 | 88.3 | |
| STTR total | 41.4 | 45.6 | 7.4 | 94.4 | 11.7 | |
SOURCE: NIH Reporter database, Table 126.
SBIR PHASE I
SBIR Phase I Grants: Applications and Awards
SBIR Phase I applications at NIH have declined over time, despite a rebound during the period following the financial crisis of 2008-2009. This trend, not unique to NIH, has occurred at other agencies. Applications in FY2014 were at about 4,500, down from well over 5,500 in FY2010 and FY2011.
Over the period as a whole, the success rate for SBIR Phase I applications was 17.5 percent, ranging from a low of 13.7 percent in FY2010 to a high of 27.1 percent in FY2008. Given that funding over the period was relatively flat, year-to-year changes in success rate are largely driven by changes in the number of applications.
SBIR Phase I grants remain the primary gateway into the program. Until FY2014, only Phase I winners could apply for Phase II funding. On average
about 650 new Phase I awards were made each year of the study period, although the number declined slightly in recent years. Funding for Phase I grants remained largely flat at about $120 million annually, although increases in FY2012 and FY2014 above $140 million suggest that a new increased level might be emerging, based perhaps on the expansion in overall funding mandated under reauthorization.
While the number of awards declined, the average size of new Phase I awards increased, from about $150,000 in FY2005 to more than $220,000 for FY20112014. About 12 percent of Phase I winners received additional funding through supplementary awards. These awards average about $270,000, so they constitute a sharp expansion in the amount of Phase I funding for those projects that receive supplements.
SBIR Phase I Contracts
Contracts have until recently constituted a small share of the SBIR program at NIH (there are no STTR contracts). Traditionally, the focus has been on grants, with contracts being used for technologies that might then be used or needed within NIH. That changed in FY2014 following a substantial shift from grants to contracts at the National Cancer Institute (NCI), where approximately 35 percent of Phase I awards are now made through contracts. (This change is discussed in detail in Chapter 2.) Prior to FY2014, the number of Phase I contracts increased somewhat but remained well below 80 per year (except for FY2010). In FY2014 there were 129 contracts. Funding amounts increased from $20 million in FY2013 to $33 million in FY2014. In general, the size of contracts tracked closely with the size of grants on a year-by-year basis.
SBIR PHASE II
To a considerable degree, the distribution of SBIR Phase II awards is driven by the distribution of Phase I awards. Until FY2015, all Phase II awards went to projects that had already received a Phase I award (except for Fast Track awards, see Fast Track section below). This section covers both grants and contracts because they are not disaggregated in the NIH dataset.
As with Phase I, there was a decline in Phase II applications across the study period (FY2005-2014), mitigated by the apparent response to the financial crash in 2009-2010. Overall, the number of applications declined from about 850 in FY2005 to 566 in FY2014. Success rates for Phase II grant applications varied by year but averaged about 35 percent across the period.
The number of new Phase II SBIR grants also declined over the study period, from a high of 355 in FY2006 to 229 in FY2014, with a low of 183 in FY2013. This trend is a matter of some concern, because Phase II grants have historically provided the core of the program and are the source of most commercial innova-
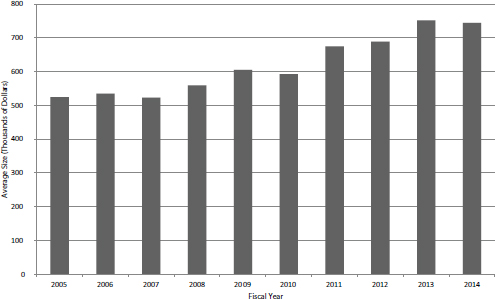
FIGURE 4-1 Average size of competing Phase II SBIR grant, FY2005-2014.
SOURCE: NIH Division of Statistical Analysis and Reporting, Table 126.
tion within it. A number of possible explanations exist for this trend, which occurred in a context in which funding for the program as a whole increased by 12 percent. Explanations include a shift of program funds to the out years of grants and to contracts. However, the most immediate explanation lies in the increased size of SBIR Phase II grants. Figure 4-1 shows the growth in the average size of year 1 funding for new Phase II grants.
During the study period, average funding increased almost 42 percent from $525,000 in FY2005 to $744,000 in FY2014. Larger awards are indeed made at the cost of more awards, even in an environment where funding has increased. Out-year funding—which NIH calls noncompeting awards—grew proportionally, from about $500,000 per award on an annual basis to about $700,000.
Phase IIB Grants
NIH has initiated a special funding program within the SBIR program to help companies address the formidable financial hurdles involved in meeting the clinical trials requirements imposed by the U.S. Food and Drug Administration (FDA) before products can be brought to market. Phase IIB (formerly known as competing continuation awards) provide up to $1 million annually for 3 years to support companies engaged with the clinical trials process. After the pilot phase in FY2003 and FY2004, the number of Phase IIB SBIR awards settled at about 20 per year.
Aside from an outlier in FY2006, annual funding for Phase IIB was between $40 million and $50 million, or 56 percent of total program funding. Prior to the 2011 reauthorization, companies could receive more than one Phase IIB award (22 did so, with two companies receiving four such awards).
SBIR Phase II Contracts
Until very recently NIH awarded a relatively small number of Phase II contracts. Between FY2005 and FY2013, they averaged fewer than 30 per year. In FY2014, there was a sharp increase, to more than 70. Funding shifted in tandem, growing from $30 million in FY2013 to about $75 million in FY2014. This is almost entirely the result of a change in policy at NCI, which accounted for almost all of the additional awards. This policy change is discussed further in Chapter 2.
Fast Track
NIH has permitted Fast Track applications for over a decade. If approved, a Fast Track award transitions qualified projects directly from Phase I to Phase II, and no further application is required. Milestones that signal the successful completion of Phase I feasibility studies must be met. The program aims to provide a more rapid transition for projects where the company can present convincing evidence of feasibility, including in many cases preliminary data.
The number of Fast Track awards grew steadily and substantially over the study period, and in FY2014 there were more than 70 Fast Track awards, constituting almost 25 percent of all Phase II awards (computed with Fast Track awards included in the denominator).
What was an experimental or pilot program now appears to be well embedded in the SBIR/STTR programs at NIH. The Fast Track program has multiple potential benefits: it reduces the load on reviewers, provides more certainty for the firm, and essentially eliminates the Phase I-Phase II funding gap that can pose real problems for small companies.
STTR
There are no STTR contracts, so all STTR awards are made in the form of grants. There were about 500 Phase I STTR applications annually from FY20092013, before increasingly sharply to almost 800 in FY2014. Applications tended to have slightly higher success rates than those for Phase I SBIR; there was no clear pattern over time, with STTR rates moving randomly between about 14 percent and 22 percent. The number of STTR Phase II awards tracked Phase I with a lag and accounted for about 70 percent of STTR program funding.
STTR is funded at about 10 percent of SBIR. There were 1,209 new STTR awards over the period, accounting for about 14 percent of all Phase I grants.
Funding for STTR awards declined from FY2005 to FY2011, from $32 million to just over $21 million, before increasing in each year since to reach $41 million in FY2014.
NEW ENTRANTS
About one-third of companies submitting Phase I SBIR/STTR applications were new to the program, and they accounted for between 20 and 25 percent of applications. These companies also accounted for about 30 percent of Phase I awardees and, in recent years, more than 25 percent of awards, which suggests that the program is open to new entrants and that existing companies do not have a substantial advantage in pursuing funding (see Figure 4-2).
AWARDS AND THE STATES
Awards are not distributed equally across the states, and Congress has indicated concern about the levels of awards to low-award states. However, statistical analysis indicates a strong correlation between the number of applications per 100,000 population and the number of scientists and engineers employed in the state per 1,000 population (Pearson correlation = 0.67).
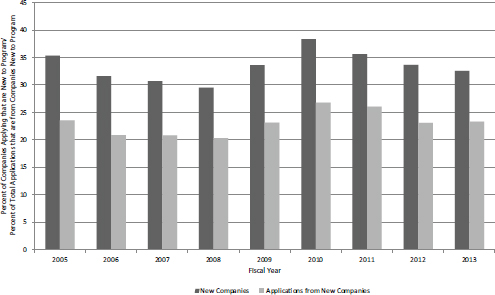
FIGURE 4-2 Share of NIH SBIR/STTR applications and awards from previously nonparticipating companies, FY2005-2013.
SOURCE: NIH data provided by the NIH SBIR/STTR Program Office.
Normalizing for population shows that applications are received at very different rates from the states. Massachusetts firms generated an average of 850 Phase I SBIR applications per 100,000 population annually across the study period. In contrast, six states generated fewer than 50 per 100,000 population.
The number of applications from a given state largely drives the number of awards to that state, but some states are more successful on average than others. Success rates vary from a high of 32 percent to a low of less than 10 percent for four states. Unlike application rates, success rates are not well correlated with the share of scientists and engineers in the workforce (Pearson correlation = 0.28). However, the states with very low employment rates for scientists and engineers also report low success rates, so there may be an effect at the lower end of the distribution.
ANNEX 4-A: SBIR AND STTR AWARDS AT NIH
Introduction
This annex describes and analyzes SBIR and STTR awards made by NIH. In order to focus on more recent awards while ensuring that longer-term trends are addressed, the period of analysis in this case is FY2005-2014 inclusive. A 10-year period seems sufficient for trend analysis, particularly given the important changes to the program during that period.
This annex covers Phase I and Phase II awards, and awards through SBIR and STTR separately. It considers awards from a range of perspectives, including distribution by state, the impact of multiple awards to individual companies, and applications and success rates.
Table 4-2 shows funding by program and phase for FY2014; Figure 4-3 shows a summary of this information in chart format. Overall the rate of increase
TABLE 4-2 SBIR/STTR Funding by Program, Phase, and Funding Mechanism, FY2014
| Funding (Millions of Dollars) | Percentage of Total Funding | |||||
| Phase I | Phase II | Fast Track (Phases I and II combined) | Total | |||
| SBIR grants | ||||||
| competing (new) | 146.1 | 170.4 | 316.5 | 39.3 | ||
| non-competing (renewals) | 26.0 | 212.5 | 238.5 | 29.6 | ||
| Fast Track (new) | 17.1 | 17.1 | 2.1 | |||
| Fast Track (renewals) | 29.9 | 29.9 | 3.7 | |||
| SBIR grants total | 172.1 | 382.9 | 47.0 | 602.0 | 74.7 | |
| STTR grants | ||||||
| competing (new) | 35.8 | 21.7 | 57.5 | 7.1 | ||
| non-competing (renewals) | 5.6 | 23.9 | 29.5 | 3.7 | ||
| Fast Track (new) | 1.1 | 1.1 | 0.1 | |||
| Fast Track (renewals) | 6.3 | 6.3 | 0.8 | |||
| STTR total | 41.4 | 45.6 | 7.4 | 94.4 | 11.7 | |
| SBIR contracts | 33.2 | 75.9 | 109.1 | 13.5 | ||
| Total | 246.7 | 504.4 | 54.4 | 805.5 | 100.0 | |
| SBIR total | 205.3 | 458.8 | 47 | 711.1 | 88.3 | |
| STTR total | 41.4 | 45.6 | 7.4 | 94.4 | 11.7 | |
SOURCE: NIH Reporter database, Table 126.
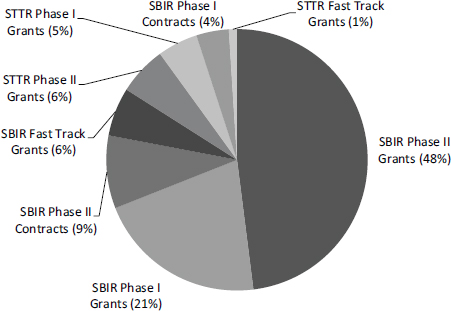
FIGURE 4-3 SBIR/STTR funding by program, phase, and funding mechanism, FY2014.
SOURCE: NIH RePorter database, Table 126.
in funding for the SBIR/STTR programs during the study period approximately matched inflation rates for the economy as a whole, although biomedical inflation has been higher. Figure 4-4 shows total SBIR/STTR funding for FY2005-2014. The increase in FY2014 reflects additional funding added through reauthorization.
SBIR
SBIR Phase I
Most funding and awards have historically been provided through the standard NIH SBIR grant mechanism. In FY2014, however, funding for contracts effectively doubled, driven almost entirely by changes in strategy at NCI, one of the largest Institutes and Centers (ICs). For reasons described in more detail in Chapter 2, contracts and grants are quite different and are thus described separately in this chapter.
SBIR Phase I Applications and Success Rates
Figure 4-5 shows the number of Phase I SBIR applications received by NIH in FY2005-2014 (data in this section covers both grants and contracts because they are not disaggregated in the NIH dataset). The number of applications fell steadily from FY2005 to FY2008 before rebounding sharply in FY2010. The
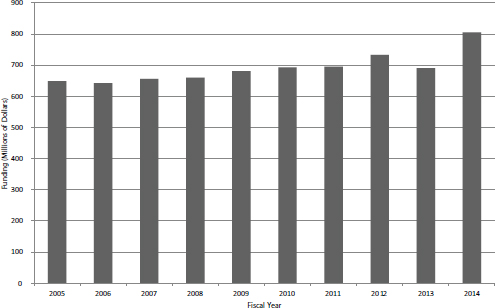
FIGURE 4-4 Total funding for SBIR/STTR, FY2005-2014.
SOURCE: NIH Division of Statistical Analysis and Reporting, Table 126.
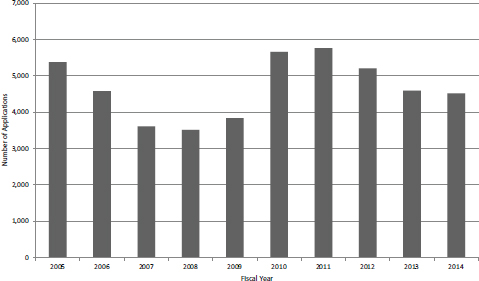
FIGURE 4-5 Number of SBIR Phase I applications, FY2005-2014.
SOURCE: NIH Division of Statistical Analysis and Reporting, Table 216.
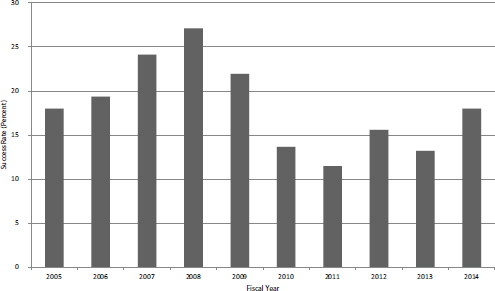
FIGURE 4-6 Success rates for SBIR Phase I applications, FY2005-2014.
SOURCE: NIH Division of Statistical Analysis and Reporting, Table 216.
number declined again, although not to the low of FY2008. Although detailed analysis was not performed, it seems likely that applications are inversely correlated with the availability of seed and venture funding in the wider economy. These sources were squeezed in the financial crash of FY2009-2010.
Over the period as a whole, the average success rate for SBIR Phase I applications was 17.5 percent. Figure 4-6 shows that the rate varied from a low of 11.5 percent in FY2011 to a high of 27.1 percent in FY2008. Given that funding was relatively flat, changes in success rate were largely driven by changes in the number of applications.
SBIR Phase I Grants
SBIR Phase I is the primary gateway into the program. Until FY2014, only Phase I winners could apply for Phase II funding. Figures 4-7 and 4-8 show the number of SBIR Phase I awards and the total amount of funding by year. Figure 4-7 includes competing awards (the initial Phase I award) and noncompeting awards (supplements or add-ons to the initial award). There was an annual average of about 650 new Phase I awards during the study period, although the number declined slightly in recent years. Total funding for new SBIR Phase I grants remained largely flat during the study period, as shown in Figure 4-8, with some recent increases perhaps signaling a new trend toward the end of the period (FY2012 and FY2014).
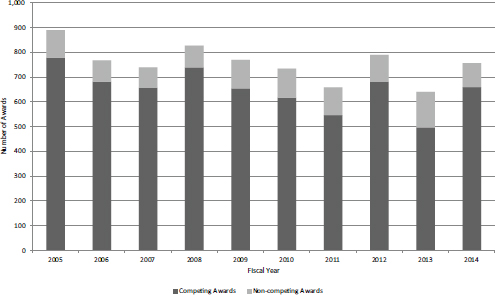
FIGURE 4-7 Number of SBIR Phase I competing and noncompeting grants, FY2005-2014.
SOURCE: NIH Division of Statistical Analysis and Reporting, Table 126.
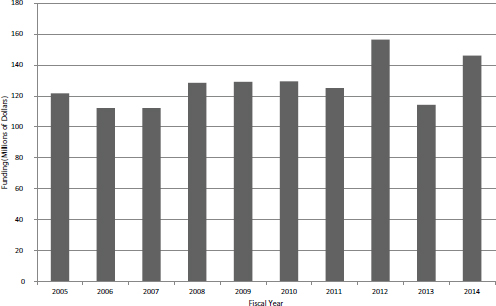
FIGURE 4-8 Total funding for new SBIR Phase I awards, FY2005-2014.
SOURCE: NIH Division of Statistical Analysis and Reporting, Table 126.
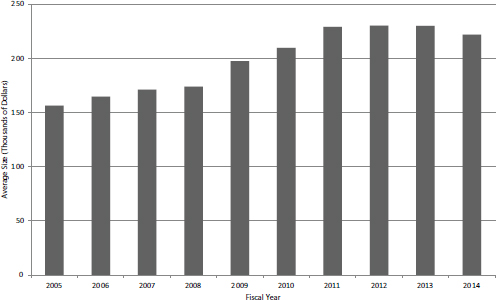
FIGURE 4-9 Average size of new SBIR Phase I awards, FY2005-2014.
SOURCE: NIH Division of Statistical Analysis and Reporting, Table 126.
The decline in the number of new Phase I grants during the study period is reflected in the growth of the average award size, which has been more than $200,000 since FY2010, averaging about $230,000 during FY20102014 (see Figure 4-9).
In addition to competing awards, projects may receive noncompeting awards as supplements of various kinds. Although on average only about 12 percent of new SBIR Phase I awards receive additional support through noncompeting awards, that additional support tends to be larger—an average of $270,000.
SBIR Phase I Contracts
Contracts have until recently constituted a small share of the NIH SBIR program. Traditionally, the focus has been on grants, with contracts being used for technologies that might then be used or needed within NIH. As Figures 4-10 and 4-11 show, that focus changed in FY2014 following a substantial shift from grants to contracts at NCI, where approximately 35 percent of Phase I awards are now made through contracts.
The number of contracts awarded increased during the second half of the study period, with FY2005-2009 averaging 47 annually and FY2010-2013 averaging 77. FY2014 experienced a sharp jump, with the number doubling within that year. Funding levels from contracts showed a smoother growth path, again until FY2014, as shown in Figure 4-11.
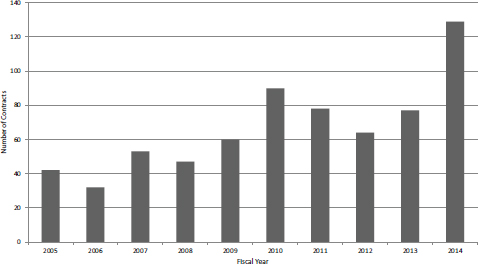
FIGURE 4-10 Number of SBIR Phase I contracts awarded at NIH, FY2005-2014.
SOURCE: NIH Division of Statistical Analysis and Reporting, Table 126.
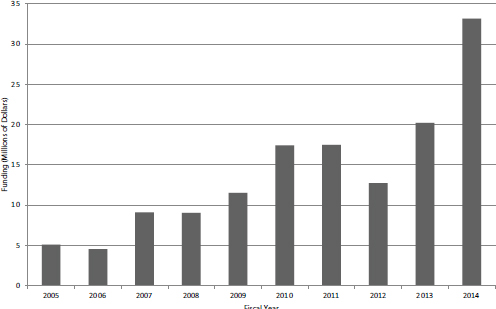
FIGURE 4-11 Funding for SBIR Phase I contracts at NIH, FY2005-2014.
SOURCE: NIH Division of Statistical Analysis and Reporting, Table 126.
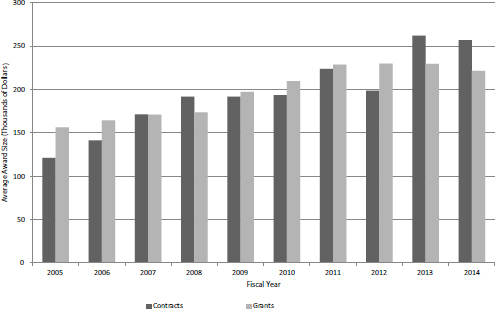
FIGURE 4-12 Average size of new SBIR Phase I contracts and grants at NIH, FY2005-2014.
SOURCE: NIH Division of Statistical Analysis and Reporting, Table 126.
On average, new Phase I contracts did not appear to be either larger or smaller than new Phase I grants, as shown in Figure 4-12. However, contracts were on average larger in FY2013 and FY2014, so it is possible that a new trend is emerging.
Discussions with NCI staff indicate that NCI appears focused on contracts because this mechanism leaves control of selection entirely with the IC (the Center for Scientific Review is not involved in study sections) and because it offers tighter control of the project itself, where payments are linked to milestones not just time and materials.1
SBIR Phase II
To a considerable degree, the distribution of SBIR Phase II awards is driven by the distribution of Phase I awards. Until FY2015, all Phase II awards went to projects that had already received a Phase I award (except for Fast Track awards, see Fast Track section below).
_______________
1See the discussion of contract funding in Chapter 2.
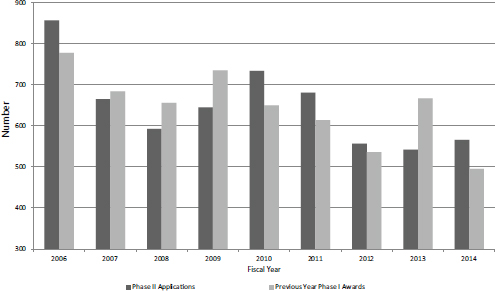
FIGURE 4-13 SBIR Phase II applications and SBIR Phase I awards (lagged 1 year), FY2006-2014.
SOURCE: NIH Division of Statistical Analysis and Reporting, Table 216.
SBIR Phase II Applications and Success Rates
This section covers both grants and contracts because they are not disaggregated in the NIH dataset. As with Phase I, there was a decline across the study period in Phase II applications, mitigated by the apparent response to the financial crash in 2009-2010. Figure 4-13 shows the number of Phase II SBIR applications for FY2006-2014, charted with SBIR Phase I awards lagged by 1 year (so that Phase I awards are matched up with subsequent Phase II applications).2 The Pearson Rho value for this (small) sample is 0.67, indicating strong correlation.
As expected, success rates for Phase II are much higher than those for Phase I. At NIH, these rates are the obverse of application rates: because funding has been largely flat for Phase II, the uptick in applications during the crash led to lower success rates during the study period. Overall, however, rates held between 30 and 40 percent (see Figure 4-14).
SBIR Phase II Grants
Tracking Phase II awards at NIH is a complicated endeavor. The agency distinguishes initially between competing and noncompeting awards. Compet-
_______________
2In some cases the lag is shorter or longer than 1 year, so these data should be viewed as illustrative, not definitive, of the linkage between Phase I awards and Phase II applications.
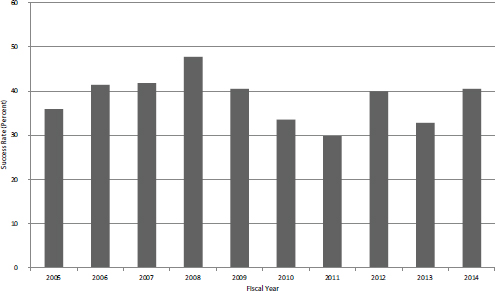
FIGURE 4-14 SBIR Phase II success rates, FY2005-2014.
SOURCE: NIH Division of Statistical Analysis and Reporting, Table 216.
ing awards represent the first year of the Phase II award. Noncompeting awards include the second year of the award, subsequent years of a longer award, supplementary awards of various kinds, and Phase IIB awards. This section differentiates between competing awards, Phase IIB awards, and other noncompeting awards.
SBIR Phase II Grants—Competing Awards
By tracking competing awards, the number of new SBIR Phase II grants by fiscal year can be determined (see Figure 4-15). The number of new SBIR Phase II grants has been declining quite steadily at NIH, from a peak of more than 350 in FY2006 to a low of about 180 in FY2013 before rebounding somewhat to 229 in FY2014. This represents a decline of almost 50 percent, and even smoothing the data suggests that the number of awards has declined by about one-third during the period. Given that overall funding for the program increased by about 12 percent during the study period in nominal terms, the decline in funding for new Phase II grants has several possible explanations, including a shift of program funds to the out years of grants, a shift of funds to contracts, and an increase in funding for STTR.
However, the most immediate explanation lies in the increased size of SBIR Phase II grants. Considering only competing awards (i.e., the first year of a Phase II grant) the average award size increased by about 50 percent over the study period (see Figure 4-16), which almost entirely explains the one-third decline in the number of awards.
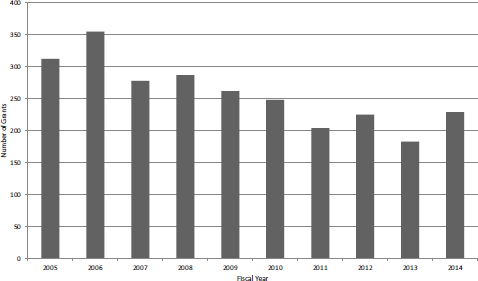
FIGURE 4-15 New NIH Phase II SBIR grants, FY2005-2014.
SOURCE: NIH Division of Statistical Analysis and Reporting, Table 126.
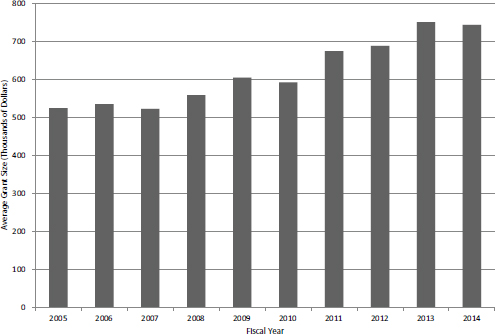
FIGURE 4-16 Average size of first year of competing Phase II SBIR grant, FY2005-2014.
SOURCE: NIH Division of Statistical Analysis and Reporting, Table 126.
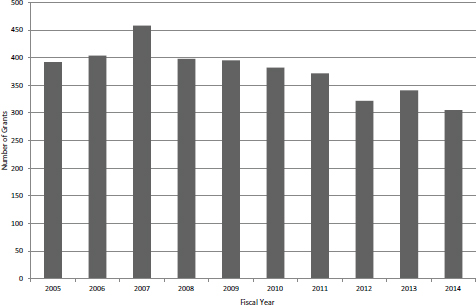
FIGURE 4-17 Number of noncompeting SBIR Phase II grants, FY2005-2014.
SOURCE: NIH Division of Statistical Analysis and Reporting, Table 126.
SBIR Phase II Grants—Non-competing Awards
The aggregate data provided by NIH includes all noncompeting awards, including Phase IIB awards, which are discussed separately below. The data show that, similar to competing awards, the number of noncompeting awards has been declining (see Figure 4-17). Once again, much of the decline is explained by an increase in the average award size, from about $500,000 in FY2005 and FY2006 to almost $700,000 in FY2014 (see Figure 4-18).
SBIR Phase II Contracts
The number of SBIR Phase II contracts more than doubled in FY2014 (see Figure 4-19). This increase is almost entirely accounted for by NCI’s adoption of contracts as an important mechanism. Funding amounts moved in close alignment with the number of awards, again more than doubling in FY2014 (see Figure 4-20). NCI’s use of contracts is discussed above in the section on Phase I contracts.
SBIR Phase IIB Grants
NIH has initiated a special funding program within SBIR to help companies address the formidable financial hurdles involved in meeting the clinical trials requirements imposed by the FDA before products can be brought to market (see Box 4-1). Phase IIB awards (formerly known as competing continuation awards)
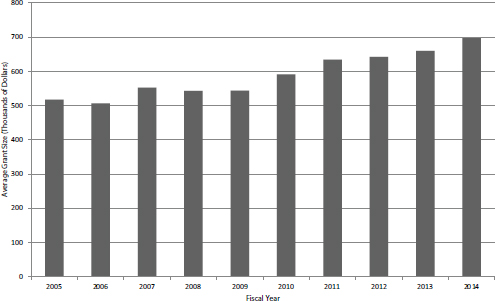
FIGURE 4-18 Average size of SBIR Phase II noncompeting award by fiscal year, FY2005-2014.
SOURCE: NIH Division of Statistical Analysis and Reporting, Table 126.
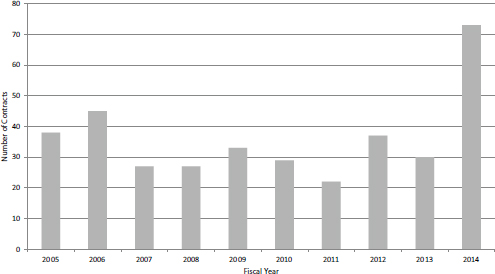
FIGURE 4-19 Number of Phase II SBIR contracts, FY2005-2014.
SOURCE: NIH Division of Statistical Analysis and Reporting, Table 126.
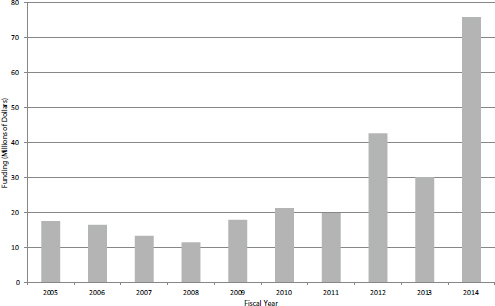
FIGURE 4-20 Funding for SBIR Phase II contracts, FY2005-2014.
SOURCE: NIH Division of Statistical Analysis and Reporting, Table 126.
provide up to $1 million annually for 3 years to support companies engaged with the clinical trials process. Figure 4-21 shows that after the pilot phase in FY2003 and FY2004, the number of Phase IIB SBIR awards settled at about 20 per year. Funding for the program has varied, peaking in FY2006 at almost $80 million, or about 14 percent of total program funding (see Figure 4-22).
Companies can receive more than one Phase IIB award. Two companies received 4 awards, and 22 received 2 or more. Fourteen companies received at least $5 million in Phase IIB funding, which in aggregate was about 20 percent of all program funding (a number of companies with Phase IIB awards are described in Appendix E).
Fast Track
NIH has permitted Fast Track applications for over a decade now. If approved, then a Fast Track award transitions directly from Phase I to Phase II, and no further application is required. Milestones that signal the successful completion of Phase I feasibility studies must be met. The program aims to provide a more rapid transition for projects where the company can present convincing evidence of feasibility, including in many cases preliminary data. Figure 4-23 shows the number of Fast Track SBIR awards, which grew substantially over the study period.
BOX 4-1
Types and Phases of Clinical Trials
There are major differences in the approval procedures for drugs and medical devices. Medical devices are approved by the U.S. Food and Drug Administration (FDA) through the Premarket Approval (PMA) application process. Often a single confirmatory study is sufficient for approval. Drugs are approved through the New Drug Application (NDA) process, which requires a series of clinical trials. In the United States, clinical trials are generally divided into the following phases:
- Preclinical. Experiments involving nonhuman subjects to gather efficacy, toxicity, and pharmacokinetic information.
- Phase 1. Small-scale trials to test a drug on human subjects, often starting with sub-therapeutic doses but then increasing as safety is established. The objective is to determine the safety of the drug for humans.
- Phase 2. Larger scale testing on volunteers (typically 100-300 subjects) to test for efficacy, using a therapeutic dose of the drug.
- Phase 3. Larger scale testing on patients (typically 1,000-2,000 subjects) to determine the drug’s therapeutic effect.
- Phase 4. Sentry studies after the drug is in the marketplace to ensure that new safety or efficacy concerns have not emerged.
- Large-scale clinical trials can be very expensive, running to tens of millions of dollars in some cases.
SOURCE: FDA Drug Approval process, http://www.fda.gov/Drugs/ResourcesForYou/Consumers/ucm289601.htm, accessed February 20, 2014.
This growth means that the share of Fast Track in the broader population of Phase II awards has also grown. Figure 4-24 shows that Fast Track awards are now almost 25 percent of the collective population of Fast Track and Phase II SBIR awards. This growth also means that what was an experimental or pilot program is now well embedded in the NIH SBIR/STTR programs. Given its growing popularity, other agencies should consider pilot projects of their own, because the Fast Track program has multiple potential benefits. It reduces the load on reviewers, provides more certainty for the firm, and essentially eliminates the Phase I-Phase II gap that can pose real problems for small companies. However, it would be important to ensure that the milestones at the end of Phase I are successfully completed and that transition to Phase II does not become a formality. There is no evidence that there are problems in this area.
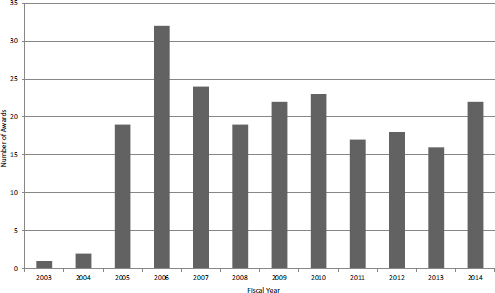
FIGURE 4-21 Number of Phase IIB awards, FY2003-2014.
SOURCE: NIH data provided to NAS, September 2014.
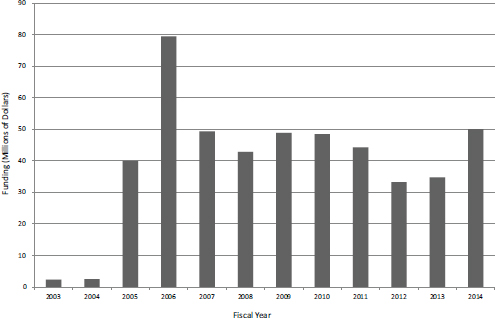
FIGURE 4-22 Funding for Phase IIB awards, FY2003-2014.
SOURCE: NIH data provided to NAS, September 2014.
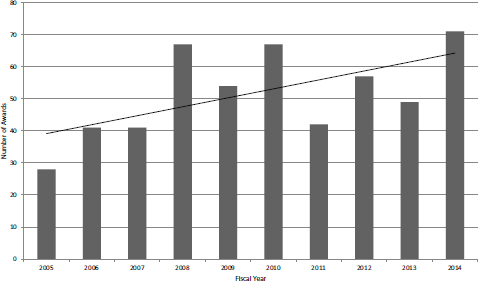
FIGURE 4-23 Number of Fast Track SBIR awards, FY2005-2014.
SOURCE: NIH Division of Statistical Analysis and Reporting, Table 126.
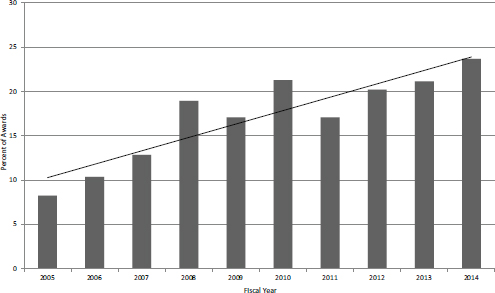
FIGURE 4-24 Fast Track awards as a percentage of Fast Track plus Phase II SBIR awards, FY2005-2014.
SOURCE: NIH Division of Statistical Analysis and Reporting, Table 126.
STTR
STTR Phase I Grants
STTR Phase I Applications and Success Rates
Until FY2013, trends in STTR Phase I applications tracked quite closely with those for SBIR applications. In FY2013 and FY2014, SBIR applications decreased while STTR applications increased, quite sharply in FY2014 (see Figure 4-25). In FY2014, applications increased by more than 50 percent from the low of 508 in FY2011, reaching almost 800 in total. Figure 4-26 compares success rates for STTR Phase I applications and SBIR Phase I applications. In 7 of the 10 years, STTR Phase I had higher success rates, and in 3 years, SBIR Phase I had higher success rates. STTR success rates ranged between about 14 percent and 22 percent, while SBIR success rates ranged between about 12 percent and 27 percent.
STTR Phase I Grants
All STTR awards at NIH are made as grants, so there are no STTR contracts. STTR differs from SBIR in a number of respects. STTR funding is approximately 10 percent of SBIR funding. Across the study period, there was a total of 1,209 new Phase I STTR awards (Figure 4-27), compared with 6,508 new Phase I grants and 672 new Phase I contracts. STTR thus accounted for about 14 percent of all new Phase I awards from FY2005-2014. Funding for STTR Phase I awards de-
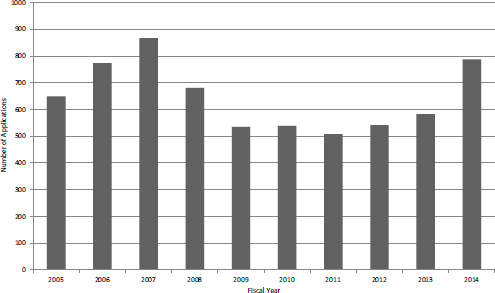
FIGURE 4-25 Number of STTR Phase I applications, FY2005-2015.
SOURCE: NIH Division of Statistical Analysis and Reporting, Table 215.
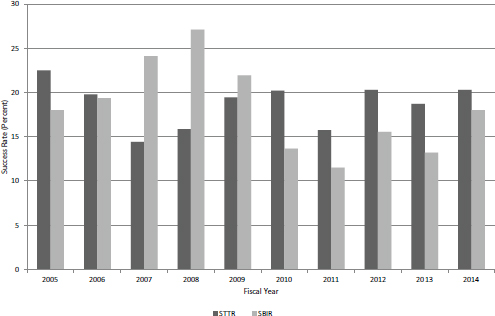
FIGURE 4-26 Success rates for SBIR and STTR Phase I applications, FY2005-2014.
SOURCE: NIH Division of Statistical Analysis and Reporting, Table 215.
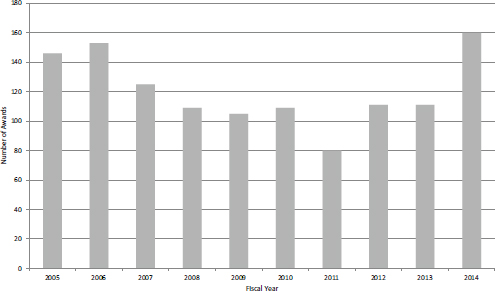
FIGURE 4-27 Number of new STTR Phase I awards, FY2005-2014.
SOURCE: NIH Division of Statistical Analysis and Reporting, Table 126.
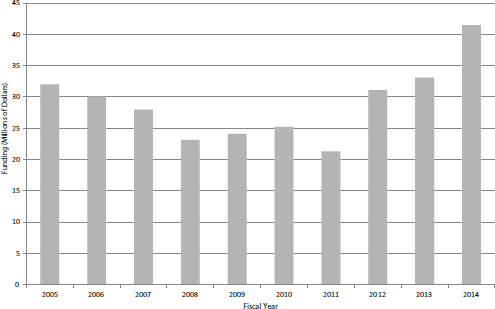
FIGURE 4-28 Funding for NIH STTR awards, FY2005-2014.
SOURCE: NIH Division of Statistical Analysis and Reporting, Table 126.
creased by greater than one-third between FY2006 and FY2011 before increasing quite rapidly, reaching $40 million for the first time in FY2014 (see Figure 4-28).
STTR Phase II
Like SBIR, Phase II accounts for the lion’s share of program funding. However, unlike STTR Phase I, there has been no recent increase in funding for Phase II (see Figure 4-29). Moreover, unlike SBIR—where Phase II awards account for about 70 percent of overall program funding—STTR funding is now divided equally between Phase I and Phase II. Over the same period, the number of new Phase II awards declined somewhat (see Figure 4-30), but this may reverse now that more Phase I grants are being awarded.
New Entrants into the Program and Multiple Award Winners
New Entrants
One important metric for program management is the extent to which the program is open to new applicants and awardees. At NIH every year, about one-third of the companies submitting proposals are new to the program, and about one-quarter of the proposals are from new companies (on average, more expe-
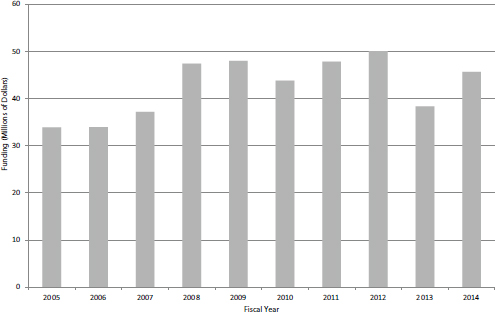
FIGURE 4-29 Funding for STTR Phase II awards, FY2005-2014.
SOURCE: NIH Division of Statistical Analysis and Reporting, Table 126.
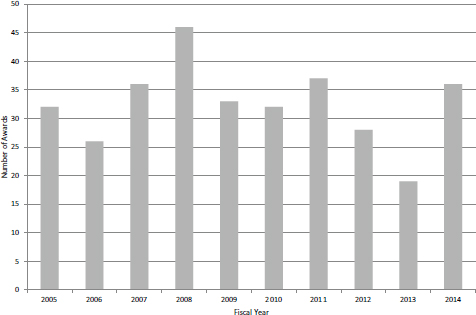
FIGURE 4-30 Number of new Phase II awards, FY2005-2014.
SOURCE: NIH Division of Statistical Analysis and Reporting, Table 126.
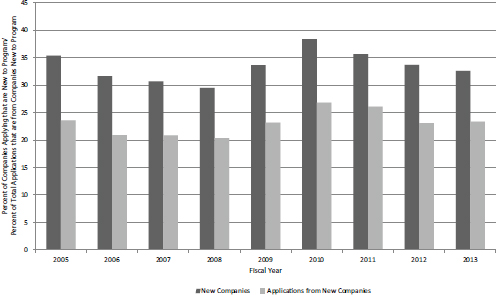
FIGURE 4-31 NIH SBIR/STTR Phase I grants, FY2005-2013: Applications from companies not previously funded by NIH SBIR/STTR.
SOURCE: NIH SBIR Program Office.
rienced companies tend to submit more proposals annually). Figure 4-31 shows the share of new applicant companies and applications from new companies. There was a modest increase in FY2010 (perhaps as other funding became more difficult to find), but overall the figures remained stable over the study period.
The percentage of awarded companies that are new to the program and the percentage of grants made to those companies as a percentage of all grants tracked quite closely with the shares of proposals described above (see Figure 4-32). This suggests that companies with experience in the program do not have a substantial advantage in acquiring funding for subsequent projects. In fact, new companies account for a slightly higher share of grants made than applications submitted, suggesting that they fare slightly better than existing participants in the selection process.
Multiple Award Winners
NIH spreads its awards widely. Table 4-3 shows the Phase I awards and funding provided to the top 20 NIH SBIR/STTR Phase I award winners for FY2005-2014. The most prolific company, Lynntech, received 44 Phase I awards during the 10-year period. Overall, the top 20 companies accounted for 7.7 percent of SBIR/STTR Phase I awards and 8.1 percent of funding. The distribution of Phase II awards and funding is similarly spread out (Table 4-4). The most
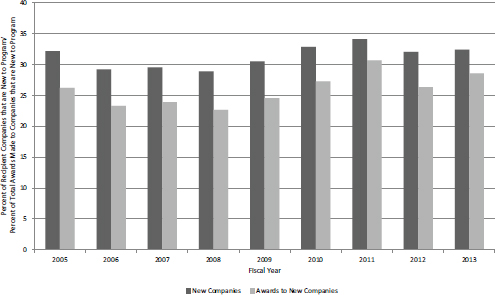
FIGURE 4-32 NIH SBIR/STTR Phase I grants, FY2005-2013: Awards to companies not previously funded by NIH SBIR/STTR.
SOURCE: NIH SBR-STTR Program Office.
prolific Phase II companies, Radiation Monitoring and Praxis, each received 24 awards during the 10-year period. The top 20 awardees (plus one tie) accounted for 9.9 percent of awards and 8.2 percent of funding made during this period. Together, these data show that awards are not heavily concentrated at the company level at NIH. Both the number of awards and the share of awards to the top 20 winners are low relative to other agencies. At DoD for example the top 20 winners accounted for 14.3 percent of awards and 14.4 percent of funding of SBIR Phase I winners.3
Awards and the States
The distribution of awards among states has been a matter of concern for Congress and was discussed extensively in the context of the recent reauthorization. Agencies are now required to report on their effort to encourage applications from underserved states. SBIR awards are not distributed equally among the states, which is not surprising given the uneven distribution of resources and scientific and technical talent across the nation and the merit-based approach of the SBIR program.
_______________
3National Research Council, SBIR at the Department of Defense, Washington, DC: The National Academies Press, 2015, Table 2-3.
TABLE 4-3 Awards and Funding, Top 20 NIH SBIR/STTR Phase I Award Winners, FY2005-2014
| Company Name | Number of Awards | Funding (Dollars) |
| LYNNTECH, INC. | 44 | 9,025,700 |
| PANORAMA RESEARCH, INC. | 43 | 9,060,220 |
| RADIATION MONITORING DEVICES, INC. | 40 | 6,010,950 |
| MICROBIOTIX, INC. | 38 | 21,567,426 |
| ADVANCED MEDICAL ELECTRONICS CORPORATION | 38 | 7,153,653 |
| PHYSICAL SCIENCES, INC. | 37 | 7,753,637 |
| OREGON CENTER FOR APPLIED SCIENCE, INC. | 33 | 6,869,913 |
| ANGION BIOMEDICA CORPORATION | 32 | 8,477,366 |
| P2D, INC. | 28 | 7,893,568 |
| KORONIS BIOMEDICAL TECHNOLOGIES CORPORATION | 27 | 4,416,605 |
| RADIKAL THERAPEUTICS, INC. | 26 | 7,210,799 |
| L2 DIAGNOSTICS, LLC | 25 | 9,351,615 |
| AFFINERGY, INC | 25 | 6,775,632 |
| PROGENRA, INC. | 23 | 6,035,889 |
| INFLEXXION, INC. | 23 | 4,048,479 |
| CLEVELAND MEDICAL DEVICES, INC. | 23 | 6,259,675 |
| SOCIOMETRICS CORPORATION | 22 | 4,829,713 |
| LUCIGEN CORPORATION | 22 | 4,368,269 |
| COGNOSCI, INC. | 22 | 5,723,741 |
| BARRON ASSOCIATES, INC. | 20 | 3,347,622 |
| Total | 591 | 146,180,472 |
SOURCE: NIH data provided by NIH SBIR/STTR Program Office.
SBIR Phase I awards and applications for each state from FY2005-2014 are provided in Table 4-5. As expected the large states and research-intensive states had more applications and more awards. In addition, the success rates of different states varied widely.
However, reviewing the number of awards alone is of little analytic use: that number is largely driven by state population, so initial analysis must consider applications normalized for population. That rate is provided in Table 4-5 and reveals very large disparities. At the top end, Massachusetts generated more than 850 Phase I SBIR applications per 100,000 population, and both Wisconsin and Maryland generated more than 550. Six states (Nevada, Louisiana, Mississippi, Idaho, Alaska, and West Virginia) generated fewer than 50 such applications.
TABLE 4-4 Awards and Funding, Top 20 NIH SBIR/STTR Phase II Award Winners, FY2005-2014
| Company Name | Number of Awards | Funding (Dollars) |
| RADIATION MONITORING DEVICES, INC. | 24 | 21,820,506 |
| PRAXIS, INC. | 24 | 16,397,125 |
| OREGON CENTER FOR APPLIED SCIENCE, INC. | 21 | 26,136,560 |
| PHYSICAL SCIENCES, INC. | 15 | 13,105,723 |
| NEW ENGLAND BIOLABS, INC. | 15 | 8,504,170 |
| INFLEXXION, INC. | 15 | 18,262,357 |
| TRANSCENDENT INTERNATIONAL, LLC | 14 | 16,799,671 |
| ADVANCED MEDICAL ELECTRONICS CORPORATION | 14 | 14,262,176 |
| ANGION BIOMEDICA CORPORATION | 13 | 22,843,573 |
| NOVELMED THERAPEUTICS, INC. | 12 | 9,817,808 |
| BARRON ASSOCIATES, INC. | 12 | 10,261,347 |
| SOCIOMETRICS CORPORATION | 11 | 9,043,544 |
| MC3, INC. | 11 | 6,987,602 |
| LYNNTECH, INC. | 11 | 11,309,483 |
| KDH RESEARCH AND COMMUNICATION, INC. | 11 | 6,100,073 |
| TALARIA, INC. | 10 | 11,133,879 |
| ISA ASSOCIATES, INC. | 10 | 6,363,783 |
| 3-C INSTITUTE FOR SOCIAL DEVELOPMENT | 10 | 10,600,351 |
| QUANTUMBIO, INC. | 9 | 4,596,024 |
| DNA SOFTWARE, INC. | 9 | 3,093,901 |
| BIOSTATISTICAL PROGRAMMING ASSOC, INC. | 9 | 5,489,489 |
| Total | 280 | 252,929,145 |
SOURCE: NIH data provided by NIH SBIR/STTR program office.
This disparity in application rates may be explained by the small share of working scientists and engineers in low-award states. Figure 4-33 presents a scatterplot of applications per 100,000 population and number of science and engineering PhDs per 1,000 population. Statistical analysis using the Pearson test generates a result of 0.67, which indicates strong correlation between the number of applications (normalized) and the presence of PhD scientists and engineers.
Two outliers are excluded from the chart to permit a clearer visualization of the data for the remaining states. (The District of Columbia is excluded because its share of PhDs is four times greater than any other state, and Massachusetts has 50 percent more applications per capita than any other state. Both are included in
TABLE 4-5 NIH SBIR Phase I Applications and Awards, by State, FY2005-2014
| State | Number of Applications | Number of Awards | Success Rate (Percent) | Applications per 100,000 Population |
| AL | 539 | 96 | 17.8 | 112.8 |
| AK | 12 | 2 | 16.7 | 16.9 |
| AR | 608 | 130 | 21.4 | 95.1 |
| AZ | 348 | 81 | 23.3 | 119.3 |
| CA | 10,907 | 2,143 | 19.6 | 292.8 |
| CO | 1,435 | 293 | 20.4 | 285.3 |
| CT | 787 | 164 | 20.8 | 220.2 |
| DE | 195 | 37 | 19.0 | 324.1 |
| DC | 145 | 28 | 19.3 | 161.5 |
| FL | 1,224 | 193 | 15.8 | 65.1 |
| GA | 890 | 182 | 20.4 | 91.9 |
| HI | 103 | 12 | 11.7 | 75.7 |
| ID | 40 | 7 | 17.5 | 25.5 |
| IL | 965 | 204 | 21.1 | 75.2 |
| IN | 744 | 145 | 19.5 | 114.7 |
| IO | 303 | 58 | 19.1 | 99.5 |
| KS | 196 | 43 | 21.9 | 68.7 |
| KY | 652 | 136 | 20.9 | 150.3 |
| LA | 223 | 29 | 13.0 | 49.2 |
| ME | 121 | 20 | 16.5 | 91.1 |
| MD | 3,280 | 595 | 18.1 | 568.1 |
| MA | 5,601 | 1,301 | 23.2 | 855.4 |
| MI | 1,287 | 295 | 22.9 | 130.2 |
| MN | 1,145 | 263 | 23.0 | 215.9 |
| MS | 80 | 6 | 7.5 | 27.0 |
| MO | 635 | 121 | 19.1 | 106.0 |
| MT | 194 | 37 | 19.1 | 196.1 |
| NE | 181 | 32 | 17.7 | 99.1 |
| NV | 130 | 14 | 10.8 | 48.1 |
| NH | 392 | 85 | 21.7 | 297.8 |
| NJ | 1,521 | 246 | 16.2 | 173.0 |
| NM | 422 | 85 | 20.1 | 204.9 |
| NY | 2,834 | 594 | 21.0 | 146.2 |
| State | Number of Applications | Number of Awards | Success Rate (Percent) | Applications per 100,000 Population |
| NC | 2,064 | 502 | 24.3 | 216.5 |
| ND | 52 | 12 | 23.1 | 77.3 |
| OH | 1,704 | 330 | 19.4 | 147.7 |
| OK | 271 | 51 | 18.8 | 72.2 |
| OR | 976 | 321 | 32.9 | 254.8 |
| PA | 2,429 | 513 | 21.1 | 191.2 |
| RI | 267 | 57 | 21.3 | 253.7 |
| SC | 391 | 78 | 19.9 | 84.5 |
| SD | 81 | 4 | 4.9 | 99.5 |
| TN | 399 | 63 | 15.8 | 62.9 |
| TX | 2,599 | 469 | 18.0 | 103.4 |
| UT | 694 | 127 | 18.3 | 251.1 |
| VT | 154 | 45 | 29.2 | 246.1 |
| VA | 1,529 | 258 | 16.9 | 191.1 |
| WA | 1,546 | 359 | 23.2 | 229.9 |
| WV | 64 | 2 | 3.1 | 11.3 |
| WI | 1,055 | 283 | 26.8 | 569.3 |
| WY | 63 | 8 | 12.7 | 111.8 |
| Total | 54,477 | 11,159 | 20.5 | 176.4 |
the Pearson analysis above.) Aside from New Mexico, where the share of science and engineering PhDs is inflated by the presence of Los Alamos, and Maryland and Wisconsin, which are outliers in generating more than their share of applications, the picture is very consistent: the presence of more scientists and engineers is closely correlated with more applications. It is also true that S&T resources are not uniformly distributed within a state, but rather tend to cluster around universities or research parks or research labs, and it is from those clusters that most applications come. This would suggest that substantial outreach to increase the number of applications from underserved states may not be successful in generating awards.
Unsurprisingly, given their large shares of applications, Massachusetts, Maryland, and Wisconsin also accounted for the largest shares of awards normalized for population, all with more than 10 awards per 100,000 population. Conversely, 10 states had 1 or fewer awards per 100,000 population. The average number for all states was 3.6 per 100,000 population. Success rates for applica-
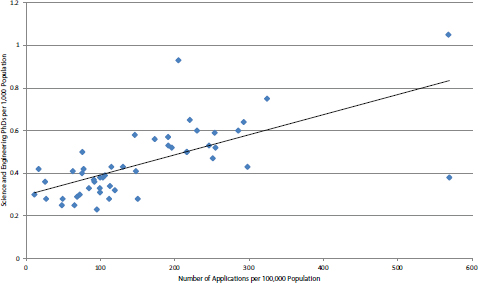
FIGURE 4-33 NIH SBIR Phase I: Distribution of applications by science and engineering PhDs, normalized for population.
SOURCE: NIH applications data (Table 216) and NSF Science and Engineer Indicators.
tions varied substantially from a high of 32 percent for Oregon to a low of less than 10 percent for West Virginia, Mississippi, and South Dakota. The average for all states was slightly greater than 20 percent across the study period.
Perhaps surprisingly, success rates across all states are not particularly well correlated with science and engineering PhDs in the workforce (see Figure 4-34). The Pearson value is 0.28. However, it is also apparent that states with very low shares of scientists and engineers also tend to have very low success rates—see circled group in Figure 4-34, where seven of the eight states with the lowest success rates also have low shares of scientists and engineers. Therefore, it appears there may be a threshold effect in which a certain density of science and engineering PhDs are necessary to develop sufficiently attractive applicants.
Understanding Low-award States
Three factors appear to play a role, to different degrees for different states, in why some states receive fewer NIH SBIR awards.
- Some states do not have a great deal of science and engineering resources. The average number of science and engineering PhDs per thousand employed for all states is 0.55. For the 10 lowest award states, it is 0.37.
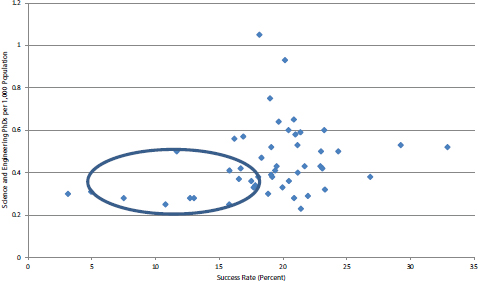
FIGURE 4-34 NIH SBIR Phase I: Distribution of state success rates by science and engineering PhDs, normalized for population.
SOURCE: NIH applications data (Table 216) and National Science Board, Science and Engineer Indicators 2014, Arlington, VA: National Science Foundation, Chapter 4.
- Fewer applications. Less science and engineering resources likely leads in part to the second direct factor—fewer applications. The 10 lowest award states generated an average of 48.1 applications per 100,000 population over the study period. The average for all states (including low performers) was 176.4.
- Lower success rates. The average success rate for all states was 20.1 percent. For the lowest award states, it was 14.1 percent. The state with the highest application rate among this group (South Dakota) had one of the lowest success rates. Although the numbers are small, it is apparent that there is no correlation between application rates and success rates for the low award states (Pearson Rho = -0.07).
The evidence overall suggests that low application rates do tend to generate low numbers of awards, but that low application rates themselves result partly from demographics (population) and partly from the distribution of science and engineering resources in the workforce. In attempting to generate more applications from low-award states, a strategy will be to target outreach at identifiable clusters of science and engineering resources within a state.


