
Appendix G
Annex to Chapter 5: Quantitative Outcomes
Supplementing the analysis found in Chapter 5, this appendix reports the results of quantitative outcomes of the SBIR/STTR programs in further detail, as drawn from the 2011-2014 Academies Phase II survey. It focuses on the congressionally mandated objective for the STTR program—connecting SBCs to RIs—and also covers the other outcomes that are important to the agencies and the Congress, notably commercialization and the role of women and minorities.
CONNECTING SMALL BUSINESS CORPORATIONS (SBCs) TO RESEARCH INSTITUTIONS (RIs)
The survey asked several questions about the use of university staff and facilities on the surveyed project. The answers reveal substantial differences between SBIR and STTR respondents. Overall, 95 percent of STTR respondents reported a university connection of some kind, while only 46 percent of SBIR respondents did so.
There were also substantial differences between SBIR and STTR regarding the kind of university linkage. Thirty-two percent of STTR respondents, but only 3 percent of SBIR respondents, reported that the principal investigator (PI) was a university faculty member. STTR respondents were also more likely to report that faculty members worked on the project as a consultant (53 percent), that graduate students worked on the project (51 percent), that technology was licensed from the RIs (18 percent), and that the technology was originally developed at the RI by a project team member (29 percent) (see Table G-1). Overall, it seems clear that the university connection is much deeper and richer for STTR awards.
Respondents were also asked to identify the universities with which they worked in various capacities on this project. Although the type of help varied widely, some universities were mentioned by a number of respondents.
TABLE G-1 Links to Universities
| Percentage of Responses | ||
| STTR Awardees | SBIR Awardees | |
| The PI for this project was at the time of the project an RI faculty member | 32.3 | 2.8 |
| The PI for this project was at the time of the project an RI adjunct faculty member | 2.3 | 5.3 |
| Faculty member(s) or adjunct faculty member(s) worked on this project in a role other than PI | 53.0 | 26.0 |
| Graduate students worked on this project | 51.1 | 20.3 |
| The technology for this project was licensed from an RI | 18.4 | 6.9 |
| The technology for this project was originally developed at an RI by one of the participants in this project | 29.3 | 11.1 |
| An RI was a subcontractor on this project | 70.3 | 25.8 |
| None of the above | 4.5 | 53.7 |
| BASE: TOTAL RESPONDENTS ANSWERING QUESTION | 266 | 1,795 |
SOURCE: 2011-2014 Survey, Question 71.
Overall, 167 different RIs were identified from 292 projects. Those mentioned by four or more respondents are listed in Table G-2 (see Appendix D for the complete list of university mentions). Some of the names on this list are large state universities, a number of which have in recent years focused on technology transition as well as basic research. Although far from a perfect metric, we believe these data provide a preliminary indication of the connections between specific universities, university systems, and the STTR program.
STTR respondents were asked about the impact of the award on their relationship with the RI. Despite the difficulties described by some respondents and interviewees described in Chapter 4, 71 percent of respondents said that the award substantially or somewhat enhanced that relationship, while just 5 percent said that it worsened the relationship (see Table G-3). Almost three-quarters of STTR respondents indicated that they had a preexisting relationship with the RI already in place, which suggests that creating new relationships is perhaps a less important feature of the program.1
About eight percent of STTR respondents also received an SBIR award in which they had collaborated with an RI.2 Among those who had received both SBIR and STTR awards, respondents were approximately evenly divided as to whether there were significant differences between SBIR and STTR.3 This may
________________
12011-2014 Survey, Question 75.
22011-2014 Survey, Question 77.
32011-2014 Survey, Question 78.
TABLE G-2 University Participants Mentioned by Four or More Respondents
| Research Institution | Number of Mentions |
| University of Florida | 9 |
| Pennsylvania State University | 7 |
| MIT | 6 |
| University of Kentucky | 6 |
| University of Massachusetts Medical School | 6 |
| Rensselaer Polytechnic Institute | 5 |
| University of Colorado-Boulder | 5 |
| Vanderbilt University | 5 |
| Boston University | 4 |
| Georgia Tech | 4 |
| Indiana University | 4 |
| Johns Hopkins University | 4 |
| Lawrence Berkeley National Laboratory | 4 |
| National High Magnetic Field Laboratory (NHMFL) | 4 |
| Texas A&M University | 4 |
| University of California Berkeley | 4 |
| University of Illinois-Chicago | 4 |
| University of Minnesota | 4 |
SOURCE: 2011-2014 Survey, Question 72.
simply reflect the differing practices of the awarding agency—as described in Chapter 2, for NIH, DoE, and NSF there are effectively no programmatic differences.
Almost one-half also indicated that STTR was more difficult to manage (see Figure G-1). Only 3 percent thought STTR was easier to manage. This corresponds with the views expressed in Chapter 4.
Survey respondents generally agreed that the share of funding going to the RI should not be increased—only about 18 percent agreed with this concept (see Table G-4).
It is also worth observing that company founders are closely connected to the universities. For almost 80 percent of STTR companies in the sample, at least one founder had an academic background (see Table G-5).
BOX G-1
Workshop on Improving University-SBIR/STTR Linkages
A workshop convened on February 5, 2014, at the committee considered a range of issues concerning universities and the SBIR/STTR programs.a Participants at this workshop discussed a range of topics including
- Improving linkages between the SBIR/STTR programs at agencies and the universities,
- Aligning with university accelerator initiatives,
- Supporting improved links between state and local innovation and entrepreneurship programs and the universities, and
- Supporting shifts in culture at universities to incentivize faculty to pursue SBIR/STTR funding.b
________________
aSee http://sites.nationalacademies.org/PGA/step/sbir/PGA_086819.htm.
bThese issues and others related to the SBIR/STTR programs and universities will be addressed in detail in a forthcoming Academy report on the NASA SBIR program.
TABLE G-3 STTR Impacts on SBC-RI Relationships
| Percentage of Responses | |
| Substantially enhanced it | 37.8 |
| Somewhat enhanced it | 33.2 |
| Made no real difference | 23.7 |
| Made it somewhat worse | 4.6 |
| Made it substantially worse | 0.8 |
| BASE: STTR AWARD RECIPIENTS | 262 |
SOURCE: 2011-2014 Survey, Question 74.
While 56 percent of company founders were previously employed at other private companies, 59 percent of respondents reported at least one founder previously employed at an RI or a National Lab (see Table G-6).
THE FOCUS ON COMMERCIALIZATION OUTCOMES
Although the statutory goal for the STTR program is to enhance linkages between RIs and SBCs, as a practical matter, STTR programs are still largely judged by their success in commercializing technologies.4 Moreover, given that commercialization is among the more measurable outcomes of the
________________
4SBA, Section 1.(c), STTR Policy Directive, October 18, 2012, p. 3.
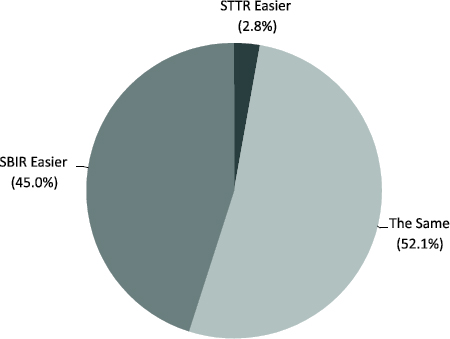
FIGURE G-1 Comparative ease of managing SBIR and STTR.
SOURCE: 2011-2014 Survey, Question 80. N=211.
TABLE G-4 Increased Share of Funding for Research Institutions
| Percentage of Responses | |
| Strongly agree | 8.6 |
| Somewhat agree | 9.0 |
| Neither agree nor disagree | 31.6 |
| Somewhat disagree | 23.7 |
| Strongly disagree | 27.1 |
| BASE: STTR AWARD RECIPIENTS | 266 |
SOURCE: 2011-2014 Survey.
SBIR/STTR programs, it has become a primary benchmark for program performance. The focus on commercialization, however, should not be allowed to obscure the requirement that the program meet all congressionally mandated objectives. This appendix provides additional details of the commercial outcomes of the SBIR/STTR programs, as well as quantitative outcome measures related to expanding the U.S. science and engineering base.
TABLE G-5 Number of Academic Founders
| Percentage of Company Responses | ||
| STTR Awardees | SBIR Awardees | |
| 0 | 21.2 | 27.7 |
| 1 | 36.0 | 42.2 |
| 2 | 25.3 | 18.1 |
| 3 | 11.8 | 6.7 |
| 4 | 3.0 | 3.6 |
| 5 or more | 2.6 | 1.8 |
| Mean | 1.50 | 1.24 |
| Median | 1.00 | 1.00 |
| BASE: TOTAL RESPONDENTS ANSWERING QUESTION | 168 | 1,017 |
NOTE: Because multiple responses were received from some companies, responses here are weighted to provide the average response per company.
SOURCE: 2011-2014 Survey, Question 5.4.
TABLE G-6 Prior Employment of Founders
| Percentage of Company Responses | ||
| STTR Awardees | SBIR Awardees | |
| Other private company | 55.9 | 64.8 |
| Research institution | 57.3 | 40.1 |
| Government | 7.2 | 6.5 |
| FFRDCs or National Labs | 1.4 | 0.9 |
| Other | 3.9 | 8.3 |
| BASE: TOTAL COMPANIES ANSWERING QUESTION | 173 | 1,039 |
NOTE: Because multiple responses were received from some companies, responses here are weighted to provide the average response per company.
SOURCE: 2011-2014 Survey, Question 6.
SOURCES OF DATA
All the major SBIR agencies either have in place data collection systems related to outcomes from SBIR/STTR awards or are putting such systems in place.
- DoD continues to maintain the Company Commercialization Record (CCR), which requires all companies applying for DoD SBIR/STTR funding to update outcomes for all prior awards.
- NSF utilizes a consultant to undertake phone interviews with recipients at set times certain years after the end of the award.
- DoE maintains internal tracking of award outcomes using its own metrics and methodologies.
- NASA developed a tracking module as part of its Electronic Hand Book, which has in recent years been used to begin collecting outcomes data.
- NIH is seeking to work closely with SBA as the latter develops a tracking system, and it is also working to improve its own data collection and analytics system beyond the current limited scale and scope.
However, these approaches do not generate comparable data. The agencies use different mechanisms for collecting data, ask companies different questions, and provide different levels of data access to the Academies (e.g., DoD provided complete access to the CCR data set, while NSF declined to provide its outcomes data on privacy grounds). Because of the lack of comparable data across all agencies, the quantitative data presented in this chapter are derived from the Academies 2011-2014 Phase II survey of award recipients. However, these data are descriptive only and should be regarded as providing insights into outcomes rather than definitive conclusions.5
The 2011-2014 Survey fielded by the Academies was based primarily on the previous 2005 Academies survey, with some additions and modifications. The survey was deployed twice: to DoD, NSF, and NASA award recipients in 2011 (covering awards made in FY1998-2007 inclusive) and to NIH and DoE award recipients in 2014 (covering awards made in FY2001-2010 inclusive). These award time frames are referred to as the “study period” throughout this report.
The 2011-2014 Survey was sent to all PIs who received an SBIR/STTR or STTR Phase II award from one of the five study agencies during the study period. In an effort to improve response rates for NIH and DoE, when a PI could not be reached, the survey was sent to alternate company contacts at the targeted companies (which generated approximately 100 additional responses).
Appendix A provides a detailed discussion of the survey methodology, including response rates and potential survey bias. The text below provides a full series of tables summarizing Phase II responses for STTR and SBIR recipients. The 2011-2014 Survey is reproduced in Appendix C.
________________
5The committee previously sought to develop statistical comparisons with similar companies in similar sectors at similar stages of development, but these efforts were eventually abandoned as unworkable. See Appendix A for a discussion of this effort. A full description of the methodology employed for this survey and the resulting analysis is also provided in Appendix A.
COMMERCIALIZATION
The agencies vary considerably in their use of STTR, which is reflected in their differing views of commercialization, described in more detail in the series of Academies reports on the individual agencies. Nonetheless, there are data and related metrics that help to provide useful insights into commercialization across all the agencies.
Defining “Commercialization”
Several important conceptual challenges emerge when seeking to define “commercialization” for the purposes of the SBIR and STTR programs. Like many apparently simple concepts, commercialization becomes progressively more difficult and complex as it is subjected to further scrutiny. For example:
- Should commercialization include just sales or other kinds of revenue as well, such as licensing fees and funding for further development?
- Should commercialization include only certain kinds of sales—excluding, for example, sales to government agencies?
- What is the appropriate benchmark for sales? Is it any sales whatsoever, sufficient sales to cover the costs of awards, sales that lead to breaking even on a project, or sales that reflect a commercial level of success and viability? The latter at least would likely be different for each project in each company.
- Should commercialization include sales by licensees, which may be many multiples of royalty revenues provided to STTR recipients, but are more difficult to track and to assign causality to specific STTR awards?
For the purposes of this study, we deployed a broad net to capture a range of potentially useful data. We include all revenues related to the funded project. We count all sales to any customer as a sale. We exclude all revenues from licensees because we do not believe the data reported by the original technology developer are likely to be sufficiently accurate, even though in some important cases licensees do use SBIR/STTR-developed technologies to build large-scale businesses. This approach is identical to that used in all previous Academies studies of the SBIR program. Once acquired, these data can be analyzed in a variety of ways to provide multiple insights into this complex topic.6
________________
6For an overview of the commercialization metrics and survey used in this study, see Appendix A.
Project-related Revenues
Perhaps the single most used metric for assessing SBIR-type programs is project-related revenues. Although previous Academy reports have cautioned against overuse of this metric—warnings that are reflected in the wide range of metrics adopted for use in the current assessment—project-related revenues are still an important metric.7
Reaching the market. The first survey question in this area concerns reaching the market: Did the project generate any sales, and if not, are sales expected (a necessary question given the long cycle time of some projects)? Responses are summarized in Table G-7. Slightly less than 40 percent of STTR projects reported some sales or licensing revenues, compared with 49 percent of SBIR projects. A further 28 percent of STTR respondents expected sales in the future, compared with 24 percent of SBIR respondents. This suggests that STTR projects may on average have a longer cycle.
Amount of Sales and Licensing Revenues. The percentage of projects reaching the market is an important metric, but it is not sufficient. It is also important to understand the distribution of sales. The survey asked those respondents who reported some sales of the technology developed for the project to report the amount of sales, divided into dollar ranges (see Table G-8).
TABLE G-7 SBIR/STTR Sales
| Percentage of Responses | ||
| STTR Awardees | SBIR Awardees | |
| No sales to date | 60.1 | 50.7 |
|
No sales to date nor are sales expected |
32.1 | 26.2 |
|
No sales to date, but sales are expected |
28.0 | 24.5 |
| Any sales to date | 39.9 | 49.3 |
|
Sales of product(s) |
30.6 | 36.1 |
|
Sales of process(es) |
1.8 | 4.6 |
|
Sales of services(s) |
14.4 | 22.0 |
| Other sales (e.g., rights to technology, licensing, etc.) | 6.6 | 7.1 |
| BASE: TOTAL RESPONDENTS ANSWERING QUESTION | 271 | 1,856 |
NOTE: Respondents could select multiple types of sales for a single project, so percentages for types of sales do not sum to “Any sales to date.”
SOURCE: 2011-2014 Survey, Question 32.
________________
7Similar warnings can be found in the 2009 report on the NIH SBIR program by The Academies—National Research Council, An Assessment of the SBIR Program at the National Institutes of Health, Washington, DC: The National Academies Press, p. 81.
TABLE G-8 Distribution of Total Sales, by Range and Phase
| Percentage of Responses | ||
| STTR Awardees | SBIR Awardees | |
| None ($0) | 3.1 | 3.0 |
| Under $100,000 | 25.5 | 27.0 |
| $100,000-$499,999 | 33.7 | 27.0 |
| $500,000-$999,999 | 17.3 | 13.1 |
| $1,000,000-$4,999,999 | 14.3 | 21.1 |
| $5,000,000-$9,999,999 | 4.1 | 4.6 |
| $10,000,000-$19,999,999 | 1.0 | 2.0 |
| $20,000,000-$49,999,999 | 1.0 | 1.4 |
| $50,000,000 or more | 0.7 | |
| Mean (Thousands of Dollars) | 1,488.8 | 2,479.5 |
| Median (Thousands of Dollars) | 300 | 300 |
| BASE: ANY SALES RESULTING FROM THE PROJECT | 98 | 862 |
SOURCE: 2011-2014 Survey, Question 34.
Most respondents reported sales at the lower end of the ranges: 62 percent of STTR respondents reported revenues of less than $500,000, compared with 57 percent of SBIR respondents. One percent reported revenues of at least $20 million. The substantially different means indicate important positive outliers in the SBIR group but not in the STTR group. There was no difference between the groups in the medians.
Markets by Sector
The survey asked respondents about the market sectors in which sales were made. Overall, 40 percent of respondents identified the domestic private sector, followed by DoD and DoD contractors combined (25 percent), and export markets (17 percent) (see Table G-9). No other single sector reached 5 percent. The market by sector varies substantially by agency—for example, DoD projects largely focus on DoD markets, while NIH and NSF projects largely focus on the domestic private sector.
EMPLOYMENT
As with prior surveys, respondents were asked both about the size of the company at the time of the award and the current size, in terms of number of employees. Table G-10 shows that the median and mean of employees for STTR
TABLE G-9 Markets for STTR and SBIR Products and Services
| Percentage of Total Sales | ||
| STTR Awardees | SBIR Awardees | |
| Domestic private sector | 39.8 | 39.0 |
| Export markets | 16.6 | 11.5 |
| Department of Defense (DoD) | 14.4 | 17.4 |
| NASA | 2.0 | 2.7 |
| Prime contractors for DoD | 10.4 | 10.5 |
| Prime contractors for NASA | 0.5 | 0.9 |
| Agency that awarded the Phase II (if not NASA or DoD) | 1.8 | 1.2 |
| Other federal agencies | 3.5 | 4.2 |
| State or local governments | 0.4 | 2.5 |
| Other | 10.6 | 10.1 |
| BASE: ANY SALES RESULTING FROM THE PROJECT | 99 | 889 |
NOTE: Respondents were asked to provide a percentage breakdown by market. The table shows the mean of responses for each category.
SOURCE: 2011-2014 Survey, Question 35.
TABLE G-10 Number of Employees at Time of Award
| STTR (Percentage of Companies Responding) |
|
| 0 | 1.2 |
| 1 | 6.3 |
| 2 | 10.1 |
| 3 or 4 | 19.6 |
| 5 to 9 | 25.6 |
| 10 to 19 | 15.2 |
| 20 to 49 | 13.0 |
| 50 to 99 | 4.9 |
| 100 or more | 4.0 |
| Mean | 19 |
| Median | 6 |
| BASE: TOTAL RESPONDENTS ANSWERING QUESTION | 163 |
NOTE: For questions where company (rather than project) responses are reported, SBIR responses are not included because in many cases STTR winners also received SBIR awards and vice versa.
SOURCE: 2011-2014 Survey, Question 14.1.
companies were 6 and 19, respectively, at the time of the award. Both numbers are smaller than for SBIR companies, of which some had 100 or more employees and fewer had 0-2 employees.
For current employees, STTR respondents reported that the median number grew from 6 to 7, The mean size expanded for from 19 to 50. Seven percent of STTR companies reported at least 100 employees (see Table G-11). For STTR, current employment is still concentrated in the smallest firms, with 57 percent of respondents indicating current company size as 9 or less.
ADDITIONAL INVESTMENT
The ability of projects and companies to attract additional investment has traditionally been a defining metric for SBIR/STTR commercialization outcomes.8 There has also been interest in the sources of additional funding for high-tech innovation because the United States has historically been at the forefront of venture capital and angel investment.
Seventy-one percent of STTR respondents indicated that their company had received additional investment in the technology related to the surveyed project. As with prior surveys, there is substantial skew with regard to the
TABLE G-11 Number of Employees at Time of Survey
| STTR (Percentage of Companies Responding) |
|
| 0 | 10.8 |
| 1 | 5.0 |
| 2 | 8.0 |
| 3 or 4 | 11.9 |
| 5 to 9 | 21.1 |
| 10 to 19 | 18.0 |
| 20 to 49 | 11.5 |
| 50 to 99 | 6.6 |
| 100 or more | 7.3 |
| Mean | 50 |
| Median | 7 |
| BASE: TOTAL COMPANIES ANSWERING QUESTION | 161 |
SOURCE: 2011-2014 Survey, Question 14.2.
________________
8See National Research Council, An Assessment of the SBIR Program, Washington, DC: The National Academies Press, 2008. Effective July 1, 2015, the institution is called the National Academies of Sciences, Engineering, and Medicine. References in this report to the National Research Council or NRC are used in an historic context identifying programs prior to July 1.
amount of additional funding received: 29 percent did not raise any funding, and 46 percent of STTR respondents reported receiving less than $100,000, while slightly less than 1 percent reported more than $20 million (see Table G-12).
Of those projects that received additional funding, 54 percent reported funding from internal sources, and 46 percent from non-SBIR/STTR federal sources. Six percent of STTR respondents indicated that they had received venture capital funding, and 3 percent received funding from angel and other private equity investors. Fifteen percent reported strategic investments from partners (see Table G-13).
COMPANY-LEVEL COMMERCIALIZATION THROUGH MERGERS AND ACQUISITIONS
SBIR/STTR firms often commercialize their technology through mergers or other company-level activities. Sixty-seven percent of STTR respondents indicated that their companies had not been acquired, had not implemented or planned an initial public offering (IPO), and had not established a spin-off. Twelve percent reported that their company had spun off one or more new companies, 16 percent that they had entered into a strategic partnership, and
TABLE G-12 Additional Funding by Phase and Amount
| Percentage of Responses | ||
| STTR Awardees | SBIR Awardees | |
| None ($0) | 29.2 | 31.3 |
| Under $100,000 | 46.2 | 47.1 |
| $100,000-$499,999 | 9.5 | 8.5 |
| $500,000-$999,999 | 6.1 | 4.3 |
| $1,000,000-$4,999,999 | 7.2 | 6.2 |
| $5,000,000-$9,999,999 | 0.8 | 1.1 |
| $10,000,000-$19,999,999 | 0.4 | 0.7 |
| $20,000,000-$49,999,999 | 0.8 | 0.6 |
| $50,000,000 or more | 0.2 | |
| Mean (Thousands of Dollars) | 691.7 | 832.1 |
| Median (Thousands of Dollars) | 50 | 50 |
| BASE: TOTAL RESPONDENTS ANSWERING QUESTION | 264 | 1,827 |
SOURCE: 2011-2014 Survey, Question 30.
TABLE G-13 Distribution of Additional Investment Funding by Source of Funds
| Percentage of Responses | ||
| STTR Awardees | SBIR Awardees | |
| Non-SBIR/STTR federal funds | 45.5 | 39.5 |
| Private Investment: U.S. Sources | 30.2 | 35.6 |
|
Venture capital (VC) |
6.3 | 5.4 |
|
U.S. angel funding or other private equity investment (not VC) |
3.3 | 8.4 |
|
Friends and family |
5.3 | 4.3 |
|
Strategic investors/partners |
15.3 | 13.1 |
|
Other sources |
11.1 | 15.3 |
| Foreign Investment | 2.6 | 4.0 |
| Other External Sources | 32.3 | 14.2 |
|
State or local governments |
16.9 | 10.7 |
|
Research institutions (such as colleges, universities or medical centers) |
17.5 | 4.4 |
|
Foundations |
3.2 | 1.0 |
| Internal Sources | 54.0 | 69.9 |
|
Your own company (Including money you have borrowed) |
45.5 | 62.1 |
|
Personal funds |
14.3 | 17.3 |
| BASE: TOTAL RESPONDENTS ANSWERING QUESTION | 189 | 1,239 |
NOTE: Responses for subcategories do not total to categories because more than one response was permitted.
SOURCE: 2011-2014 Survey, Question 31.
12 percent that the awardee company had been acquired or merged with another company. SBIR firms were more likely to establish a spin-off company, but otherwise responses for the two groups were similar (see Table G-14).
COMMERCIALIZATION TRAINING AND MARKETING
Federal agencies have in recent years provided more commercialization training for SBIR awardees. In some cases this training has been mandatory. Table G-15 indicates that 30 percent of STTR awardees received agency-sponsored training.
Of those who participated, 29 percent of STTR respondents thought that the training was valuable or extremely valuable. Conversely, about one-quarter of participants considered it not very valuable or not at all valuable.
TABLE G-14 Company-Level Changes
| Percentage of Responses | ||
| STTR Awardees | SBIR Awardees | |
| Established one or more spin-off companies | 11.5 | 18.7 |
| Entered into strategic partnership with major industry player | 16.4 | 16.1 |
| Been acquired by/merged with another firm | 11.6 | 8.6 |
| Made an initial public offering | 1.9 | 1.9 |
| Planning to make an initial public offering in the next two years | 1.2 | 1.9 |
| None of the above | 67.2 | 63.0 |
| BASE: TOTAL RESPONDENTS ANSWERING QUESTION | 167 | 1,019 |
NOTE: Because multiple responses were received from some companies, responses here are weighted to provide the average response per company.
SOURCE: 2011-2014 Survey, Question 11.
TABLE G-15 Participation in Commercialization Training (percentage of responses)
| Percentage of Responses | ||
| STTR Awardees | SBIR Awardees | |
| Yes | 30.0 | 36.1 |
| No | 70.0 | 63.9 |
| BASE: TOTAL RESPONDENTS ANSWERING QUESTION | 267 | 1,809 |
SOURCE: 2011-2014 Survey, Question 49.
SBIR recipients were more enthusiastic about the training (see Table G-16), which suggests that the training may not have been geared effectively to the more academic participants who entered the program through STTR.
The survey also asked respondents about new support opportunities generated through the reauthorization legislation, which permits Phase II companies to spend up to $10,000 each on marketing support, as an alternative to the commercialization training offered through agency-sponsored providers. Table G-17 shows that about one-half of STTR respondents would prefer to use the funding on their own, while 37 percent would prefer to continue using agency providers.
TABLE G-16 Effectiveness of Commercialization Training
| Percentage of Responses | ||
| STTR Awardees | SBIR Awardees | |
| Extremely valuable | 11.4 | 10.6 |
| Very valuable | 17.1 | 28.2 |
| Somewhat valuable | 45.7 | 36.3 |
| Not very valuable | 20.0 | 19.8 |
| Not at all valuable | 5.7 | 5.1 |
| BASE: ACCEPTED COMMERCIALIZATION ASSISTANCE IN CONNECTION WITH AWARD | 35 | 273 |
SOURCE: 2011-2014 Survey, Question 51.
KNOWLEDGE EFFECTS
One of the congressionally mandated objectives for the SBIR/STTR programs is to “stimulate technological innovation,” which is often equated with patenting activity. However, in the context of small business, this standard metric of innovation does not capture the entire story: patenting is important, but it is also expensive, and SBIR/STTR funds cannot legally be used for this purpose. Many companies interviewed for this (and for previous reports by the Academies on SBIR) indicated that they preferred to keep their technology secret or to rely on first-mover advantages and other market-based leverage to defend their technologies.
However, standard metrics provide at least a starting point for quantitative analysis. Consequently, the survey addressed several intellectual property (IP)-related metrics: patents, trademarks, copyrights, and peer-reviewed papers.9
Patents
Patents are to some degree the life blood of high-tech firms. Overall, about one-half of STTR respondents (and two-thirds of SBIR respondents) claimed to have been awarded at least one patent related to any SBIR-funded technology; 5.5 percent of STTR respondents reported at least 10 related patents (see Table G-18). SBIR companies on average (mean) reported more than twice as many patents as did STTR companies.
________________
9The values of these knowledge repositories vary. Any unique item, painting, photo, or music score can be copyrighted for a modest fee. Trademarks include more processing because registered trademarks need to be unique in their field so as not to impinge on another prior trademark’s domain. A patent can be valuable IP, and patents have been correlated with prosperity. Refereed journal articles as a metric are not as highly valued outside of academia as inside, although company executives state in interviews that publications help to attract and keep high-quality staff and also provide additional validation for, and publicity about, their technology.
TABLE G-17 Preferences for Use of Marketing Funds
| Percentage of Responses | ||
| STTR Awardee | SBIR Awardees | |
| Continue to use the agency’s program | 37.0 | 29.6 |
| Use the funding for your own marketing consultant | 49.6 | 47.0 |
| Neither | 13.4 | 23.4 |
| BASE: TOTAL RESPONDENTS ANSWERING QUESTION | 119 | 685 |
SOURCE: 2011-2014 Survey, Question 52.
TABLE G-18 Number of Patents Related to All Company STTR/SBIR Awards
| Percentage of Responding Companies | ||
| STTR Awardees | SBIR Awardees | |
| 0 | 47.1 | 34.7 |
| 1 or more | 52.9 | 65.3 |
| 1 | 10.0 | 14.6 |
| 2 | 14.9 | 11.4 |
| 3 | 7.2 | 7.8 |
| 4 | 7.0 | 5.7 |
| 5 to 9 | 8.2 | 13.1 |
| 10 or more | 5.5 | 12.7 |
| Mean | 2.03 | 5.01 |
| Median | 1.00 | 2.00 |
| BASE: TOTAL COMPANIES ANSWERING QUESTION | 155 | 985 |
SOURCE: 2011-2014 Survey, Question 12.
The questionnaire also asked questions about intellectual property related to the specific award being surveyed. Forty-two percent of STTR respondents reported receiving at least one patent related to the surveyed technology. Two percent reported receiving five or more related patents. SBIR outcomes were similar (see Table G-19).
Copyrights
About 15 percent of STTR and SBIR respondents reported receiving at least one copyright. Less than 1 percent reported receiving 10 or more.10
________________
102011-2014 Survey, Question 38.2.
TABLE G-19 Patents Awarded Related to Surveyed Project
| Percentage of Responses | ||
| STTR Awardees | SBIR Awardees | |
| 0 | 58.2 | 55.8 |
| 1 or more | 41.8 | 44.2 |
| 1 | 26.0 | 21.7 |
| 2 | 7.1 | 11.1 |
| 3 or 4 | 6.6 | 6.0 |
| 5 to 9 | 1.0 | 3.6 |
| 10 or more | 1.0 | 1.8 |
| Mean | 0.8 | 1.1 |
| Median | 0.0 | 0.0 |
| BASE: TOTAL RESPONDENTS ANSWERING QUESTION | 196 | 1,247 |
SOURCE: 2011-2014 Survey, Question 38.1.
Trademarks
There was some interest in project-related trademarks, with 28 percent of STTR respondents indicating that at least one had been received.11 This percentage was slightly higher than that for SBIR respondents (25 percent).
Peer-reviewed Publications
The survey also asked about peer-reviewed publications. Eighty-two percent of STTR respondents indicated that an author at the surveyed company had published at least one scientific paper related to the award. Forty-six percent reported publishing three or more related papers (see Table G-20).
STTR AND COMPANIES
The SBIR/STTR programs have a range of impacts on companies, which affect their ability to work within the innovation ecology of the agency or indeed more generally. Data about companies can help to define the technological space in which the SBIR/STTR programs operate. Finally, a review of the SBIR/STTR share of overall company activities can provide insights into the degree of dependence on SBIR/STTR for individual companies.
________________
112011-2014 Survey, Question 38.3.
Impact on Company Formation
Previous Academy studies have concluded that, for at least some companies, SBIR funding provided opportunities that led directly to company formation. Thirty-six percent of STTR respondents indicated that the program contributed to some degree to company formation (see Table G-21). SBIR companies were somewhat more likely to report that the program supported company formation (41 percent).
TABLE G-20 Peer-Reviewed Scientific Publications Related to the Surveyed Project
| Percentage of Responses | ||
| STTR Awardees | SBIR Awardees | |
| 0 | 17.7 | 23.0 |
| 1 | 17.2 | 19.2 |
| 2 | 19.5 | 17.5 |
| 3 or 4 | 21.4 | 19.9 |
| 5 to 9 | 12.6 | 12.3 |
| 10 or more | 11.6 | 8.1 |
| 1 or more | 82.3 | 77.0 |
| Mean | 4.5 | 4.4 |
| Median | 2.0 | 2.0 |
| BASE: TOTAL RESPONDENTS ANSWERING QUESTION | 215 | 1,341 |
SOURCE: 2011-2014 Survey, Question 38.4.
TABLE G-21 Company Founded Because of SBIR-STTR Programs?
| Percentage of Responding Companies | |||
| STTR Awardees | SBIR Awardees | TOTAL | |
| Yes | 12.0 | 17.1 | 16.3 |
| In part | 24.1 | 23.8 | 23.8 |
| No | 63.9 | 59.2 | 59.8 |
| BASE: TOTAL RESPONDENTS ANSWERING QUESTION | 177 | 1,049 | 1,226 |
SOURCE: 2011-2014 Survey, Question 7.
SBIR/STTR Share of Research and Development (R&D) Effort
The survey asked respondents to estimate how much of their company’s total R&D effort—defined as man-hours of work for scientists and engineers—was devoted to SBIR/STTR-funded projects in the most recent fiscal year. Overall, 48 percent of STTR respondents indicated that SBIR/STTR funded 10 percent or less of total effort, while 28 percent indicated that it funded more than one-half (see Table G-22).
These data correspond fairly closely to responses from Question 9, which asked what percentage of company revenues during its current year were related to SBIR/STTR awards. Almost one-third of STTR respondents reported zero revenue from SBIR/STTR in the most recent fiscal year, while 24 percent reported receiving more than one-half of all company revenues from SBIR/STTR. Four percent were entirely dependent on SBIR/STTR (see Table G-23).
Prior Use of the SBIR/STTR Programs
Although linear conceptualizations of the innovation process claim that ideas are tested in Phase I, prototyped in Phase II, and commercialized in Phase III, experience shows that real-world development is far more complex. In many cases, multiple iterations are required, or projects must restart with an earlier phase, or multiple efforts are needed to meet specific problems.
The survey asked respondents to indicate how many prior SBIR/STTR Phase I awards were related to the project and technology being surveyed. Table G-24 shows that 20 percent of STTR projects received no other related
TABLE G-22 Percentage of R&D effort Funded by SBIR/STTR
| Percentage of Responding Companies | ||
| STTR Awardees | SBIR Awardees | |
| 0% | 28.1 | 25.4 |
| 1-10% | 19.4 | 13.1 |
| 11-25% | 10.9 | 14.2 |
| 26-50% | 13.2 | 16.9 |
| 51-75% | 11.8 | 14.8 |
| 76-100% | 16.6 | 15.5 |
| BASE: TOTAL COMPANIES ANSWERING QUESTION | 158 | 1,010 |
NOTE: Because multiple responses were received from some companies, responses here are weighted to provide the average response per company.
SOURCE: 2011-2014 Survey, Question 10.
SBIR/STTR awards, while 24 percent received at least three additional related awards. These data strongly support the view that innovative products emerge from clusters of activity, rather than simple straight-line development from Phase I to Phase II to commercialization.
TABLE G-23 Percentage of Company Revenues from SBIR/STTR (company’s most recent Fiscal Year)
| Percentage of Responding Companies | ||
| STTR Awardees | SBIR Awardees | |
| 0% | 31.3 | 28.7 |
| 1-10% | 22.2 | 15.4 |
| 11-25% | 11.7 | 14.5 |
| 26-50% | 10.5 | 15.7 |
| 51-75% | 10.9 | 11.9 |
| 76-99% | 9.0 | 11.3 |
| 100% | 4.4 | 2.5 |
| BASE: TOTAL RESPONDENTS ANSWERING QUESTION | 158 | 997 |
SOURCE: 2011-2014 Survey, Question 9.
TABLE G-24 Prior SBIR/STTR Phase I Awards Related to the Surveyed Project
| Percentage of Responses | ||
| STTR Awardees | SBIR Awardees | |
| 0 | 20.0 | 20.0 |
| 1 | 37.6 | 36.8 |
| 2 | 18.8 | 17.8 |
| 3 or 4 | 11.8 | 16.3 |
| 5 to 9 | 8.6 | 6.6 |
| 10 or more | 3.1 | 2.5 |
| 1 or more | 80.0 | 80.0 |
| Mean | 2.1 | 2.1 |
| Median | 1 | 1 |
| BASE: TOTAL RESPONDENTS ANSWERING QUESTION | 255 | 1,701 |
SOURCE: 2011-2014 Survey, Question 39.1.
About one-quarter of STTR projects reported no prior related Phase II awards, while 15 percent reported at least three. The median response was one (see Table G-25).
Long-term Impacts on the Recipient Company
SBIR awards have direct effects on specific projects, but they can have a longer-term effect on the trajectory of company development, creating capacity and in some cases providing a critical input that transforms long-term outcomes. The survey asked respondents about this directly. The results are summarized in Table G-26.
These results show an overwhelmingly positive impact. Overall, 79 percent of STTR respondents reported a positive effect, and 32 percent reported a transformative impact. These percentages are somewhat lower than those for SBIR. STTR respondents were also more likely to report a highly negative or disastrous effect (6 percent).
To probe more deeply into this critically important area, respondents were also asked to provide a description of these effects in their own words. Their comments are summarized beginning on the following page, focused on the ways in which SBIR and STTR made a major difference to the company in the long term.
TABLE G-25 Other SBIR or STTR Phase II Awards Related to the Surveyed Project Technology
| Percentage of Responses | ||
| STTR Awardees | SBIR Awardees | |
| 0 | 22.7 | 24.8 |
| 1 | 47.0 | 42.3 |
| 2 | 15.4 | 17.5 |
| 3 or 4 | 10.5 | 11.3 |
| 5 to 9 | 3.6 | 3.1 |
| 10 or more | 0.8 | 1.0 |
| 1 or more | 77.3 | 75.2 |
| Mean | 1.4 | 1.5 |
| Median | 1 | 1 |
SOURCE: 2011-2014 Survey, Question 39.2.
TABLE G-26 Long-Term Impacts on Recipient Companies
| Percentage of Responses | ||
| STTR Awardees | SBIR Awardees | |
| Had a highly positive or transformative effect | 32.2 | 39.2 |
| Had a positive effect | 46.4 | 46.8 |
| Had no effect | 15.0 | 11.2 |
| Had a negative effect | 5.2 | 2.2 |
| Had a highly negative or disastrous effect | 1.1 | 0.6 |
| BASE: TOTAL RESPONDENTS ANSWERING QUESTION | 267 | 1,816 |
SOURCE: 2011-2014 Survey, Question 57.
Key Aspects of STTR-driven Transformation
It is not easy to summarize the numerous ways in which STTR awards helped to transform recipient companies. What follows is therefore a limited list of impacts drawn from the survey responses. Impacts included the following:
- Supported company formation
- Encouraged faculty to form companies without being forced to leave their academic positions
- Provided first dollars
- Funded areas where venture capital and other funders were not interested
- Supported development of critical company infrastructure
- Opened doors to potential partners
- Helped address niche markets too small for major players/funders
- Funded technology development
- Enabled projects with high levels of technical risk and high potential return
- Supported adaptation of technologies to new uses, markets, and industry sectors
- Funded development of core technology
- Diversified expertise, allowed hiring of specialists
- Gave companies immediate credibility
- Funded researchers to enter business full time
- Transformed company culture to become more market driven
- Created new companies and kept companies in business (that would not exist without STTR funding)
- Helped increase the company’s knowledge base applied to later projects
- Expanded the scope and scale of R&D capabilities
- Supported technology development that led to spin-off companies
Overall, the strongest conclusion to be drawn from these responses is that small innovative companies are highly sensitive to the impact of exogenous variables. The sudden withdrawal of a sponsor can crush a company; a single contract can provide funding for 2 or 3 years of growth. Above all, these small companies are highly path dependent: what happens to them at a given moment can dramatically affect long-term outcomes. The butterfly effect could have been invented specifically to apply to these kinds of companies.
In the end, SBIR/STTR can be seen in many cases as a positive exogenous variable: one that provides funding, validation, and often market access not otherwise available. Even though it seems tenuous to link one award to the eventual success of a large corporation, that is, in fact, how some very small companies grow into large ones. The evidence from survey respondents suggests that this positive jolt is not an uncommon effect of these awards.
Industry Sector
Previous analyses of SBIR/STTR have not addressed a potentially important intervening variable: industry sector. It is quite possible that commercialization outcomes may be affected by the average cycle time of product development in different sectors. For example, product cycle time is much shorter in software than in materials or medical devices. Table G-27 shows the distribution of responses by program and sector. For most sectors there are few differences between SBIR and STTR respondents; the former tend to work somewhat more in defense, the latter somewhat more in medical technologies.
COUNTERFACTUALS
It is difficult to tightly determine the impact of a given STTR award. Many factors affect the success and failure of companies and projects, and it is often difficult to determine whether a specific factor was a necessary condition for success. Worse still, the large number of factors and the multiple paths to success and failure mean that it is unusual to be able to state with confidence that a particular intervention—in this case an STTR award—constituted a sufficient condition for a project’s success.
This question was designed to provide an approximate map of activities by sector. There is considerable overlap between some categories, and respondents would have substantial leeway to define sectors differently, so these results should be viewed as highly preliminary.
TABLE G-27 Distribution of Responses by Sector and Phase
| Percentage of Responses | ||
| Sector | STTR Awardees | SBIR Awardees |
| Aerospace and Defense | 39.0 | 46.5 |
|
Aerospace |
24.3 | 29.3 |
|
Defense-specific products and services |
30.1 | 36.4 |
| Energy and the Environment | 17.6 | 15.1 |
|
Renewable energy production (solar, wind, geothermal, bio-energy, wave) |
4.8 | 3.8 |
|
Energy storage and distribution |
4.0 | 3.0 |
|
Energy efficiency |
5.1 | 4.0 |
|
Other energy or environmental products and services |
12.1 | 9.8 |
| Engineering | 36.0 | 38.9 |
|
Engineering services |
8.8 | 9.1 |
|
Scientific instruments and measuring equipment |
15.1 | 14.6 |
|
Robotics |
3.3 | 3.7 |
|
Sensors |
14.0 | 16.7 |
|
Other engineering |
12.5 | 15.3 |
| Information Technology | 13.6 | 14.3 |
|
Computers and peripheral equipment |
2.2 | 3.0 |
|
Telecommunications equipment and services |
2.2 | 2.5 |
|
Business and productivity software |
1.5 | 2.6 |
|
Data processing and database software and services |
5.1 | 4.4 |
|
Media products (including web-, print- and wireless-delivered content) |
1.5 | 1.9 |
|
Other IT |
3.7 | 5.6 |
| Materials (including nanotechnology for materials) | 16.9 | 12.9 |
| Medical Technologies | 40.4 | 34.2 |
|
Pharmaceuticals |
6.6 | 5.4 |
|
Medical devices |
12.9 | 14.5 |
|
Biotechnology (including therapeutic, diagnostic, combination) |
13.2 | 11.4 |
|
Health IT (including mobile, big data, training modules) |
2.9 | 2.0 |
|
Research tools |
10.3 | 8.0 |
|
Education materials |
3.7 | 2.4 |
|
Other medical products and services |
4.4 | 3.9 |
| Other (please specify) | 8.1 | 11.6 |
| BASE: TOTAL RESPONDENTS ANSWERING QUESTION | 272 | 1,861 |
NOTE: Answers do not sum to 100 percent because respondent could select more than one sector.
SOURCE: 2011-2014 Survey, Question 20.
Project Go-ahead Absent STTR Funding
One approach has been to ask recipients for their own views on the impact of the program on their project or company. In particular, the survey asked whether the project would have been undertaken absent STTR funding and whether the scope and timing would have been affected. Responses are summarized in Table G-28.
Only about 9 percent of the STTR respondents indicated that there was even a probability that the project would have proceeded without program funding. In contrast, 76 percent thought the project would probably not have proceeded absent STTR funding; 38 percent were definite that the project would not have proceeded.
Project Scope Absent STTR Funding
A second area of review concerns the impact of funding on the project’s scope. It seems likely that additional funding in the form of STTR money would lead to an expansion of project scope. The analysis in this case focused only on the respondents who were certain that the project would have proceeded absent program funding. Results are summarized in Table G-29.
Although most respondents indicated that the absence of program funding would have limited the scope of the project, some respondents indicated that the ambitions of the project were limited by participation in the program, most likely to address the specific requirements of SBIR/STTR awards.
Project Delays Absent STTR Funding
As with project scope, the immediate supposition is that, absent STTR funding, projects would have been delayed while other funding was identified and acquired. However, as we will see when considering program operations
TABLE G-28 Project Undertaken in the Absence of This STTR Award
| Percentage of Responses | ||
| STTR Awardees | SBIR Awardees | |
| Definitely yes | 1.8 | 1.9 |
| Probably yes | 7.3 | 7.6 |
| Uncertain | 15.3 | 15.4 |
| Probably not | 37.2 | 40.3 |
| Definitely not | 38.3 | 34.8 |
| BASE: TOTAL RESPONDENTS ANSWERING QUESTION | 274 | 1,867 |
SOURCE: 2011-2014 Survey, Question 24.
TABLE G-29 STTR Impact on Project Scope
| Percentage of Responses | |||
| STTR Awardees | SBIR Awardees | TOTAL | |
| Broader in scope | 8.0 | 8.6 | 8.5 |
| Similar in scope | 16.0 | 28.0 | 26.5 |
| Narrower in scope | 76.0 | 63.4 | 65.0 |
| BASE: COMPANY WOULD HAVE UNDERTAKEN PROJECT IN THE ABSENCE OF THE AWARD | 25 | 175 | 200 |
SOURCE: 2011-2014 Survey, Question 25.
later in this report, STTR awards carry delays of their own, which can in some cases be substantial. Thus this survey question seeks to determine a balance between delays imposed by the need for new funding and delays inherent in the STTR program.
Ninety-six percent of the 25 STTR respondents who were sure that the project would have proceeded absent STTR funding agreed that the absence of STTR funding would have delayed the project by at least 3 months (Table G-30). Twenty-four percent projected a delay of at least 12 months. Given that gaps and delays can have a significant impact on small companies with few other resources for retaining their technical teams, this is potentially an important result. SBIR projects reported being somewhat less susceptible to delays caused by the absence of Phase II funding.
Data for STTR are similar to those for SBIR, reinforcing the limited participation of both woman- and minority-owned firms in the programs. Firms owned by minorities other than Asian-Americans were especially poorly represented among respondents from both STTR and SBIR projects.
TABLE G-30 Likely Delay Absent STTR Funding
| Percentage of Responses | ||
| STTR Awardees | SBIR Awardees | |
| Less than 3 months | 4.0 | 11.5 |
| 3 to 6 months | 24.0 | 14.5 |
| 7 to 12 months | 48.0 | 36.4 |
| Over 12 months | 24.0 | 37.6 |
| Average months | 15.6 | 15.0 |
| Median months | 12 | 12 |
| BASE: COMPANY WOULD HAVE UNDERTAKEN PROJECT IN THE ABSENCE OF THE AWARD | 25 | 165 |
SOURCE: 2011-2014 Survey, Question 26A.
WOMEN AND MINORITIES
Although the participation of women and disadvantaged groups is not a formal objective of the STTR program, the 2011-2014 Survey did explore levels of participation both for companies and for PIs. Results are provided in tables G-31 and G-32.
TABLE G-31 Participation of Woman- and Minority-owned Companies in the STTR/SBIR Program
| Percentage of Responses | ||
| STTR Awardees | SBIR Awardees | |
| Woman-owned | 8.4 | 10.6 |
| Minority-owned | 9.1 | 9.1 |
| Asian-Indian | 4.6 | 3.5 |
| Asian-Pacific | 2.3 | 3.4 |
| Black | 1.1 | 0.3 |
| Hispanic | 1.1 | 1.5 |
| Native American | 0.4 | 0.2 |
| Other | 0.4 | 0.3 |
| Not woman- nor minority-owned | 83.7 | 82.3 |
| BASE: TOTAL RESPONDENTS ANSWERING QUESTION | 263 | 1,789 |
SOURCE: 2011-2014 Survey, Question 15.
TABLE G-32 Participation of Female and Minority PIs in the STTR/SBIR Program
| Percentage of Responses | ||
| STTR Awardees | SBIR Awardees | |
| Woman | 10.0 | 8.9 |
| Minority | 14.1 | 11.3 |
| Asian-Indian | 4.1 | 4.1 |
| Asian-Pacific | 4.1 | 5.1 |
| Black | 0.7 | 0.2 |
| Hispanic | 3.0 | 1.3 |
| Native American | 0.7 | 0.2 |
| Other | 1.5 | 0.5 |
| Not a woman nor a minority | 79.3 | 81.2 |
| BASE: TOTAL RESPONDENTS ANSWERING QUESTION | 270 | 1,856 |
SOURCE: 2011-2014 Survey, Question 16.
Data for PIs are similar, although both female and minority participation are greater than for woman-and minority-owned firms. Again, minorities other than Asian-Americans were especially poorly represented.


