
4
The Mortality Experience of SHAD Veterans
This chapter begins with a description of essential characteristics of the study population. It goes on to present the results of the committee’s analyses to assess whether Project SHAD (Shipboard Hazard and Defense) veterans have experienced greater mortality than the veterans in the comparison group who served at a similar time and in similar units. Results of the analysis of morbidity data are presented in Chapter 5. A discussion of the committee’s interpretation of the results is provided in Chapter 6.
CHARACTERISTICS OF THE STUDY POPULATION
The population for this study was made up of 5,868 Project SHAD participants and 6,753 other veterans who served as a comparison group. All members of the study population were men. Chapter 3 provides details on the development of this study population. Some of the basic characteristics of the study population are shown in Table 4-1.
Overall, the SHAD participants and the comparison population are similar in their age profiles. By the end of the study follow-up period, 15 to 16 percent of the two groups remained too young (less than age 65) to qualify for Medicare enrollment. At the time of the SHAD I study, nearly 70 percent of the study population had not yet reached age 65. Among those with known race, the proportions of white and non-white service members were similar in the two groups. The SHAD participant and comparison groups are also broadly similar in terms of branches of service and rank. Substantial majorities of both groups served in the Navy and were enlisted personnel rather than officers.
Because the SHAD tests occurred during the period of the Vietnam War, the committee was concerned that service in Vietnam or presumed exposure to Agent Orange among members of the study population might complicate the analysis of health effects experienced by SHAD veterans, especially if there were marked differences between the SHAD participants and the comparison group. Ideally, it would be possible to fully document the service histories of all members of the study population, but the necessary records are not available in electronic form. The best information available was from records of the Veterans Benefits Administration (VBA) of the Department of Veterans Affairs (VA). For veterans who apply for disability compensation,
TABLE 4-1 Characteristics of Project SHAD Participants and the Comparison Population
| Characteristic | Project SHAD Participants N = 5,868 (%) | Comparison Population N = 6,753 (%) | Total N = 12,621 (%) |
| Year of Birth | |||
|
<1937 |
1,107 (18.8) | 1,193 (17.7) | 2,300 (18.2) |
|
1937-1946 |
3,514 (59.9) | 3,982 (59.0) | 7,496 (59.4) |
|
>1946 |
925 (15.8) | 1,012 (15.0) | 1,937 (15.3) |
|
Unknown |
322 (5.5) | 566 (8.4) | 888 (7.0) |
| Racea | |||
|
Nonwhite |
637 (13.1) | 491 (11.3) | 1,128 (12.2) |
|
White |
4,241 (86.9) | 3,846 (88.7) | 8,087 (87.8) |
| Branch | |||
|
Navy |
5,066 (86.3) | 6,137 (90.9) | 11,203 (88.8) |
|
Marines, other branches, and unknown |
802 (13.6) | 616 (9.1%) | 1,418 (11.2) |
| Rank | |||
|
Officer |
471 (8.0) | 496 (7.3) | 967 (7.7) |
|
Enlisted |
5,394 (91.9) | 6,257 (92.7) | 11,651 (92.3) |
|
Unknown |
3 | 3 | |
|
Vietnam service among those filing for VA disabilityb |
1,018 (17.3) | 1,243 (18.4) | 2,261 (17.9) |
|
Presumed or documented Agent Orange exposure among those filing for VA disabilityc |
475 (8.1) | 453 (6.7) | 928 (7.4) |
a Percentage is among those with known race. Race was unknown for 16.9 percent of SHAD participants and 35.8 percent of the comparison population.
b Vietnam service is defined as duty or visitation within the country of South Vietnam, including Navy veterans who entered inland waterways on ships, went ashore from offshore ships, or served only aboard offshore ships and never went ashore or entered inland waterways (Personal communication, J. Sampsel, Veterans Benefit Administration, March 12, 2014).
c Veterans with duty or visitation within the country of South Vietnam, including Navy veterans who entered inland waterways on ships or went ashore from offshore ships, qualify for a presumption of exposure to Agent Orange. A presumption of Agent Orange exposure also applies to veterans with service in certain military units on the Korean demilitarized zone during the Vietnam era. Veterans with service in other locations where testing and storage of Agent Orange occurred may also be designated as exposed if evidence shows that the veteran was directly involved (Personal communication, J. Sampsel, Veterans Benefit Administration, March 12, 2014).
VBA records include information on whether the veteran is considered to have service in Vietnam and whether the veteran is considered to have been exposed to Agent Orange, on the basis of documented exposure or presumed exposure because of the location of military service. The committee was reassured to find (see Table 4-1) that VBA records show similar percentages of the SHAD veterans and the comparison population with indicators for both Vietnam service and Agent Orange exposure.
AVAILABILITY OF MORTALITY DATA
The analysis of the mortality experience of the study population considered both the timing of deaths and their underlying causes. The sources of mortality data for this study population are described in Chapter 3. As shown in Table 4-2, similar percentages of the SHAD test participants and comparison population were known to be dead or assumed to be alive as of December 31, 2011, which was the end of the follow-up period for this study. Roughly 68 percent of the SHAD participants and the comparison population were assumed alive at that time. Information on cause of death was available in each group for approximately 91 percent of those who had died.
ALL-CAUSE MORTALITY
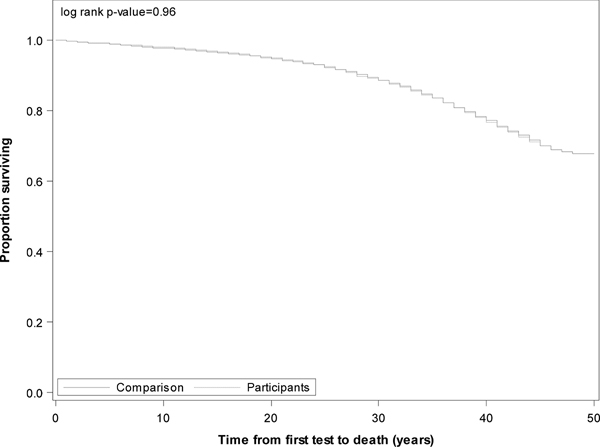
The mortality experience of the study population was assessed first for all deaths, regardless of the cause. A comparison of the timing of deaths among the SHAD participants and the comparison population was done using Kaplan-Meier survival analysis. This is a statistical technique that assesses the probability of surviving from one time interval to another. Because the various SHAD tests took place in different years the analysis is based on annual survival in the time since the first test in which a veteran was a participant. For the participants in the earliest tests (e.g., Eager Belle in early 1963), this period is approximately 48 years; for those who participated only in the final test (DTC 69-32 in spring 1969), the interval is approximately 42 years.
The committee found on the basis of the Kaplan-Meier analysis that the overall survival experience of the test participant and comparison populations was very similar (see Figure 4-1), and a statistical test (the log-rank test) showed that the small differences between the two curves were not statistically significant.
TABLE 4-2 Vital Status and Availability of Data on Death for Project SHAD Participants and the Comparison Population as of December 31, 2011
| Vital Status and Death Data Available | Project SHAD Participants | Comparison Population | Total |
| Assumed alive | 3,975 (67.7%) | 4,574 (67.7%) | 8,549 (67.7%) |
|
Known dead |
1,893 |
2,179 |
4,075 |
|
Date or fact of death only |
162 (8.6%) | 198 (9.1%) | 360 (8.8%) |
|
Cause of death available |
1,731 (91.4%) | 1,981 (90.9%) | 3,712 (91.1%) |
|
Total population |
5,868 |
6,753 |
12,621 |
Another approach to comparing the overall mortality experience of the SHAD veterans with the comparison population makes use of the Cox proportional hazards model. This approach can also incorporate consideration of (“adjustment for”) age at SHAD test, rank (officer versus enlisted), and service branch (Navy versus Marines and other) as well as SHAD participation. This analysis was used to assess all-cause mortality and (described below) cause-specific mortality. It was limited to subjects for whom the year of death was available. Use of the proportional hazards model assumes proportionality in the associated hazard functions (force of mortality). Proportionality was confirmed graphically by plotting the logarithm of cumulative hazard based on Kaplan-Meier estimates versus the logarithm of time. Detail about fitting the statistical model is provided in Appendix D.
As can be seen in Table 4-3, the SHAD participants and the comparison population did not differ significantly in overall mortality. This held true as well when the analysis was adjusted for age, rank, and service branch. Age, rank, and service branch each had a statistically significant association with total mortality. For example, enlisted personnel in the study population had a significantly higher risk of death than officers, whether or not they had been SHAD participants. Race is often included in analyses such as these. However, information on race was available for only 73 percent of the study population, with the percentage with
TABLE 4-3 Survival Analysis Using Proportional Hazards Regression: All-Cause Mortality for the SHAD Participant and Comparison Populations
| Risk Factor | Unadjusted Hazard Ratio | 95% Confidence Interval | Adjusted Hazard Ratioa | 95% Confidence Interval |
| SHAD participation | ||||
|
Comparison population |
1 | 1 | ||
|
Project SHAD participants |
1.01 | 0.88-1.16 | 0.94 | 0.85-1.04 |
| Age (years) | 1.09 | 1.09-1.10 | ||
| Rank | ||||
|
Officer |
1 | |||
|
Enlisted |
1.81 | 1.58-2.08 | ||
| Service branch | ||||
|
Navy |
1 | |||
|
Marines and other |
1.35 | 1.17-1.57 | ||
a All factors are adjusted simultaneously. For example, the adjusted hazard ratio for Project SHAD participants is adjusted for age, rank, and service branch. Ship ID was used in the model as a random effect to control for ship-clustering: estimated standard error for the random effects is 0.0059. SAS version 9.4 was used for all analyses.
unknown race greater among the comparison group (36 percent) than the SHAD test participants (17 percent), providing a compelling reason to exclude race in the analysis. The committee did not wish to omit those with missing data and did not have a good means to impute race. The committee did not observe differential exposure by race, and had no reason to anticipate a differential effect of exposure based upon race.
CAUSE-SPECIFIC MORTALITY
The committee also explored whether SHAD participants may have been at increased risk of death from particular causes. Two approaches were used to look at cause-specific mortality. One approach, which was also used in the SHAD I study (IOM, 2007), relied on broad categories of causes of death that are used in the 9th and 10th revisions of the International Classification of Diseases (ICD-9 and ICD-10) (WHO, 2015). The mortality analysis also examined the specific causes of death that were identified from the review of the literature on potential health effects associated with exposure to some of the substances used in the SHAD tests. The ICD codes that correspond to the categories of causes of death are provided in Appendix F.
Broad Categories of Causes of Death
The survival experiences of the SHAD test participants and the members of the comparison population were very similar for all the causes of death considered. Table 4-4 presents both the crude (unadjusted) hazard ratios and the hazard ratios adjusted for age and rank for each of the broad cause-of-death categories using Cox proportional hazard regression. The Project SHAD test participant population and comparison population had similar cause-specific
TABLE 4-4 Proportional Hazards Regression for Broad Categories of Cause of Death for SHAD Participant and Comparison Populations (Cause of death available: Participants = 1,731; Comparison = 1,981)
| Cause of Death | Enlisted Only | ||||||
| Number of Deaths | Number of Deaths | ||||||
| SHAD Participants | Comparison Population | Unadjusted HR (95% CI) | Adjusted HRa (95% CI) | SHAD Participants | Comparison Population | Adjusted HR (95% CI)b | |
| Infectious disease | 44 | 44 | 1.14 (0.72-1.80) | 1.08 (0.70-1.66) | 39 | 41 | 1.07 (0.68-1.68) |
| Cancer | 550 | 663 | 0.96 (0.81-1.13) | 0.93 (0.83-1.04) | 520 | 618 | 0.96 (0.85-1.08) |
|
Endocrine/metabolic disease |
58 | 66 | 1.03 (0.68-1.55) | 1.00 (0.70-1.43) | 54 | 61 | 1.03 (0.71-1.50) |
| Neurocognitive disease | 23 | 31 | 0.85 (0.48-1.53) | 0.80 (0.45-1.44) | 19 | 31 | 0.66 (0.35-1.27) |
| Heart disease | 577 | 602 | 1.12 (0.95-1.32) | 1.09 (0.91-1.29) | 540 | 569 | 1.10 (0.91-1.32) |
|
Ischemic heart disease |
346 | 374 | 1.08 (0.90-1.30) | 1.05 (0.89-1.25) | 321 | 354 | 1.06 (0.89-1.27) |
|
Other heart disease |
231 | 228 | 1.16 (0.92-1.46) | 1.11 (0.87-1.42) | 219 | 215 | 1.13 (0.86-1.48) |
| Respiratory disease | 141 | 152 | 1.09 (0.83-1.42) | 1.04 (0.80-1.34) | 131 | 137 | 1.10 (0.85-1.43) |
| Digestive disease | 72 | 93 | 0.89 (0.62-1.28) | 0.87 (0.62-1.23) | 68 | 90 | 0.86 (0.61-1.22) |
| Injury/external causes | 141 | 193 | 0.85 (0.68-1.07) | 0.82 (0.65-1.03) | 132 | 189 | 0.78 (0.62-0.98) |
NOTES: CI = confidence interval; HR = hazard ratio. See Appendix F for the ICD-9 codes that correspond to the categories of illness. SAS version 9.4 was used for all analyses.
a Adjusted for age, rank (officer/enlisted), and service branch.
b Adjusted for age only. Analysis takes into account competing risks.
mortality for most causes of death. The committee also evaluated enlisted and officer populations separately, aware of the possibility of differential exposures based upon experiences on the ships, as well as the socioeconomic differences that may accompany differences in rank. Examination of the enlisted and officer groups separately indicated statistically significantly fewer deaths from injury and external causes among the enlisted personnel in the SHAD participant population compared to the enlisted personnel in the comparison group. The committee did not pursue this result further because its interest was in the potential for increased rather than decreased risk among Project SHAD exposure groups.1 No statistically significant differences were seen among the much smaller group of officers in this or any of the other analyses discussed in this chapter (data not shown).
______________
1 The reported statistical significance is the result of an implicit two-sided alternative of any difference between the SHAD population and the comparison population; it would not be observed if a one-sided alterantive of higher risk among SHAD population were explicitly used.
Testing Hypotheses Regarding Specific Exposures
As described in Chapter 3, the committee’s review of literature on the agents, simulants, tracers, and decontaminants used in the SHAD tests led to the formulation of hypotheses regarding the potential for increased risk of certain adverse health outcomes among SHAD veterans exposed to any of six substances: Coxiella burnetii, betapropriolactone, staphylococcal enterotoxin type B (SEB), Escherichia coli, sarin, and zinc cadmium sulfide. Because the individuals who served on the vessels involved in testing SEB were not identified, the committee could not test the hypotheses generated for this agent.
The vital status of Project SHAD veterans who participated in tests that used the remaining five substances is shown in Table 4-5. Comparison groups for these SHAD participants were identified as described in Chapter 3 and had served on similar ships deployed at the same time from a similar home port. Approximately 60 to 68 percent of the individuals in these exposure groups were assumed alive (not known to be dead) as of December 31, 2011.
TABLE 4-5 Vital Status of SHAD Participants by Potential Exposure to Agents, Simulants, and Decontaminants for Which Health Outcomes Were Hypothesized
| Exposure and Vital Status | Project SHAD Participants | Comparison Group |
| Coxiella burnetii | ||
| Total group | 141 | 212 |
| Assumed alive | 84 (59.6%) | 138 (65.1%) |
| Total known dead | 57 (40.4%) | 74 (34.9%) |
|
Cause of death available |
53 (37.6%) | 69 (32.5%) |
|
Only date or fact of death available |
4 (2.8%) | 5 (2.4%) |
| Betapropiolactone | ||
| Total group | 595 | 607 |
| Assumed alive | 399 (67.1%) | 385 (63.4%) |
| Total known dead | 196 (32.9%) | 222 (36.6%) |
|
Cause of death available |
178 (29.9%) | 195 (32.1%) |
|
Only date or fact of death available |
18 (3.0%) | 27 (4.4%) |
| Escherichia coli | ||
| Total group | 141 | 228 |
| Assumed alive | 96 (68.1%) | 155 (68.0%) |
| Total known dead | 45 (31.9%) | 73 (32.0%) |
|
Cause of death available |
43 (30.5%) | 68 (29.8%) |
|
Only date or fact of death available |
2 (1.4%) | 5 (2.2%) |
| Sarin | ||
| Total group | 129 | 197 |
| Assumed alive | 80 (62.0%) | 127 (64.5%) |
| Total known dead | 49 (38.0%) | 70 (35.5%) |
|
Cause of death available |
44 (34.1%) | 63 (32.0%) |
|
Only date or fact of death available |
5 (3.9%) | 7 (3.6%) |
| Zinc cadmium sulfide | ||
| Total group | 681 | 773 |
| Assumed alive | 448 (65.8%) | 507 (65.6%) |
| Total known dead | 233 (34.2%) | 266 (34.4%) |
|
Cause of death available |
214 (31.4%) | 242 (31.3%) |
|
Only date or fact of death available |
19 (2.8%) | 24 (3.1%) |
All-Cause Mortality for Selected Exposures
Before considering the specific health outcomes that the literature review suggested might be associated with the exposure experience of certain SHAD participants, the committee examined the overall survival patterns of the groups with those exposures. The analysis showed that these SHAD participants and their comparison groups were similar, with no statistically significant differences in survival for any of these exposure groups (see Table 4-6). Similarly, when the enlisted and officer groups were compared separately, the results were not statistically significant (officer data not shown).
TABLE 4-6 Proportional Hazards Regression for All-Cause Mortality for SHAD Participants with Exposure to Selected Substances and the Comparison Groups
| Exposure and Risk Factor | Unadjusted Hazard Ratio (95% CI) | Adjusted Hazard Ratioa (95% CI) |
| Coxiella burnetii | ||
|
Participant (n = 141, known dead = 57) versus comparison (n = 212, known dead = 74) |
1.37 (0.53-3.52) | 0.81 (0.24-2.69) |
|
Enlisted (P, n = 122, known dead = 50 versus Enlisted (C, n = 192, known dead = 71) |
1.26 (0.45-3.49) | 0.74 (0.19-2.83) |
| Betapropiolactone | ||
|
Participant (n = 595, known dead = 196) versus comparison (n = 607, known dead = 222) |
0.94 (0.73-1.22) | 0.97 (0.79-1.19) |
|
Enlisted (P, n = 546, known dead = 183) versus Enlisted (C, n = 555, known dead = 210) |
0.92 (0.71-1.20) | 1.00 (0.77-1.30) |
| Escherichia coli | ||
|
Participant (n = 141, known dead = 45) versus comparison (n = 228, known dead = 73) |
1.01 (0.69-1.48) | 0.94 (0.64-1.38) |
|
Enlisted (P, n = 132, known dead = 40 versus Enlisted (C, n = 217, known dead = 70) |
0.94 (0.63-1.40) | 0.91 (0.61-1.36) |
| Sarin | ||
|
Participant (n = 129, known dead = 49) versus comparison (n = 197, known dead = 70) |
1.11 (0.75-1.63) | 1.07 (0.73-1.57) |
|
Enlisted (P, n = 114, known dead = 43) versus Enlisted (C, n = 176, known dead = 66) |
1.04 (0.70-1.56) | 1.04 (0.70-1.56) |
| Zinc cadmium sulfide | ||
|
Participant (n = 681, known dead = 233) versus comparison (n = 773, known dead = 266) |
1.01 (0.84-1.22) | 0.93 (0.75-1.15) |
|
Enlisted (P, n = 621, known dead = 215 versus Enlisted (C, n = 716, known dead = 252) |
1.03 (0.82-1.29) | 0.91 (0.66-1.25) |
NOTES: CI = confidence interval. Ship ID was used in the model as random effect. SAS version 9.4 was used for all analyses.
a Adjusted for age and rank (officer/enlisted). Enlisted and officer groups adjusted only for age.
Mortality from Health Outcomes with a Hypothesized Association with Certain SHAD Test Exposures
For each of the six exposures for which the potential for certain adverse health outcomes was hypothesized, the number of deaths attributed to these conditions was tabulated (see Table 4-7). Kaplan-Meier analyses of the survival experience of exposed SHAD participants found no statistically significant difference from the experience of the comparison groups. Similarly, a proportional hazards analysis that included adjustment for age and rank found no statistically significant excess risk among SHAD participants (see Table 4-8) for the two categories for which there were sufficient number of cases to pursue the analysis (i.e., exposure to betapropriolactone or zinc cadmium sulfide). When examined separately, the findings were similar in the enlisted members of these exposure groups.
TABLE 4-7 Mortality from Hypothesized Health Outcomes for SHAD Participants with Exposure to Specific Agents and the Comparison Groups
| Exposure and Hypothesized Health Outcome | Number of Deaths | |
| SHAD Participants | Comparison Group | |
|
Coxiella burnetii (Total group) |
(141) | (212) |
|
Endocarditis |
0 | 0 |
|
Fatigue |
0 | 0 |
|
Chronic hepatitis |
0 | 0 |
|
Osteomyelitis |
0 | 0 |
|
Vascular infection |
0 | 0 |
| Betapropiolactone | (595) | (607) |
|
All cancer |
51 | 61 |
| Escherichia coli | (141) | (228) |
|
Irritable bowel syndrome |
0 | 0 |
| Sarin | (129) | (197) |
|
Neurological effects: CNS |
0 | 0 |
|
Neurological effects: PNS |
0 | 0 |
|
Neurological effects: Hearing loss |
0 | 0 |
|
Psychological symptoms |
0 | 0 |
| Zinc cadmium sulfide | (681) | (773) |
|
Lung cancer |
33 | 28 |
|
Chronic kidney disease: Broad definition |
≤10 | ≤10 |
|
Chronic kidney disease: Narrow definition |
≤10 | ≤10 |
NOTES: CNS = central nervous system; PNS = peripheral nervous system. Cell sizes smaller than 11 were reported as “≤10” to prevent identification of any individual.
TABLE 4-8 Survival Analysis Using Proportional Hazards Regression: Cause-Specific Mortality for Hypothesized Health Outcomes (Adjusted for Age and Rank)
| Potential Exposure/ Cause of Death | Number of Deaths | Unadjusted HR (95% CI) | Adjusted HRa (95% CI) | Enlisted Only | ||||
| SHAD Participants | Comparison Group | Adjusted HRb (95% CI) | ||||||
| Betapropiolactone and cancer | 51 | 61 | 0.84 (0.58-1.22) | 0.86 (0.53-1.41) | 0.87 (0.54-1.41) | |||
| Zinc cadmium sulfide and lung cancer | 33 | 28 | 1.76 (0.68-4.55) | 1.44 (0.66-3.17) | 1.37 (0.60-3.10) | |||
NOTES: CI = confidence interval; HR = hazard ratio. SAS version 9.4 was used in all analyses.
a Adjusted for age and rank (officer/enlisted).
b Adjusted for age only.
Examining an Association Between Number of Potential Exposures and Mortality from Specified Health Outcomes
The committee also examined the possibility that the numbers of times SHAD test participants were potentially exposed to the substances of interest was associated with an increase in risk of mortality. The committee grouped the test participants into groups depending upon the distribution of the numbers of test trials that individuals were exposed to. Details of the basis for this grouping are provided in Appendix D. Table 4-9 shows the hazard ratios and confidence intervals for risk of mortality from any cause by numbers of exposures to the substances. The comparison is with people on similar ships without any SHAD test exposures. The numbers of exposures to C. burnetii and sarin were too similar across the exposed groups to justify establishing higher and lower levels of exposure.
Exploratory Analyses of Mortality
In addition to testing the hypotheses regarding specific health outcomes that were identified as potentially associated with exposure to certain substances used in Project SHAD, the committee examined mortality for broader exposure groupings and other subgroups of special interest. These groupings were defined as (1) exposure to any biological test substance; (2) exposure to any chemical test substance (except trioctyl phosphate [TOF]); (3) exposure to any decontaminant; (4) exposure to TOF, which was used only in Test 69-10; (5) service on the light tugs or as Project SHAD staff on the USS Granville S. Hall, and (6) service on the USS George Eastman. These groups are not necessarily mutually exclusive. Because many SHAD tests included the use of multiple substances (e.g., a biological agent such as B. globigii and a chemical tracer such as zinc cadmium sulfide), a given SHAD veteran may be included in more than one of these groups. However, the men who were exposed to TOF in Test 69-10 had no other reported exposures.
The committee also reviewed the mortality of crews of each of the individual vessels and other units involved in Project SHAD to see if any unit warranted additional scrutiny. This crude analysis suggested no atypical mortality for any specific unit that would warrant additional follow up (data not shown).
TABLE 4-9 Proportional Hazards Regression for Overall Mortality for Groups with Lower and Higher Exposure to Selected Substances and the Comparison Groups
| Exposure and Exposure Frequency | Assumed Alive | Deceased | Unadjusted Hazard Ratio (95% CI) | Adjusted Hazard Ratioa (95% CI) | ||||
| Betapropiolactone | ||||||||
|
0 exposures (comparison group) |
385 | 222 | 1 | 1 | ||||
|
1 to 5 |
156 | 66 | 0.89 (0.61-1.31) | 0.94 (0.68-1.30) | ||||
|
≥6 |
243 | 130 | 0.99 (0.72-1.37) | 1.02 (0.78-1.33) | ||||
|
Standard error of Ship ID (used as a random effect) |
(0.0262) | (0.0187) | ||||||
| Zinc cadmium sulfide | ||||||||
|
0 exposures |
507 | 266 | 1 | 1 | ||||
|
1 to 29 |
268 | 132 | 0.95 (0.76-1.18) | 0.98 (0.70-1.38) | ||||
|
≥30 |
180 | 101 | 1.11 (0.87-1.40) | 0.88 (0.64-1.22) | ||||
|
Standard error of Ship ID (used as a random effect) |
(0.0141) | (0.0261) | ||||||
NOTES: CI = confidence interval. Ship ID was used in the model as random effect. SAS version 9.4 was used in all analyses.
a Adjusted for age and rank (officer/enlisted).
Information on the vital status of the members of these exposure groups is presented in Table 4-10. Except for the TOF group, and those who served on the tugs and Project SHAD technical staff, roughly two-thirds of both the SHAD participants and the comparison groups are assumed to be alive as of December 31, 2011. Approximately three-fourths of the TOF group were assumed to be alive. This group participated in Test 69-10, which was one of the last two SHAD tests, and the participants and comparison group are younger on average than the other groups. Across all exposure groups, there were 3-4 percent of subjects for whom only a date of death or fact of death was available, with the exception of the tugs where this was close to 5 percent.
All-Cause Mortality for Subgroups of Special Interest
The committee examined all-cause mortality among the SHAD veterans in the subgroups of special interest and their respective comparison groups. As shown in Table 4-11, mortality among the members of the special subgroups was not significantly different from their comparison groups. Similarly, stratifying the groups on the basis of rank (officer and enlisted) resulted in no statistically significant differences. Members of the tug and Project SHAD technical staff groups had higher crude mortality when compared to the other members of the crew of the USS Granville S. Hall (internal control) and to the crew of the comparison vessel for the USS Granville S. Hall (external control), but this was accounted for by a difference in age in the two groups (data not shown) and the difference was not statistically significant after adjustment for age.
TABLE 4-10 Vital Status and Availability of Data on Death for Subgroups of Special Interest and Their Comparison Groups as of December 31, 2011
| Exposure Group and Vital Status | Project SHAD Participants | Comparison Group | ||||||
| Any Biological Substance | ||||||||
| Total group | 3,050 | 3,530 | ||||||
| Assumed alive | 2,003 (65.7%) | 2,311 (65.5%) | ||||||
| Total known dead | 1,047 (34.3%) | 1,219 (34.5%) | ||||||
|
Cause of death available |
965 (31.6%) | 1,113 (31.5%) | ||||||
|
Only date or fact of death available |
82 (2.7%) | 106 (3.0%) | ||||||
| Any Chemical Substance (except Trioctyle Phosphate) | ||||||||
| Total group | 2,536 | 2,804 | ||||||
| Assumed alive | 1,694 (66.70%) | 1,916 (68.3%) | ||||||
| Total known dead | 842 (33.2%) | 888 (31.7%) | ||||||
|
Cause of death available |
775 (30.6%) | 818 (29.2%) | ||||||
|
Only date or fact of death available |
67 (2.6%) | 70 (2.5%) | ||||||
| Any Decontaminant | ||||||||
| Total group | 730 | 782 | ||||||
| Assumed alive | 493 (67.5%) | 517 (66.1%) | ||||||
| Total known dead | 237 (32.5%) | 265 (33.1%) | ||||||
|
Cause of death available |
217 (29.7%) | 235 (30.1%) | ||||||
|
Only date or fact of death available |
20 (2.7%) | 30 (3.8%) | ||||||
| Trioctyl Phosphate | ||||||||
| Total group | 861 | 869 | ||||||
| Assumed alive | 656 (76.2%) | 668 (76.9%) | ||||||
| Total known dead | 205 (23.8%) | 201 (23.1%) | ||||||
|
Cause of death available |
182 (21.1%) | 172 (19.8%) | ||||||
|
Only date or fact of death available |
23 (2.8%) | 29 (3.3%) | ||||||
| Tugs and Project SHAD Technical Staff | Internal Comparison | External Comparison | ||||||
| Total group | 103 | 127 | 210 | |||||
| Assumed alive | 59 (57.2%) | 86 (67.7%) | 136 (64.8) | |||||
| Total known dead | 44 (42.7%) | 41 (32.3%) | 74 (35.2) | |||||
|
Cause of death available |
39 (37.8%) | 38 (29.9%) | 69 (32.9) | |||||
|
Only date or fact of death available |
5 (4.9%) | 3 (2.4%) | 5 (2.4) | |||||
| Crew of the USS George Eastman | ||||||||
| Total group | 356 | 47 | ||||||
| Assumed alive | 228 (64.0%) | 506 (69.1%) | ||||||
| Total known dead | 128 (36.0%) | 241 (32.3%) | ||||||
|
Cause of death available |
119 (33.4%) | 218 (29.2%) | ||||||
|
Only date or fact of death available |
9 (2.5%) | 23 (3.1%) | ||||||
TABLE 4-11 Survival Analysis Using Proportional Hazards Regression: All-Cause Mortality for SHAD Participants Versus Comparison Groups
| Exposure Group and Risk Factor | Unadjusted Hazard Ratio (95% CI) | Adjusted Hazard Ratio (95% CI) |
| Any Biological Test Substance | ||
|
Participant (n = 3,050, known dead = 1,047) versus comparison (n = 3,530, known dead = 1,219 with known date of death) |
1.02 (0.88-1.20) | 0.96a (0.86-1.08) |
|
Enlisted (P, n = 2,793, known dead = 981) versus Enlisted (C, n = 3,257, known dead = 1,158) |
1.01 (0.88-1.17) | 0.97b (0.87-1.09) |
| Any Chemical Test Substance (excluding TOF) | ||
|
Participant (n = 2,536, known dead = 842) versus comparison (n = 2,804, known dead = 888) |
1.11 (0.94-1.31) | 1.03a (0.91-1.17) |
|
Enlisted (P, n = 2,319, known dead = 786) versus Enlisted (C, n = 2,596, known dead = 844) |
1.10 (0.95-1.28) | 1.04b (0.91-1.18) |
| Any Decontaminant | ||
|
Participant (n = 730, known dead = 237) versus comparison (n = 782, known dead = 265) |
1.01 (0.79-1.29) | 1.08a (0.83-1.41) |
|
Enlisted (P, n = 668, known dead = 220) versus Enlisted (C, n = 709, known dead = 252) |
0.97 (0.77-1.21) | 1.07b (0.81-1.42) |
| Trioctyl Phosphate | ||
|
Participant (n = 861, known dead = 205) versus comparison (n = 869, known dead = 201) |
1.08 (0.83-1.39) | 0.90a (0.60-1.35) |
|
Enlisted (P, n = 822, known dead = 199) versus Enlisted (C, n = 827, known dead = 196) |
1.06 (0.83-1.37) | 0.90b (0.61-1.33) |
| Tugs or Project SHAD Technical Staff | ||
|
Participant (n = 103, known dead = 44) versus internal comparison (n = 127, known dead = 41)c |
1.83 (1.08-3.09) | 1.12a (0.65-1.93) |
|
Participant (n = 103, known dead = 44) versus external comparison (n = 210, known dead = 74)d |
1.20 (0.40-3.60) | 0.78a (0.22-2.78) |
|
Enlisted (P, n = 88, known dead = 39) versus internal comparison Enlisted (C, n = 115, known dead = 38)c |
1.97 (1.13-3.45) | 1.20b (0.67-2.14) |
|
Enlisted (P, n = 88, known dead = 39) versus external comparison Enlisted (C, n = 191, known dead = 71)d |
1.19 (0.37-3.87) | 0.73b (0.20-2.70) |
| Crew of the USS George Eastman | ||
|
Participant (n = 356, known dead = 128) versus comparison (n = 747, known dead = 241) |
1.18 (0.92-1.52) | 1.19a (0.95-1.49) |
|
Enlisted (P, n = 314, known dead = 117) versus Enlisted (C, n = 697, known dead = 231) |
1.21 (0.87-1.69) | 1.18b (0.94-1.49) |
NOTES: CI = confidence interval. SAS version 9.4 was used in all analyses.
a Adjusted for age and officer/enlisted.
b Adjusted for age only. Ship ID is used as random term.
c Comparison is an “internal control” made up of the crew of the USS Granville S. Hall who were not part of the Project SHAD technical staff.
d Comparison is an “external control” made up of the crew of the USS Interceptor, which was the comparison ship for the USS Granville S. Hall.
Examining an Association Between Number of Potential Exposures and Mortality in Subgroups of Special Interest
The committee also examined the possibility that the numbers of times SHAD test participants were potentially exposed to the substances of interest was associated with an increase in risk of mortality. The committee grouped the test participants into two or three groups, depending upon the distribution of the numbers of test trials that individuals were exposed to. Details of the basis for this grouping are provided in Appendix D. Table 4-12 shows the hazard ratios and confidence intervals for risk of mortality from any cause associated with varying numbers of potential exposures to the substances listed for each the special subgroups considered, compared with people on similar ships without any SHAD exposures. Such groupings were not feasible for groups exposed to TOF and for the other special subgroups listed in Table 4-10 because the people involved were present for similar numbers of potential exposures.
TABLE 4-12 Hazard Ratios for Overall Mortality for Groups in the Subgroups of Special Interest with Lower and Higher Potential Exposure
| Potential Exposure and Number of Exposures | Assumed Alive | Deceased | Unadjusted Hazard Ratio (95% CI) | Adjusted Hazard Ratioa (95% CI) | ||||
| Any Biological Test Substance | ||||||||
|
0 (comparison group) |
2,311 | 1,219 | 1 | 1 | ||||
|
1 to 53 |
1,823 | 946 | 1.02 (0.87-1.20) | 0.98 (0.86-1.11) | ||||
|
≥54 |
180 | 101 | 1.03 (0.80-1.33) | 0.89 (0.70-1.14) | ||||
|
Standard error of ship ID (used as a random effect) |
(0.0065) | |||||||
| Any Chemical Test Substance (excluding TOF) | ||||||||
|
0 |
1,916 | 888 | 1 | 1 | ||||
|
1 to 20 |
1,216 | 596 | 1.05 (0.88-1.26) | 1.05 (0.91-1.21) | ||||
|
≥21 |
478 | 246 | 1.25 (1.00-1.55) | 0.99 (0.82-1.19) | ||||
|
Standard error of ship ID (used as a random effect) |
(0.0076) | |||||||
| Any Decontaminant | ||||||||
|
0 |
517 | 265 | 1 | 1 | ||||
|
1 to 5 |
162 | 82 | 1.05 (0.76-1.46) | 1.07 (0.76-1.52) | ||||
|
6 to 10 |
250 | 132 | 1.08 (0.80-1.48) | 1.15 (0.83-1.59) | ||||
|
≥11 |
81 | 23 | 0.70 (0.42-1.14) | 0.88 (0.53-1.47) | ||||
|
Standard error of ship ID (used as a random effect) |
(0.0256) | |||||||
NOTES: CI = confidence interval; TOF = trioctyl phosphate. SAS version 9.4 was used in all analyses.
a All factors are adjusted simulatenously for age and rank. Ship ID is used as random term.
Cause-Specific Mortality for Subgroups of Special Interest
Analysis of cause-specific mortality for the group of participants exposed to any biological test substances (listed in Box 3-1) indicated a decreased risk of death from injury and external causes for all of the participants when analyzed as a group, and for enlisted participants but not officers when assessed separately (see Table 4-13). The committee did not pursue this result further because its interest was in the potential for increased rather than decreased risk among Project SHAD exposure groups.2 After adjustment for age and rank, no statistically significant differences were found for those exposed to any chemical test substance (except TOF), any decontaminant, or TOF (also adjusted for service branch). Nor were there significant differences for the men who served on the tugs or were part of the Project SHAD technical staff. There was a statistically significant increase in the hazard ratio for heart disease mortality for the crew of the USS George Eastman. However, when the committee applied an adjustment to take into account the multiple tests it carried out to compare the mortality of the USS George Eastman crew with the comparison group (tests to compare mortality from cancer, heart disease, and respiratory disease), the result no longer attained statistical significance. Additional details of this adjustment are provided in Appendix D.
TABLE 4-13 Survival Analysis Using Proportional Hazards Regression: Cause-Specific Mortality for SHAD Participant Subgroups of Special Interest Versus Comparison Groups
| Exposure Group and Cause of Death | Deaths | Unadjusted HR (95% CI) | Adjusted HRa (95% CI) | Enlisted Only Adjusted HRb (95% CI) | ||||
| SHAD Participants | Comparison Group | |||||||
| Any Biological Test Substance (SHAD participants n = 3,050, comparison n = 3,530) | ||||||||
| Cancer | 326 | 393 | 0.98 (0.80-1.20) | 0.91 (0.79-1.06) | 0.94 (0.81-1.10) | |||
| Heart disease | 312 | 336 | 1.06 (0.85-1.32) | 1.03 (0.83-1.27) | 1.03 (0.81-1.31) | |||
|
Ischemic heart disease |
193 | 219 | 1.02 (0.81-1.29) | 0.99 (0.77-1.27) | 0.98 (0.75-1.27) | |||
|
Other heart disease |
119 | 117 | 1.12 (0.80-1.57) | 1.11 (0.82-1.51) | 1.16 (0.82-1.64) | |||
| Respiratory disease | 78 | 93 | 0.96 (0.68-1.34) | 0.95 (0.65-1.39) | 1.00 (0.67-1.47) | |||
| Endocrine and metabolic disease | 33 | 33 | 1.15 (0.71-1.87) | 1.17 (0.72-1.91) | 1.11 (0.68-1.83) | |||
| Injury/external causes | 69 | 106 | 0.75 (0.55-1.02) | 0.72 (0.53-0.97) | 0.69 (0.50-0.94) | |||
| Infectious disease | 26 | 20 | 1.49 (0.75-2.98) | 1.32 (0.68-2.53) | 1.34 (0.66-2.70) | |||
| Neurocognitive disease | 14 | 16 | 0.99 (0.43-2.26) | 0.92 (0.41-2.08) | 0.67 (0.25-1.79) | |||
| Digestive disease | 38 | 43 | 1.03 (0.62-1.71) | 0.99 (0.62-1.58) | 0.98 (0.61-1.56) | |||
| Any Chemical Test Substance (excluding TOF) (SHAD participants n = 2,536, comparison n = 2,804) | ||||||||
| Cancer | 244 | 256 | 1.10 (0.89-1.35) | 1.02 (0.86-1.22) | 1.06 (0.88-1.28) | |||
| Heart disease | 257 | 264 | 1.10 (0.89-1.35) | 1.05 (0.89-1.25) | 1.07 (0.90-1.28) | |||
|
Ischemic heart disease |
158 | 170 | 1.06 (0.83-1.35) | 1.01 (0.81-1.25) | 1.02 (0.81-1.27) | |||
______________
2 The reported statistical significance is the result of an implicit two-sided alternative of any difference between the SHAD population and the comparison population: it would not be observed if a one-sided alterantive of higher risk among SHAD population were explicitly used.
| Exposure Group and Cause of Death | Deaths | Unadjusted HR (95% CI) | Adjusted HRa (95% CI) | Enlisted Only Adjusted HRb (95% CI) | ||||
| SHAD Participants | Comparison Group | |||||||
|
Other heart disease |
99 | 94 | 1.15 (0.81-1.64) | 1.13 (0.83-1.53 | 1.16 (0.86-1.58) | |||
| Respiratory disease | 65 | 57 | 1.28 (0.85-1.93) | 1.21 (0.82-1.77) | 1.24 (0.84-1.85) | |||
| Endocrine and metabolic disease | 26 | 32 | 0.92 (0.55-1.54) | 0.88 (0.52-1.48) | 0.85 (0.50-1.47) | |||
| Injury/external causes | 70 | 78 | 1.01 (0.74-1.44) | 1.01 (0.71-1.44) | 0.93 (0.67-1.31) | |||
| Infectious disease | 18 | 15 | 1.35 (0.68-2.69) | 1.09 (0.53-2.22) | 1.04 (0.49-2.21) | |||
| Neurocognitive disease | ≤10 | 15 | 0.53 (0.22-1.29) | 0.51 (0.21-1.25) | 0.44 (0.17-1.15) | |||
| Digestive disease | 34 | 37 | 1.04 (0.64-1.70) | 0.98 (0.61-1.57) | 0.93 (0.57-1.51) | |||
| Any Decontaminant (SHAD participants n = 730, comparison n = 782) | ||||||||
| Cancer | 65 | 76 | 0.91 (0.64-1.29) | 0.93 (0.60-1.44) | 0.92 (0.56-1.49) | |||
| Heart disease | 74 | 75 | 1.10 (0.66-1.83) | 1.22(0.76-1.96) | 1.24 (0.73-2.11) | |||
|
Ischemic heart disease |
52 | 47 | 1.21 (0.71-2.04) | 1.35 (0.84-2.18) | 1.33 (0.81-2.20) | |||
|
Other heart disease |
22 | 28 | 0.91 (0.38-2.22) | 0.99 (0.39-2.46) | 1.02 (0.41-2.56) | |||
| Respiratory disease | 21 | 22 | 1.09 (0.45-2.64 | 1.17 (0.49-2.77) | 1.16 (0.50-2.71) | |||
| Endocrine and metabolic disease | ≤10 | ≤10 | 1.43 (0.49-4.11) | 1.56 (0.54-4.51) | 1.41 (0.47-4.22) | |||
| Injury/external causes | 14 | 20 | 0.76 (0.35-1.64) | 0.76 (0.35-1.66) | 0.82 (0.36-1.86) | |||
| Infectious disease | ≤10 | ≤10 | 1.65 (0.43-6.39) | 1.63 (0.41-6.40) | 1.49 (0.24-9.18) | |||
| Neurocognitive disease | ≤10 | ≤10 | 0.53 (0.10-2.91) | 0.67 (0.12-3.68) | 0.67 (0.12-3.68) | |||
| Digestive disease | 11 | ≤10 | 1.92 (0.49-7.59) | 1.89 (0.50-7.22) | 1.63 (0.40-6.60) | |||
| Trioctyl Phosphate (SHAD participants n = 861, comparison n = 869) | ||||||||
| Cancer | 49 | 59 | 0.83 0.54-1.30 | 0.73 (0.40-1.35) | 0.72 (0.39-1.31) | |||
| Heart disease | 74 | 49 | 1.46 0.83-2.57 | 1.22 (0.64-2.33) | 1.19 (0.64-2.23) | |||
|
Ischemic heart disease |
44 | 26 | 1.71 (1.03-2.84) | 1.47 (0.73-2.96) | 1.45 (0.77-2.77) | |||
|
Other heart disease |
30 | 23 | 1.29 (0.67-2.49) | 1.07 (0.53-2.18) | 1.03 (0.48-2.23) | |||
| Respiratory disease | 14 | ≤10 | 2.37 (0.91-6.16) | 1.68 (0.64-4.44) | 2.52 (0.82-7.72) | |||
| Endocrine and metabolic disease | ≤10 | ≤10 | 2.02 (0.51-8.08) | 2.39 (0.48-11.86) | 2.39 (0.48-11.86) | |||
| Injury/external causes | 15 | 18 | 0.94 (0.35-2.51) | 0.81 (0.31-2.07) | 0.81 (0.31-2.07) | |||
| Infectious disease | ≤10 | ≤10 | 0.45 (0.12-1.73) | 0.47 (0.14-1.63) | 0.47 (0.14-1.63) | |||
| Neurocognitive disease | ≤10 | ≤10 | 0.67 (0.11-4.01) | 0.53 (0.09-3.15) | 0.53 (0.09-3.15) | |||
| Digestive disease | ≤10 | 14 | 0.45 (0.13-1.58) | 0.34 (0.10-1.12) | 0.34 (0.10-1.12) | |||
| Tugs and Project SHAD Technical Staff (n = 103) | ||||||||
| Comparison to Internal Controlsc (n = 127) | ||||||||
| Cancer | 22 | 19 | 2.00 (0.99-4.04) | 1.27 (0.61-2.66) | 1.33 (0.60-2.94) | |||
| Heart disease | ≤10 | ≤10 | 1.85 (0.67-5.14) | 1.08 (0.38-3.08) | 0.90 (0.31-2.62) | |||
|
Ischemic heart disease |
≤10 | ≤10 | 4.18 (1.16-15.01) | 2.56 (0.69-9.56) | 2.20 (0.57-8.49) | |||
|
Other heart disease |
≤10 | ≤10 | 0.16 (0.01-3.44) | 0.11 (0.01-1.83) | 0.11 (0.01-1.83) | |||
| Exposure Group and Cause of Death | Deaths | Unadjusted HR (95% CI) | Adjusted HRa (95% CI) | Enlisted Only Adjusted HRb (95% CI) | ||||
| SHAD Participants | Comparison Group | |||||||
| Respiratory disease | ≤10 | ≤10 | 1.96 (0.33-11.76) | 0.92 (0.15-5.67) | 2.09 (0.21-20.35) | |||
| Comparison to External Controlsd (n = 210) | ||||||||
| Cancer | 22 | 18 | 2.54 (0.77-8.38) | 1.86 (048-7.20) | 1.63 (0.34-7.82) | |||
| Heart disease | ≤10 | 26 | 0.71 (0.17-2.90) | 0.47 (0.11-1.92) | 0.43 (0.13-1.46) | |||
|
Ischemic heart disease |
≤10 | 18 | 0.80 (0.14-4.60) | 0.52 (0.08-3.28) | 0.49 (0.09-2.60) | |||
|
Other heart disease |
≤10 | ≤100 | 0.34 (0.01-13.33) | 0.21 (0.01-5.91) | 0.21 (0.01-5.91) | |||
| Respiratory disease | ≤10 | ≤10 | 0.78 (0.21-2.88) | 0.42 (0.11-1.61) | 0.42 (0.11-1.61) | |||
| USS George Eastman (SHAD participants n = 356,comparison n = 747) | ||||||||
| Cancer | 26 | 65 | 0.87 (0.55-1.37) | 0.84 (0.53-1.34) | 0.89 (0.55-1.44) | |||
| Heart disease | 49 | 72 | 1.47 (0.98-2.21) | 1.48 (1.03-2.14)e | 1.46 (1.01-2.12) e | |||
|
Ischemic heart disease |
34 | 47 | 1.56 (1.00-2.43) | 1.55 (0.99-2.42) | 1.52 (0.97-2.40) | |||
|
Other heart disease |
15 | 25 | 1.29 (0.64-2.64) | 1.35 (0.71-2.57) | 1.35 (0.71-2.56) | |||
| Respiratory disease | ≤10 | 24 | 0.82 (0.31-2.15) | 0.79 (0.37-1.70) | 0.68 (0.29-1.58) | |||
NOTES: CI = confidence interval; TOF = trioctyl phosphate. Cell sizes smaller than 11 were reported as ≤10 to prevent identification of any individual. SAS version 9.4 was used in all analyses.
a Adjusted for age and officer/enlisted. Ship ID used as a random term. Analyses of the group exposed to TOF were also adjusted for service branch (Navy versus Marines and other).
b Adjusted for age only. Ship ID is used as random term.
c Comparison is an “internal control” made up of the crew of the USS Granville S. Hall who were not part of the Project SHAD technical staff.
d Comparison is an “external control” made up of the crew of the USS Interceptor, which was the comparison ship for the USS Granville S. Hall.
e P-values under the alternative of an odds ratio greater than 1 were adjusted for an overall false discovery rate (FDR) of 5 percent, taking into account three tests; after this adjustment the increase in heart disease risk was no longer statistically significant at the 5 percent FDR level.
REFERENCES
IOM (Institute of Medicine). 2007. Long-term health effects of participation in Project SHAD (Shipboard Hazard and Defense). Washington, DC: The National Academies Press.
WHO (World Health Organization). 2015. International Classification of Diseases (ICD). http://www.who.int/classifications/icd/en/ (accessed August 4, 2015).


