
CHAPTER TWO
Framing
“What we observe is not nature itself, but nature exposed to our method of questioning.”
—Werner Heisenberg
To answer a question scientifically, the question needs to be posed in a way that is amenable to scientific analysis. The question often asked by the public and the media, “Was this extreme event caused by anthropogenic climate change, yes or no?” is not well posed because the word “cause” can have several different meanings. For a record-breaking extreme event, a potential rephrasing of this question might be “Could an event of this severity have happened in this location and time of year without climate change?” Generally speaking the answer will be “yes” because observational records are too short to have well sampled the full range of climate possibilities. In this case a more informative rephrasing of the question could be “Are events of this severity becoming more or less likely because of climate change?” For a weather event such as a storm, which in detail is always unique, a potential rephrasing of the question might be “To what extent was the storm intensified, or its precipitation increased, because of climate change?”
How event attribution questions are posed, and the context within which they are posed, is referred to as framing. The developing literature on event attribution has shown that the framing of questions is fundamental to the choice of method that is used and can lead to large differences in the interpretation of evidence regarding whether human influence on the climate system played a role. This chapter explores the different ways in which event attribution studies can be framed.
The chapter begins with a number of framing issues that arise in any event attribution study. It goes on to discuss the additional framing issues that arise when the attribution is conditional on the state of the climate system (e.g., for a given sea-surface temperature [SST] pattern, such as that associated with El Niño–Southern Oscillation [ENSO]), a naturally occurring source of interannual variability). Because all event attribution is performed and interpreted within the broader context of the scientific understanding of climate change, this too represents part of the framing and so is explicitly discussed in that vein. The interest in extreme events is typically driven by their impacts on society, which raises further framing issues when non-climate anthropogenic factors come into play. Finally, because the choice of which events to study is
another aspect of framing, the possible role of selection bias in affecting the interpretation of collections of attribution studies also is discussed.
GENERAL CONSIDERATIONS
The traditional and perhaps easiest-to-interpret approach to event attribution posits that the probability of an event is related in some way to the observed event and thus uses model simulations or observational data. It does this for both the factual (currently observable) world as it exists in the context of climate change and a hypothetical counterfactual world without climate change; the difference between the factual and counterfactual probabilities is taken to represent the effect of climate change.
Attribution refers to causation, but there are different kinds of causation. In the classical (deterministic) context, causation can be either necessary or sufficient, and these concepts have probabilistic counterparts (Hannart et al., 2015a; Pearl, 2009). Necessary causation means that the event can occur only in the presence of the causal factor, but it could be that other causal factors are necessary too. Multiple causation is typical with weather-related extremes, where many conditions must align to set up a particular event. An example would be a record-breaking heat wave that occurred in the presence of a summertime blocking1 anti-cyclonic circulation, a condition known to lead to heat waves. One possibility is that the observed temperature conditions could have occurred in either the factual or the counterfactual world (and just had not previously been observed because of the shortness of the observational record), but that the likelihood is substantially higher in the factual world because of the increase in mean temperature. Another possibility is that the temperature conditions would have been effectively impossible in the counterfactual world and were possible in the factual world (though still rare) only because of the mean warming. In this latter case, it may be said that the event could only have occurred because of climate change.
In contrast, sufficient causation concerns whether the presence of the causal factor alone is enough to produce the event. For extreme events, for which the probability of an event is generally low, climate change (which is always present in the factual climate) cannot be a sufficient cause. Sufficient causation would arise only when climate change has caused an event to have become very likely and no longer be extreme in the current climate (relative only to the historical baseline).
___________________
1 “Blocking” is a disruption of the prevailing westerly flow that is associated with anomalous warm and cool temperatures.
Interpretation of Single Events and Causation
Event attribution questions are often posed in terms of a specific actual event, but definitive attribution of a specific event in a deterministic manner is generally not possible. This is because on the one hand, most events could have happened in the counterfactual world (so the probability of necessary causation is less than 100%), while on the other hand, the entire climate system, and therefore all extreme events, are being affected by climate change (as discussed further below), thereby obviating the question. Therefore, event attribution is usually a matter of changing probabilities rather than a deterministic yes or no. For example, a scientific researcher might repose the question “Was Hurricane Sandy caused by climate change?” as “How much did human influence on climate increase the odds of a tropical or post-tropical storm with winds greater than 65 knots making landfall in northern New Jersey?” Moreover, analysts necessarily estimate relevant probabilities using more than just the event in question. In fact, probabilities are usually estimated using a definition of an event that differs from the specific event, such as by estimating the probability of an event as or more extreme than the event of interest. As a result, the answers obtained are no longer directly about the actual event. Epidemiology concentrates heavily on such a probabilistic framing, which is discussed in relation to other possible framings in Parascandola and Weed (2001). For example, Rothman’s Epidemiology: An Introduction (Rothman, 2012) frames strength of causation as relating to probabilities that pertain to collections of events, in contrast to his deterministic perspective on individual events:“With respect to an individual case of disease, however, every component cause that played a role was necessary to the occurrence of that case.”
Hannart and colleagues (2015a) present a causal framework for event attribution that provides probabilities of necessary and of sufficient causation. They show that the metric known as the fraction of attributable risk (FAR), which was introduced to extreme event attribution by Allen (2003), can be interpreted as an estimate of the probability of necessary causation (by anthropogenic forcing) of an event. It is interesting to note that the argument made by Allen (2003) for interpreting the FAR as applying to an individual event was actually a legal one rather than a physical one: namely, that an uninsured loss should be equated with the cost of insurance against a similar loss.
The FAR, however, is perhaps the easiest to interpret when an “event” is taken to be a class of events (e.g., all events as intense or more intense than the event that has been observed) rather than an individual event. In this case, a FAR of 80% would mean that four of five events belonging to the class of events in the factual world would not have happened in the counterfactual world. This interpretation corresponds to the prob-
abilities that are currently estimated in event attribution studies, which are not those of the actual event but are of a broader class.
While Hannart and colleagues (2015a) provide some very useful insights, a focus on formal analysis of causation may distract attention from important questions about changing probabilities of extreme events and their impacts on risk, which may be the more important questions from scientific and impacts/adaptation perspectives. Physically, the notion that an event may not have been affected by climate change can be difficult to justify in a climate system in which everything is connected. This point is made by Hansen and colleagues (2014b), Solow (2015), and Trenberth (2012), who suggest that given the pervasive effects of anthropogenic influence on the climate—unlike, for example, the isolated effect of smoking on an individual smoker—it may not make sense to speak about whether an event has or has not been caused or affected by anthropogenic influence. In reality, all events are occurring in a world influenced by anthropogenic climate change, but one can still clearly talk about changes in probability.
Frequency Versus Magnitude
If an extreme event truly is rare in the current climate, then almost by definition it required some unusual meteorological situation to be present, and the effect of climate change is only a contributing factor. For example, a heat wave induced by an unusually persistent summertime atmospheric high pressure system situation (i.e., blocking) would be exacerbated by anthropogenic warming of several degrees Celsius (C) (leaving aside possible amplifiers such as soil-moisture feedbacks, for simplicity), but it may have been a heat wave nonetheless. In this case, to reach the recorded temperature extreme both the unusual blocking situation and the anthropogenic warming were necessary conditions. Attribution in such a case with several necessary causal factors is heavily dependent on the framing and also is liable to misinterpretation. In studies of the 2010 Russian heat wave, for example, one study concluded that the event was largely natural because the temperature anomalies were greatly in excess of those explainable by long-term trends (Dole et al., 2011), whereas another concluded that the anthropogenic influence was significant because long-term climate change, though small, greatly increased the probability of exceeding specified temperature thresholds (Rahmstorf and Coumou, 2011). This apparent contradiction in conclusions can be reconciled by understanding that these two studies aim at answering the attribution question in two different ways. In this particular case, a small change in the magnitude of the mean can correspond to a large change in the frequency of extremes (Otto et al., 2012; see Figure 2.1) because of anthropogenic influence. Interpretation therefore
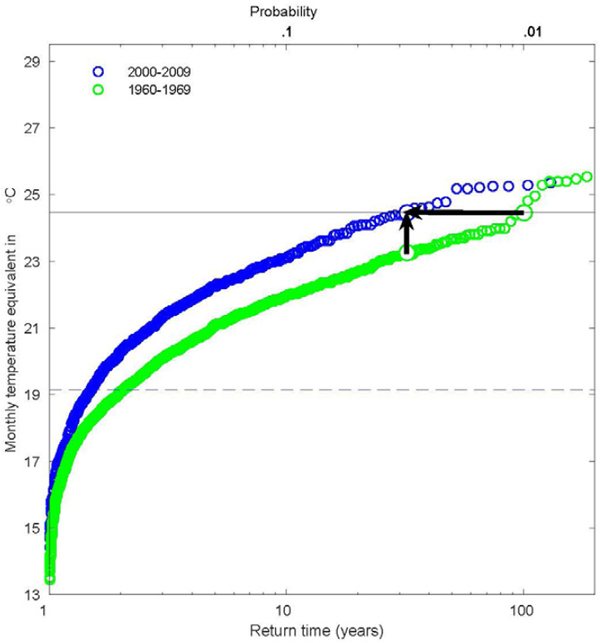
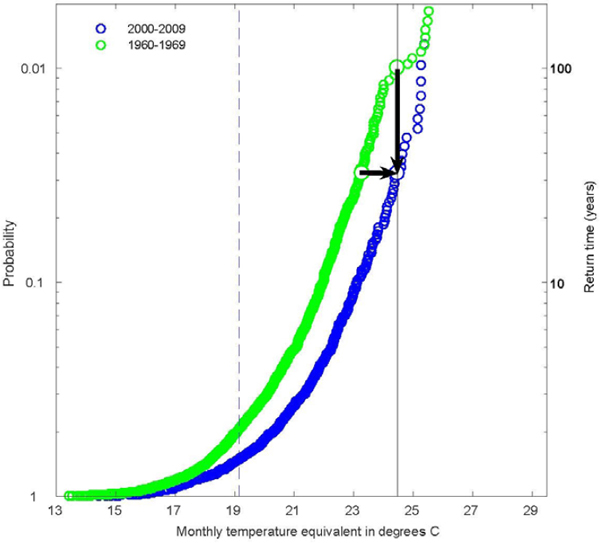
ultimately depends on whether the interest in a particular type of event is predominantly related to changes in frequency for a given magnitude—which might be the case if, for example, exceedance of a fixed extreme temperature threshold leads to a marked impact such as a reduction in crop yield—or to changes in magnitude for a given frequency—which might be the case if, for example, it was required to design structures capable of withstanding the event magnitude associated with a prescribed return time.
Event Definition
In order to facilitate probabilistic analysis, a particular event is usually generalized to a broader class of event. Analyses may use the magnitude of an actual event and quantify probabilities of exceeding that observed magnitude, or they may use a percentile from the climatology in place of the magnitude of an actual event. Analyses also may focus on events over a longer timescale and larger region than those of the event itself, considering the causes of the prevailing climatic conditions that provide the context for the event rather than the specifics of the event itself (e.g., Stott et al., 2004). Generally speaking, using a larger spatio-temporal footprint will emphasize more strongly the anthropogenic role (e.g., Fischer et al., 2013).
Furthermore, in some cases different physical variables may be considered. For example, studies of the recent California drought focusing on precipitation deficit have tended to find no discernible anthropogenic influence (Seager et al., 2015), while those focusing on a combination of precipitation deficit and high temperature (which affects evaporation) have tended to find an anthropogenic influence (Diffenbaugh et al., 2015; Williams et al., 2015). These different definitions of drought can lead to confusion if the difference is not recognized.
Event definitions should take the limitations of both observations and models into account. For example, if an observationally based approach (see Chapter 3) is to be used to estimate changes in the probability or magnitude of an event by comparing an earlier period with a recent period, then it would be necessary to ensure that (1) the observational data are of high quality (e.g., free of non-climatic heterogeneities), (2) the record is long enough to allow reliable comparison of extremes between two subperiods, and (3) human influences are accounted for in a defensible manner and that natural influences or non-climatic human influences do not confound the estimate. In the case of model-based approaches (see Chapter 3), event definitions should be constrained in such a way that the focus is on events that the model can simulate reliably and for the correct reasons.
A robust attribution analysis would show that results are qualitatively similar across a range of event definitions, acknowledging that quantitative results are expected to differ somewhat because of differences in definition. Results for particular spatial regions or scales or for particular temporal periods, seasons, or scales may differ from results for other regions, scales, or periods, but for a robust result, one would expect that results would be similar for events defined by similar characteristics, without strong sensitivity to the exact definition. One would hope, too, that results using different magnitudes for defining an event class would be similar, though as the magnitude becomes either non-extreme or very extreme, quantitative results are expected to differ. For instance, using structurally different methods, different regions, and different seasonal temperature thresholds, Christidis and colleagues (2014) and Sun and colleagues (2014) develop qualitatively similar estimates of the FAR of an extremely warm summer in China.
Fraction of Attributable Risk Versus Risk Ratio
Another aspect of framing concerns how the difference between the factual probability p1 and the counterfactual probability p0 (that is, the probability of the same event in a world that is identical but for the human influence on climate) is expressed. One choice is to express it as FAR = (p1 – p0)/p1. The limitations of FAR are well recognized in other fields: see, for example, the World Health Organization statement concerning the equivalent metric used in attributing causes of disease risk.2 One difficulty in any interpretation of the FAR is its tendency to saturate at values near one for very rare events: that is, events for which the estimated p0 is very close to zero. For such events, even small increments in the estimated likelihood of p1 of the event when considering the effects of human influence lead to a FAR close to 1, with little discrimination between smaller and larger increments in p1 relative to p0. Additionally, it is not designed for describing cases where the likelihood decreases, which can be the case with climate change (e.g., of cold extremes, which in some regions have become substantially less frequent [see, e.g., Cattiaux et al., 2010], and assessment in Bindoff et al., 2013). Hannart and colleagues (2015a) show that the probability of necessary causation is the maximum of 0 and the calculated FAR, and therefore it will be zero in cases of decreasing likelihood. Hence, the aggregation of attribution results using this metric would provide a biased overview of human influences on extreme events.
Another important limitation occurs when events have more than one causal factor, as will generally be the case for extreme events (as discussed above). For example, one
___________________
2 See http://www.who.int/healthinfo/global_burden_disease/metrics_paf/en (accessed May 31, 2016).
can easily imagine an extreme event that was affected both by anthropogenic factors and by a particular SST anomaly pattern (e.g., ENSO) such that both factors cause an increase in the probability of the event, but neither factor on its own is sufficient to make its frequency exceed a certain threshold. (Treating the factors separately assumes that the particular SST anomaly pattern is unrelated to climate change, an assumption that may or may not be justified.) If p0 is sufficiently small, then the FAR could be close to one for both causal factors. In an event attribution study of such an event, if only anthropogenic factors were considered, then a FAR near one could easily be interpreted to mean that anthropogenic factors are fully responsible for the event even when there are other causes. Rothman (2012) points out that the sum of FAR values of multiple causes is not constrained to sum to one. Failure to appreciate this feature of the FAR can lead to apparently conflicting viewpoints concerning a specific event.
Another potential weakness of the FAR is that the strength of necessary causation may be confused with the strength of the statistical evidence. For example, as a probabilistic extension of necessary causality, a FAR of 0.8 could be interpreted as there being an 80% likelihood that anthropogenic forcings were a necessary cause of the event. In analyses using statistics, however, “likely” is generally used to refer to the strength of the statistical evidence. To give a concrete example, a person could have little statistical certainty in an estimated FAR of 0.8 with a broad confidence interval of (0.1, 0.95) that indicates considerable ignorance about the true FAR. A reader, though, might be inclined to believe that the person is confident of the result if the focus is solely on the single value 0.8. Alternatively, a person could have high statistical certainty in a small FAR with a confidence interval of (0.05, 0.15) around an estimated FAR of 0.1, indicating little uncertainty about the true FAR. The difficulty lies in the fact that event attribution studies estimate a probability, so the discussion of likelihood may pertain to the magnitude of the estimated probability or to the uncertainty about that probability.
An alternative way of comparing probabilities is the risk ratio (RR)—RR = p1/p0. The FAR and the RR are mathematically equivalent—there is a one-to-one mapping between the two quantities—but the RR directly frames the result in terms of the relative probabilities under the two scenarios and is analogous to how epidemiological results are presented to the public. For instance, a member of the public is apt to be familiar with a statement such as “Smoking increases the probability of lung cancer by a factor of X.” Although the RR does not have the same causal interpretation as the FAR (Hannart et al., 2015a), that may not be disadvantageous if, as suggested earlier, the probabilistic causal interpretation of individual extreme events (as opposed to collections of events) is inappropriate in the case of climate extremes. Furthermore, a proba-
bilistic analysis done using model output can always be framed as reporting a ratio of probabilities explicitly as estimated based on the model such that this dependence on model quality is very clear. In contrast, a causal statement about a single real-world event is a much stronger statement directly about the real world, and the dependence on the model to estimate the causal quantity may not be as easily communicated and is easily overlooked.
The Null Hypothesis
Estimating the unconditional probabilities of very rare events is extremely challenging because of observational and model limitations, and it is difficult to quantify the uncertainties in the calculations. In addition, it becomes more difficult to discern human influence at smaller spatio-temporal scales (Angelil et al., 2014; Bindoff et al., 2013; Fischer et al., 2013) because analysis on these scales offers less opportunity to reduce the magnitude of natural variability through spatial and temporal averaging or other techniques. Although it is perfectly reasonable—and even advisable (Nicholls, 2001) to report an estimated magnitude of effect with an uncertainty interval that includes zero (i.e., no effect)—there is a tendency in climate science to regard such results as null results of there being no effect. That interpretation is incorrect, however: Failure to reject the null hypothesis of no effect should not be regarded as evidence in favor of there being no effect. An inability to rule out there being no effect (i.e., lack of statistical significance) does not necessarily mean that the effect is small; it may just mean that the uncertainties are large. Therefore, it could be misleading to report a result of no detectable effect of climate change as no effect of climate change. To avoid any misunderstanding, it is always advisable to focus on effect size and to report confidence intervals (or Bayesian analogues) rather than focusing on statistical significance (Nicholls, 2001).
CONDITIONAL ATTRIBUTION
Rather than attempting to answer questions about changes in probability or intensity considering only the influence of external forcing, a person may attempt to answer these questions after limiting or constraining the state of one or more slowly varying parts of the climate system. This “conditional attribution” approach has been used in many recent studies (see Chapter 3) that investigate the role of external forcing conditional upon the prevailing pattern of SST anomalies. The reasoning is often that the SST anomaly structure likely had an influence on the atmospheric circulation that
prevailed during the event, and that the effect of external forcing can be more clearly assessed by controlling for such internal influences.
A very similar approach involves conditioning on the state of the large-scale atmospheric circulation (Cattiaux et al., 2010; Yiou et al., 2007). While to date this has been applied mainly to observational analysis (see Chapter 3), it could in principle be applied to a climate model through some kind of nudging.3 For example, specifying the state of the stratosphere seems sufficient to constrain the winter-mean North Atlantic Oscillation in climate models (Douville, 2009), and spectral nudging of winds (leaving the thermodynamic quantities free to respond to forcing) is an established method in regional climate modeling (von Storch et al., 2000; Waldron et al., 1996). One also could imagine conditioning on the state of the tropical atmosphere (thereby overcoming potential model errors in the local response to tropical SSTs) or anomalous Arctic sea-ice extent or other such factors. In short, a logical extension of conditioning on the prevailing pattern of SST anomalies is to condition on various aspects of the large-scale circulation or the atmosphere’s lower-boundary conditions (sea-ice, snow cover, soil moisture, etc.) that are known to be important in altering the likelihood of extreme events.
One can go even further and condition on the specific weather situation (see Chapter 3), asking how large-scale, long-term changes in thermodynamic quantities of the atmosphere such as temperature or humidity—which are more directly attributable to greenhouse gas increases than is any specific weather event (e.g., Bindoff et al., 2013)—may have changed the severity of an event (Trenberth et al., 2015). For instance, given the landfall of a hurricane at a certain point, how might its intensity have changed because of SST or atmospheric humidity anomalies along its path, and to what extent might those anomalies (defined relative to long-term historical averages) be attributable to human influence? How was the coastal flooding the storm induced increased by long-term sea level rise? How were rainfall amount and intensity and subsequent inland flooding affected by the warmer, moister atmosphere? These could be useful questions for local authorities who use past extremes as benchmarks to ask when planning future resilience. Although the attribution question is now framed in a deterministic manner—uncertainties in the calculations need to be estimated, but that is a different issue (see “Uncertainty Quantification” in Chapter 3)—this approach can be given a probabilistic interpretation if one adopts a “nowcasting” perspective:
___________________
3 Nudging is a well-known scientific technique in which observations are used to guide a dynamic model, such as a climate or weather model. Nudging (Lorenc et al., 1991) is an example of a type of data assimilation, which refers to a broad class of methods that are used to introduce observations into dynamic models. Improvement in data assimilation techniques has been a key factor in the steady improvement of the weather forecast skill that has been achieved over the past three decades.
Given the state of the atmosphere as estimated from the meteorological observing system, what is the probability distribution of specific weather features such as intense rainfall in a particular catchment? But, the probability distribution is certainly narrower than would result when conditioning on a large-scale circulation state or SST anomaly (see Shepherd, 2016).
Probabilistic Formulation
The trade-off involved in conditioning is that it improves the signal-to-noise ratio of the anthropogenic influence while providing a more realistic simulation of the event, but a full estimate of the change in likelihood of the event would require an explicit estimate of the change in the probability or intensity of the anomalous climatic or weather state on which the inference is conditioned (see below). Such a change could either increase or decrease the conditional anthropogenic effect. (Strictly speaking, it also may require an estimate of the change in probability when the conditional state is absent, but this would not be relevant if the conditional state was necessary for the event to occur [Shepherd, 2016].) Note that this issue applies as much to conditioning on an SST pattern as it does to conditioning on a specific weather situation. Whether it is necessary to make the additional effort to estimate the change in probability of the climatic or weather state would be a matter for the user of the information to determine (Otto et al., 2015c). Trenberth and colleagues (2015) argue that for extreme weather events that cannot be adequately simulated in global models it is the only credible approach. Even for large-scale circulation patterns, if anthropogenic changes in their likelihood did matter, then one would need to assess one’s confidence in the simulated changes. This would seem to be extremely challenging, given the low confidence in these aspects of climate change compared with thermodynamic aspects (Bindoff et al., 2013; Shepherd, 2014).
When considering the probability of an event, use of the RR rather than the FAR would allow one to represent conditional analyses in their broader context. For a simple example, consider a conditional analysis of an event under El Niño conditions (e.g., Zhang et al., 2010). The conditional RR (see equation 2.1) for the probability of the event, conditioning on the El Niño conditions, denoted N, is
 |
(2.1) |
where Pf is the probability under the factual world (i.e., the currently observable world as it exists in the context of climate change) and Pc is the probability under the counter-
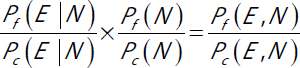
factual world without anthropogenic influence. If we now want to add information about how forcings affect El Niño conditions (see equation 2.2), we can consider
 |
(2.2) |
to get an unconditional RR concerning the joint occurrence of the event and El Niño in the factual and counterfactual worlds. This multiplication of risk ratios is not possible if one uses the FAR. Note that the product above is now the RR for an altered event definition that includes the condition of the system and the meteorological outcome (such as heavy precipitation), as opposed to either an unconditional RR that considers the meteorological outcome under all possible states or a conditional RR that considers the meteorological outcome under a specified climatic state. This is analogous to what was done in Figure 2.1, where the anti-cyclonic circulation associated with a high-pressure system was part of the definition of the heat wave, and is often a sensible choice if the extreme can occur only under unusual dynamic conditions. If there is little information about the RR for the dynamics, it may be sensible to concentrate on the conditional RR, treating the ratio for the dynamics as one. This is the approach taken by Diffenbaugh and colleagues (2015) in their analysis of the recent California drought, where precipitation is controlled by storm-track dynamics, which are highly variable and uncertain, but the persistent warming is leading to an increasing risk of drought conditions. Cattiaux and colleagues (2010) also use such a factorization of the RR via conditioning to argue that cold extremes are becoming less likely despite the occurrence of the cold European winter of 2010, although their results also suggest that the probability of the circulation situation itself has not changed.
As discussed above, one also can consider multiple causes of an event, such as anthropogenic influence and El Niño, such that we have an RR for each (see equation 2.3),
 |
(2.3) |
respectively, where Nc indicates non-El Niño conditions. These RR values cannot be used together in a quantitative fashion, however, because different variables are being conditioned on.
USE OF BACKGROUND KNOWLEDGE ABOUT CLIMATE CHANGE
In conditional attribution, background knowledge about climate change is explicitly included through the choice of the counterfactual conditions, for instance, the coun-
terfactual SSTs. Background knowledge also is often included in unconditional attribution, however, by couching the event attribution within the broader context of climate change science. A firmer basis for an event attribution result identifies a human influence if one can demonstrate that there has been human influence on a related aspect of the climate—that is, if detection and attribution results demonstrate that human influence has altered the mean state in some way in the region where the event occurred. That is almost certain to be the case for temperature-related events, but the detection and attribution literature on precipitation generally deals with precipitation change on very large scales, as the signal of precipitation change is emerging more slowly due to high climate variability (e.g., Zhang et al., 2010; see Bindoff et al., 2013; Collins et al., 2013; Kirtman et al., 2013).
In general, there is a higher degree of confidence concerning the understanding of purely thermodynamic aspects of climate change associated with warming and increased moisture-holding capacity of the atmosphere compared with dynamic aspects of climate change (Shepherd, 2014). The latter include both large-scale circulation patterns, which can modulate temperature and precipitation extremes, and storms. Thus, in any event attribution study, it is important to distinguish between the purely thermodynamic and the dynamic drivers. If the response of the dynamic drivers to climate change is a significant component of the anthropogenic influence, then the plausibility of that response needs to be established. Confident attribution is not possible in the absence of adequate understanding (see further discussion in Chapter 4 and Figure 4.7).
OTHER FACTORS AFFECTING IMPACTS OF EXTREME EVENTS
Attribution of extreme events is primarily anchored in discussions about anthropogenic climate change, yet many extreme events also are affected by other types of anthropogenic processes, which raise additional framing issues in terms of event impacts. Human-related activity not directly linked to anthropogenic climate change can worsen an extreme event. The urban heat island effect is an example of such an effect of human activity on temperature extremes. Heat wave characteristics such as duration and magnitude may be increasing in large U.S. cities because of the combination of global warming and urban heat (Habeeb et al., 2015; Zhou and Shepherd, 2010).
Beyond heat waves, increases in temperature also can lead to other kinds of extreme events, including drought and wildfire. The occurrence of these events is closely related to the drying effect associated with higher temperatures when evapotranspiration is moisture-limited, and this depends strongly on the nature of the land cover (Seneviratne et al., 2016).
An important effect of intense precipitation is related to flooding of the land surface, which is affected by a wide range of factors other than changes in the climate. For example, the intensity of flooding is affected by a range of human land use decisions, including urbanization and river channelization efforts (Melillo et al., 2014). In particular, precipitation is falling onto more impervious surfaces. Du and colleagues (2015) confirm that an increase in impervious surfaces associated with rapid urbanization has led to greater peak discharge and flood volume in parts of China over the past 30 years. Shepherd and colleagues (2011) also note increased flow rates of floodwater in cities due to impervious surfaces. In some cases, upstream flood control efforts actually increase damages downstream in the same watershed. Furthermore, the “extreme” nature of flooding is often defined in human terms because the impact of flood events is often calculated in dollars. These costs are directly affected by the value of infrastructure that has been constructed in the floodplain (Downton and Pielke, 2005; Downton et al., 2005).
Increasing temperatures and changes in precipitation are related in multiple ways to evaporation from the land surface and the water demand of plants (transpiration). In fact, feedbacks from the land surface and land management practices have been shown to affect local and regional drought events. A classic example is the so-called Dust Bowl period that coincided with heat waves in 1934 and 1936, where land management was a factor exacerbating the drought through dust (e.g., Seager, 2011). More recently, drought conditions in Brazil may be amplified by Amazon deforestation due to decreases in dry season latent heat flux (Bagley et al., 2014; Nazareno and Laurance, 2015).
Wildfires may also be affected by land management decisions. For example, there is substantial evidence that past fire control practices have increased the likelihood of large-scale wildfires because of the buildup of fuels that occurs when natural, lower-intensity fires are suppressed (Allen et al., 2002). Likewise, the decision to build homes at the wildland-urban interface (e.g., in Southern California; see Figure 2.2) greatly increases the costs associated with fires and firefighting.
Perhaps the best example of the intersection of land use decisions and extreme events is in coastal areas: Not only have people made major changes to the morphology of coasts that in some cases exacerbate the impacts of coastal storms, many of the major cities around the globe are located in or near coastal areas as well. Storm surges that historically might have been blunted by barrier dunes or wetlands now directly impact urban infrastructure. Furthermore, dredging and other coastal modifications may be linked to increases in minor flooding after the 1980s in parts of the mid-Atlantic United States (Ezer and Atkinson, 2014). The costs of these coastal flood-

ing events are high, in part because of the high value of coastal investments, much of it knowingly constructed in areas of high vulnerability. The “extreme” nature of coastal flooding is therefore a product of a combination of different anthropogenic impacts, some of which have little to do with climate-mediated effects like sea level rise.
Human-related activity not directly linked to anthropogenic climate change (such as urban impervious surfaces, land cover changes, and dredging) can worsen an extreme event. Therefore, attribution studies should clearly distinguish such climate factors from the effects of climate change, and the results should be framed accordingly. Apart from more accurately isolating the anthropogenic climate change effect, this also has the benefit of identifying risk factors that could potentially be mitigated at the local level.
Selection Bias and Systematic Event Attribution
Most of the currently available literature on event attribution focuses on events selected by researchers. In recent years, collections of such studies have been published in Bulletin of the American Meteorological Society (BAMS) yearly supplements (e.g., Herring et al., 2014, 2015b; Peterson et al., 2012, 2013b). There is a desire to summarize anthropogenic influence across all of the events and to ask whether it is causing a change in extreme events generally. This has led to the presentation of a summary of the BAMS results in tabular form, from which one might calculate the proportion of events for which anthropogenic influence is found. As the editors acknowledge, however, the studies presented in the supplements are not a representative sample of any well-defined population; hence, summarizing across the studies does not provide direct information about changes in extreme events collectively.
Scientifically, a “bias” refers to an unintentional but systematic error in a quantitative estimate arising from the particular way in which the estimate was made, and it is to be distinguished from random errors due to insufficient data or an intentional selection of cases to achieve a predetermined result. In statistics, “selection bias” refers specifically to potential systematic errors in probabilistic inference arising when the data that are collected or analyzed are not representative of the larger population about which one wants information. In the context of event attribution, selection bias can arise when the studies are based on events that actually occurred and that are chosen for study by the researcher. Selection bias does not affect the validity of any particular result, but it is relevant for meta-analyses of collections of results.
Potential biases in attribution results are of concern for collective assessment of anthropogenic influence on extreme events, but they may not be relevant if the focus is on a climatological understanding of events or on the implications of attribution analyses for adaptation and planning in specific contexts. Some of the issues discussed below also arise in meta-analysis in the medical literature, in which the goal is to improve statistical power by analyzing results from multiple studies that assess the same scientific question.
What follows is a list of several potential forms of selection bias, with shorthand labels for each provided in parentheses:
- bias from studying only events that occur (occurrence bias),
- bias from choosing to study events for which the researcher suspects either anthropogenic influence in general or an increase in likelihood from anthropogenic influence specifically (choice bias),
- bias from publishing studies about events for which the study finds either anthropogenic influence in general or an increase in likelihood from anthropogenic influence specifically (publication bias), and
- bias in choosing regions or event definitions of interest to the analyst (type bias).
Occurrence bias is more subtle and likely more easily overlooked than the other types of selection bias listed above. The simplest example of occurrence bias is an event class for which p1 is zero or vanishingly small, while p0 is rather larger. Such events will never occur in the current world and never be analyzed. As a result, few publications in the literature exist that find event classes that are much less likely in the factual world.
Similarly, the influence of occurrence bias can occur in less drastic settings. Occurrence bias could result in a scientific literature that suggests that extreme events are generally becoming more common because of anthropogenic influence. Suppose there are 100 event classes (across regions and types of events) that can occur, and we consider the probability of occurrence over the course of 1 year. Further suppose that for 50% of those event classes p1 = 0.04 and p2 = 0.02 and that for 50% of the classes the reverse is true: p1 = 0.02 and p2 = 0.04. An example of a generally decreasing likelihood of an event class under climate change is cold events. Collectively, the probabilities across all event classes are equal under both scenarios. Now consider the events that occur in a given year. On average, there will be six events, four representing classes that are more frequent under the factual world and two representing classes that are more frequent under the counterfactual world. If a study of each event is done, and assuming the study can determine the RR or FAR without statistical uncertainty, four of the six studies will show that the event is more likely under the factual world and two of the six less likely under the factual world. A general conclusion across the six studies would be that extreme events are more likely because of anthropogenic influence. A more realistic scenario is that because of statistical uncertainty, no firm conclusions can be drawn in some of the studies. For those studies in which anthropogenic influence is found, however, a similar imbalance would persist, with more studies showing an increase in extreme events in the factual world than a decrease.
The remaining three types of bias are more straightforward to understand. Choice bias could arise because scientists are actively interested in finding events that are related to climate change or simply to subtle factors in the choice of what events to study. Publication bias is a well-known problem that distorts results obtained from doing collective analysis across published studies. Finally, a clear example of type bias is simply the geographic bias where attribution studies are done, focusing more attention on understanding extreme events in areas such as North America and Europe, although
this is beginning to change. Due to these biases, a meta-analysis of event attribution results based on tabulating results from an ad hoc collection of studies could be severely misleading.
The potential for selection bias does not contradict that there can be good reasons to examine particular events if one is interested in those events themselves, such as for reasons of public curiosity or of liability or as historical benchmarks for resilience.
GUIDANCE FOR FRAMING EVENT ATTRIBUTION QUESTIONS
The notion that an event may not have been affected by climate change can be difficult to justify in a climate system in which everything is connected. In any extreme event, multiple contributing factors are involved (both human-induced and natural). Therefore, results of event attribution studies should not be framed as the cause being either anthropogenic or natural, as frequently it will be a combination of both.
Statements about attribution are sensitive to the way the questions are posed and the context within which they are posed. Results of event attribution studies with respect to the extent of anthropogenic influence can differ depending on how the results are framed. Therefore, in any attribution analysis, one should be explicit about the framing choices and explain why those particular choices were made. Framing choices include:
- how single events are interpreted;
- the type of conditioning involved, if any;
- whether changes in frequency or in magnitude of an event are assessed;
- how the event is defined;
- how the factual and counterfactual probabilities are compared (e.g., FAR versus RR); and
- whether the results are cast as a null hypothesis significance test.
The RR has many advantages over the FAR and is less prone to misinterpretation. The RR directly frames the result in terms of the relative probabilities under a world with anthropogenic climate change and a world without. The FAR, by contrast, does not represent a share of causation because for any given event, multiple factors can have FARs that are close to one. Further framing issues arise for impacts of extreme events because other anthropogenic factors (e.g., land use) apart from climate change often significantly affect the magnitude of impacts.
It also is useful to present results in more than one way (e.g., magnitude and frequency), so that users understand there are different ways of looking at the event. Relevant quantities (probabilities or magnitudes) should be estimated, with accompa-
nying uncertainty intervals, to help users understand the strength of the evidence. This approach is more useful and less prone to misinterpretation than is null hypothesis significance testing. Furthermore, results should be presented in terms of the overall understanding of the climate system, as this is important prior information that affects the interpretation of the result.
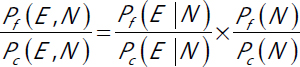
An essential part of the framing involves whether or not the attribution is conditioned (e.g., on the current climatic or specific weather state) because that affects the quantitative estimates of the extent of anthropogenic influence and more closely relates the study to the factors driving the particular event. An unconditional attribution analysis of a joint probability can be considered a product of conditional attribution analyses (see equation 2.4), i.e.,
 |
(2.4) |
where E is the event, N is a conditioning factor (such as SST anomaly pattern), Pf is the probability under the factual world (i.e., the currently observable world as it exists in the context of climate change), and Pc is the probability under the counterfactual world that might have been without anthropogenic influence. If the response of N to climate change is highly uncertain, then the last factor might be assumed to be one in which case the unconditional and conditional probabilities are equal.
Various sources of selection bias are almost inevitable in event attribution applied to individual events. Such selection biases interfere with the ability to draw general conclusions about anthropogenic influence on extreme events collectively.
Overall, it is useful to perform event attribution with all factors explicitly assessed and discussed: thermodynamic and dynamic aspects of anthropogenic climate change, non-climate anthropogenic factors, and natural variability. This helps the user understand the uncertainties in the calculation, the resilience to current climate variability, and other anthropogenic factors that might be relevant.


