
2
Fertility Levels, Differentials, and Trends
Barney Cohen
INTRODUCTION
Fertility rates are higher in sub-Saharan Africa (Africa) than in any other major region of the world, and considerable controversy surrounds the likelihood of these rates declining in the near future. Although mortality and fertility rates fell substantially in Latin America and Asia between 1965 and 1985, only mortality declined in Africa; fertility remained relatively stable, well above a level required to replace the population. Consequently, the region experienced extremely rapid population growth, with rates for some populations considerably above 3 percent per year (United Nations, 1991; Freedman and Blanc, 1992). A few countries, most notably Kenya, Botswana, and Zimbabwe, have begun the transition toward lower fertility, but smaller declines in fertility have been observed recently in many other countries. Nevertheless, fertility rates generally remain above six children per woman, and the question of whether Africa is more resistant to fertility change than other regions of the world is a topic of considerable debate
(Boserup, 1985; World Bank, 1986; Caldwell and Caldwell, 1987, 1988, 1990; Lesthaeghe, 1989; van de Walle and Foster, 1990; Caldwell et al., 1992).
The level of fertility in sub-Saharan Africa, as measured by the total fertility rate (TFR),1 is approximately 6.0–6.5 births per woman. This figure masks considerable variation between regions and between individual countries. For example, the most recent estimate of the total fertility rate in Rwanda (8.5 births per woman in 1983) is almost double the most recent estimate for the population of black South Africa (4.6 births per woman in 1987–1989). More generally, fertility rates in East and West Africa are greater than those in Central Africa, in part because of the historically high prevalence of sexually transmitted diseases (STDs) in certain areas of Central Africa (Frank, 1983; Tambashe, 1992). The prevalence of STDs is associated with unusually high rates of infecundability in the region especially prior to the 1970s. Fertility was probably higher in East Africa than in West Africa during the 1970s and 1980s, although the difference appears to have lessened in the more recent past. Reported fertility rates rose in certain parts of Africa in the late 1960s and 1970s; however, it is not clear what proportion of the increase was the result of improvements in data accuracy.
In addition to the regional and national variation in fertility rates, there is often considerable variation in fertility within countries. Repeatedly, fertility surveys have recorded substantial differences in rates among ethnic, geographic, and socioeconomic groups. For example, fertility rates are consistently lower among women who live in urban areas, women who have more than primary school education, and women who work in the formal labor market. In Africa, the number of women in each of these socioeconomic groups has, at least until recently, been small, and the groups overlap considerably. Consequently, lower fertility among these women has a minimal effect on national-level TFRs.
The objective of this chapter is to summarize existing knowledge on levels, trends, and differentials in achieved fertility in sub-Saharan Africa. Although there have been several comprehensive reviews of fertility levels in Africa in the past (see, for example, Brass et al., 1968; Page and Coale, 1972; United Nations, 1987), new sources of data make it possible to update
the analysis to the early 1990s. By employing a wide variety of data sources, including some that have not been readily accessible in the past, estimates of fertility rates are presented for virtually all countries in sub-Saharan Africa.
True understanding of fertility trends in Africa is clouded by the extremely variable quality of demographic data in the region. Close examination of much of the data reveals gross inconsistencies that are the result of misreporting of ages and omitting or systematically displacing vital events. In an attempt to correct for obvious data errors, a mixture of direct and indirect estimation techniques is used to determine fertility rates. The indirect techniques are based on the examination of inconsistences within the reported data or on comparisons of observed data to values expected from various demographic models.
The chapter is organized as follows: Issues of data availability and quality are discussed in the following section. In the third section, four methods for estimating TFRs are presented. Characteristics of African fertility are presented in the fourth section. Next, recent data from the Demographic and Health Surveys are used to examine the possible evidence for declining fertility levels in Africa. The penultimate section compares recent fertility trends in Africa to those in other developing areas of the world. Finally, there is a summary and some concluding observations.
SOURCES AND QUALITY OF DEMOGRAPHIC DATA IN AFRICA
The state of demographic data collection in Africa has recently been reviewed by de Graft-Johnson (1988). Despite dramatic improvements since the 1960s, our knowledge and understanding of fertility levels and trends in Africa are still surprisingly weak. Until 1960, virtually no sub-Saharan African country had conducted a complete census. Consequently, little was known about the size or structure of the region’s population. In the few countries where censuses were undertaken, they were often unreliable and of very limited content. A fundamental problem facing researchers in Africa was that a large percentage of the adult population was unable to report its age accurately. Further, many early censuses did not include questions related to the number of children ever born and childhood mortality. In addition, vital registration data were virtually nonexistent throughout the region and, when available, were of questionable quality.
Fortunately, demographic data collection in Africa has improved considerably over the last 30 years. Although vital registration is still rare, most countries have conducted one and in many cases several censuses, though quality has been uneven. In addition, many countries have supplemented efforts to collect reliable demographic data with various ad hoc
national and subnational household demographic surveys. Some of the most accurate information comes from these large-scale demographic surveys. In particular, the World Fertility Surveys (WFS), an international data collection effort undertaken from the mid-1970s to the early 1980s, and the ongoing Demographic and Health Surveys (DHS) begun in the mid-1980s, have generated a reasonably accurate data base for calculating fertility levels and differentials for countries in sub-Saharan Africa. The WFS carried out surveys in nine sub-Saharan African countries: To date, the DHS has published demographic reports for 13 sub-Saharan African countries and issued preliminary results for 4 others. Reports for 4 additional African countries are scheduled for release by the end of 1993. Special attention is given in this chapter to the DHS because it is the source of most of the recent demographic data on Africa.
The quality of DHS data was recently analyzed by DHS staff and found to be generally acceptable. But, in cases where data problems were identified, they were determined to be most severe in sub-Saharan Africa in comparison to other regions of the developing world (Institute for Resource Development, 1990:2). For example, Arnold (1990) identified errors in the coverage and timing of births, including (1) systematic displacement of children’s birth dates, (2) disproportionate numbers of women’s ages heaped on digits ending in 0 and 5, and (3) missing or incomplete information in some birth histories. These problems were determined to be most severe in Botswana, Burundi, Liberia, Mali, and Togo. Problems in the first category arose, in part, because some interviewers appear to have deliberately altered the ages of children under 5 to avoid asking an extensive series of questions on the health and well-being of young children. A second assessment of the quality of DHS data focused on women’s age at first birth and judged that response problems were most severe in African countries, especially Mali and Liberia (Blanc and Rutenberg, 1990). The African data suggest that some women omit information about early births or displace the dates of low-parity births forward in time, making children appear younger than they really are. Finally, Rutstein and Bicego (1990) report that less than 80 percent of women interviewed in Africa provide accurate birth dates for their children.
Fortunately, the effect of displacement problems on fertility levels is relatively minor. For example, Arnold and Blanc (1990) calculate that without any displacement, the total fertility rate in Liberia, the country with the most displacement, would have been 6.5 instead of 6.3 births per woman between 1983 and 1988. Nevertheless, it is important to acknowledge that there is always the danger of drawing incorrect conclusions from data collected in areas where vital events go unrecorded. Consequently, a single point estimate of fertility from Africa should be interpreted with some caution.
In this chapter, DHS and WFS data are supplemented by data collected in censuses and other national demographic surveys. Where no other information was available these data are augmented with findings from large-scale subnational studies. Data from small-scale studies conducted at the district or provincial level have not been used due to concerns regarding their generalizability.
Naturally, censuses and surveys are carried out in different countries at different times. But, unlike the estimates presented by several organizations (including the United Nations and the U.S. Bureau of the Census), the estimates presented here are not standardized on a specific year. Rather, the current goal is to present the reader with the original data from which standardized estimates are derived.
METHODS FOR ESTIMATING TOTAL FERTILITY RATES
Four distinct strategies are used here to obtain independent estimates of fertility. The first strategy is to calculate fertility directly, without adjusting for any apparent inconsistencies in the data. This method requires information on the number of women of childbearing age, their ages, and the number of births to these women during a given time period, typically five years. Direct estimates of fertility are reported only when the quality of the data was thought to be adequate, for example, as in all the WFS and the DHS. In these cases, fertility estimates are derived by using retrospective birth histories.
Experience has shown, however, that response errors in census and survey data can often lead to biased or inaccurate estimates of the fertility rate. Response errors in birth history data arise mainly from age misreporting and the omission or systematic displacement of vital events. For example, many women incorrectly report their own age or the ages of their children. Similarly, in the absence of written records, women often forget births that occurred in the distant past and make systematic errors when estimating the timing and spacing of events (Potter, 1977). Older women, women with little education, women who were not in sanctioned unions at the time of their first birth, and women whose children have moved away or died are particularly likely to make these types of errors. Obvious errors, such as birth intervals of less than 6 months or first births to women under 10 years of age, can often be detected by the interviewer or the researcher and perhaps corrected by cross-referencing birth dates with well-known historical events. Errors resulting from omitted births are much harder to correct.
Demographers have developed alternative methods designed to improve their ability to make “indirect” inferences about fertility from poor or incomplete data (Brass et al., 1968; United Nations, 1983). Most of these methods involve the identification of internal inconsistencies in the reported
data or the comparison of observed data to model fertility schedules. In cases where the direct and indirect estimates of fertility are substantially different, the indirect estimates are usually preferred. Three of the four strategies used in this chapter employ indirect techniques.
One strategy is based on the principle of comparing reported births in a given time period with women’s responses to questions regarding the number of children ever born. A full description of this method (commonly called the method of P/F ratios) can be found in United Nations (1983). The data requirements for this method are identical to those for direct estimation except that they include information about the number of children ever born. Where the data allowed, this technique was used to check and, if necessary, to adjust the survey or census estimates for apparent misreporting. Unfortunately, because this method relies on equating current and past experiences, it has the potential for producing biased estimates of the total fertility rate when fertility has recently declined (United Nations, 1983:32). Nonetheless, at least for the earlier time periods, this method arguably produces the most accurate estimates possible.
Because early censuses often did not include specific questions on fertility, the age structure of the population may be the only information available to estimate the total fertility rate. In these cases, fertility estimates are inferred by using stable population theory, which is based on assumptions of constant fertility and mortality. The only data requirements for these estimates are the age structure of the population, the growth rate, and an estimate of the level and pattern of mortality. Because results from this estimation method are not particularly robust and are quite sensitive to different mortality assumptions, it is used only in the absence of other alternatives. In an attempt to check the robustness of these approximations, similar estimates are also derived by using a method developed by Coale (1981) and later extended by Venkatacharya (1990). This method, labeled the Coale method, also relies on stable population theory and requires an estimate of the population growth rate, the proportion of both sexes under the age of 15, and an estimate of mortality for children up to age 5. Assuming constant fertility rates for the population under consideration, Coale (1981) suggested that his method would yield reasonable estimates of the total fertility rate for 7.5 years prior to the census date, even if the census or survey was characterized by severe age misreporting.2
CHARACTERISTICS OF AFRICAN FERTILITY
Estimates of Total Fertility Rates
Table 2–1 provides estimates of the TFR for 38 African countries for which data were available at some point during 1960–1992. For ease of comparison, all estimates were converted into point estimates of the total fertility rate. In reality, a particular figure may be the midpoint of a range of plausible estimates. Table 2–1 highlights the paucity of demographic data in many African countries. Despite considerable improvements in the availability of data during the past 10 years, 12 countries still have fewer than four data points since 1960. In other cases, although data exist, they are of extremely variable quality. Consequently, fertility trends over time may appear more erratic than they truly are. For example, in Ethiopia, the data imply a substantial increase in fertility during the 1970s followed by a rapid decline in the 1980s. Both trends are almost certainly exaggerated.
Although the data are often sketchy, several important conclusions may still be drawn about fertility in Africa. Few countries in Africa have TFRs less than 6.0, and nowhere is fertility currently less than 4.0 births per women, a rate well above that required for replacement. Africans have a strong preference for large families. Children are prized not only as the means of preserving family lines, but as positive economic assets that provide labor, wealth, risk insurance, and old-age security to their parents.
In the past, high fertility in Africa resulted from early and near universal marriage,3 and extremely low rates of efficient contraception. Fertility has been controlled (outside geographic areas of pathological sterility) by social pressures against premarital sex, the practice of postpartum sexual abstinence, and long breastfeeding periods that lead to lengthy lactational amenorrhea (see Chapter 3; also Caldwell and Caldwell, 1977, 1987; Page and Lesthaeghe, 1981). Bongaarts et al. (1990) recently estimated that fertility in Africa would increase by 72 percent if the fertility-inhibiting effects of breastfeeding and postpartum abstinence were removed. These fertility-reducing practices have probably evolved principally to ensure exceptionally long birth intervals in an effort to combat high rates of infant mortality. Recently there are signs that some of these cornerstones of African fertility may be weakening (see Chapter 3; also Schoenmaeckers et al., 1981; Caldwell et al., 1992; Westoff, 1992).
TABLE 2–1 Fertility Estimates for Various Sub-Saharan African Countries, 1960–1992
|
Country |
Date of Estimate |
Data and Methodologyc |
Reference |
|
|
Western Benin |
1961 |
6.9 |
Demographic Survey, Dahomey |
Benin (1988) |
|
|
1965 |
7.1 |
World Fertility Survey, 1981–1982 |
Cochrane and Farid (1989) |
|
1970 |
7.0 |
World Fertility Survey, 1981–1982 |
Cochrane and Farid (1989) |
|
|
1975 |
7.0 |
World Fertility Survey, 1981–1982 |
Cochrane and Farid (1989) |
|
|
1979 |
7.3 |
Census; stable population theory |
United Nations (1984)d |
|
|
1980 |
7.1 |
World Fertility Survey, 1981–1982 |
Cochrane and Farid (1989) |
|
|
Burkina Faso |
1960–1961 |
6.2 |
National demographic survey |
Burkina Faso (n.d.)e |
|
|
1960 |
6.6 |
Census; stable population theory |
United Nations (1979)d |
|
1969 |
6.4 |
1975 census (Coale method) |
United Nations (1984)d |
|
|
1973–1974 |
7.2 |
Subnational survey |
U.S. Department of Commerce (1979) |
|
|
1976 |
6.7 |
Postenumeration survey |
Burkina Faso (n.d.)c |
|
|
1985 |
7.2 |
Census |
Burkina Faso (n.d.)e |
|
|
Côte d’Ivoire |
1963 |
7.5 |
World Fertility Survey, 1980–1981 |
Cochrane and Farid (1989) |
|
|
1962–1964 |
6.4 |
National demographic survey |
U.S. Department of Commerce (1979) |
|
1968 |
7.5 |
World Fertility Survey, 1980 |
Cochrane and Farid (1989) |
|
|
1973 |
7.9 |
World Fertility Survey, 1980–1981 |
Cochrane and Farid (1989) |
|
|
1975 |
6.9 |
Census; stable population theory |
United Nations (1990)d |
|
|
1978 |
7.7 |
World Fertility Survey, 1980–1981 |
Cochrane and Farid (1989) |
|
|
1978–1979 |
6.9 |
National survey; P/F ratios |
Ahonzo et al. (1984) |
|
|
1981 |
7.4 |
1988 census; Coale method |
Lopez-Ecartin (1992e)d |
|
|
1988 |
6.8 |
Census; method of estimation not stated |
Lopez-Escartin (1992e)f |
|
|
The Gambia |
1973 |
6.4 |
Census; P/F ratios |
The Gambia (1976) |
|
|
1983 |
6.9 |
Census; stable population theory |
United Nations (1990) |
|
1983 |
6.4 |
Census; P/F ratios |
The Gambia (1987) |
|
|
Ghana |
1960 |
7.2 |
Postenumeration survey |
U.S. Department of Commerce (1979) |
|
|
1960–1964 |
7.2 |
World Fertility Survey, 1979–1980 |
Singh et al. (1985) |
|
Country |
Date of Estimate |
Data and Methodologyc |
Reference |
|
|
Ghana |
1965–1969 |
7.0 |
World Fertility Survey, 1979–1980 |
Singh et al. (1985) |
|
|
1968–1969 |
7.1 |
National demographic survey, second round |
U.S. Department of Commerce (1979)f |
|
1970 |
7.3 |
Census; stable population theory |
United Nations (1979) |
|
|
1970–1974 |
6.9 |
World Fertility Survey, 1979–1980 |
Singh et al. (1985) |
|
|
1978 |
6.2 |
1984 census; Coale method |
Ghana (n.d.)e |
|
|
1975–1979 |
6.5 |
World Fertility Survey, 1979–1980 |
Singh et al. (1985) |
|
|
1982–1984 |
6.6 |
Demographic and Health Survey, 1988 |
Ghana (1989) |
|
|
1985–1988 |
6.4 |
Demographic and Health Survey, 1988 |
Ghana (1989) |
|
|
Liberia |
1967 |
6.8 |
1974 census; Coale method |
United Nations (1984)d |
|
|
1970–1971 |
6.3 |
Liberian population growth survey |
U.S. Department of Commerce (1979) |
|
1974 |
6.2g |
Census |
Chieh-Johnson et al. (1988) |
|
|
1977 |
6.6 |
1984 census; Coale method |
||
|
1980–1982 |
7.0 |
Demographic and Health Survey, 1986 |
Chieh-Johnson et al. (1988) |
|
|
1983–1986 |
6.8 |
Demographic and Health Survey, 1986 |
Chieh-Johnson et al. (1988) |
|
|
Mali |
1960–1961 |
7.4 |
Demographic survey |
Traoré et al. (1989) |
|
|
1976 |
6.3 |
Census; stable population theory |
United Nations (1984)d |
|
1981–1983 |
7.1g |
Demographic and Health Survey, 1987 |
Traoré et al. (1989) |
|
|
1984–1986 |
6.9 |
Demographic and Health Survey, 1987 |
Traoré et al. (1989) |
|
|
1987 |
6.8 |
Census; method of estimation not stated |
Lopez-Escartin (1992a)f |
|
|
Mauritania |
1964–1965 |
5.7 |
Demographic survey |
U.S. Department of Commerce (1979) |
|
|
1962–1966 |
6.5 |
World Fertility Survey, 1981 |
Cochrane and Farid (1989) |
|
1967–1971 |
6.9 |
World Fertility Survey, 1981 |
Cochrane and Farid (1989) |
|
|
1972–1976 |
7.2 |
World Fertility Survey, 1981 |
Cochrane and Farid (1989) |
|
|
1977 |
7.0 |
Census; stable population theory |
United Nations (1990)d |
|
|
1977–1981 |
6.3 |
World Fertility Survey, 1981 |
Cochrane and Farid (1989) |
|
|
1988 |
6.3 |
Census; stable population theory |
Lopez-Escartin (1992b)d |
|
|
Niger |
1960 |
6.9 |
Demographic survey; P/F ratios |
U.S. Department of Commerce (1979)f |
|
|
1977 |
7.0 |
Census; stable population theory |
United Nations (1984)d |
|
1988 |
7.1 |
Census; P/F ratios |
Niger (1992a)e |
|
|
1992 |
7.4 |
Demographic and Health Survey, 1992 (preliminary) |
Niger (1992b) |
|
|
Nigeria |
1965 |
6.6 |
World Fertility Survey, 1981–1982 |
Cochrane and Farid (1989) |
|
|
1970 |
6.5 |
World Fertility Survey, 1981–1982 |
Cochrane and Farid (1989) |
|
1971–1973 |
7.3 |
National fertility survey; P/F ratios |
U.S. Department of Commerce (1979)f |
|
|
1975 |
7.0 |
World Fertility Survey, 1981–1982 |
Cochrane and Farid (1989) |
|
|
1980 |
6.3 |
World Fertility Survey, 1981–1982 |
Cochrane and Farid (1989) |
|
|
1990 |
6.2 |
Demographic and Health Survey II, 1990 |
Nigeria (1992) |
|
|
Senegal |
1960 |
5.4 |
Demographic Survey |
U.S. Department of Commerce (1979) |
|
|
1959–1963 |
7.8 |
World Fertility Survey, 1978 |
Cochrane and Farid (1989) |
|
1964–1968 |
7.7 |
World Fertility Survey, 1978 |
Cochrane and Farid (1989) |
|
|
1969–1973 |
7.5 |
World Fertility Survey, 1978 |
Cochrane and Farid (1989) |
|
|
1970–1971 |
6.4 |
National demographic survey |
U.S. Department of Commerce (1979) |
|
|
1976 |
7.0 |
Census; stable population theory |
United Nations (1984) |
|
|
1974–1978 |
7.2 |
World Fertility Survey, 1978 |
Cochrane and Farid (1989) |
|
|
1981 |
7.3 |
Provisional 1988 census; Coale method |
Senegal (1988) |
|
|
1986 |
6.6 |
Demographic and Health Survey, 1986 |
Ndiaye et al. (1988) |
|
|
1988 |
6.3 |
Census (preliminary estimate based on a 10 percent sample) |
Senegal (1992) |
|
|
Sierra Leone |
1967 |
7.2 |
1974 census; Coale method |
United Nations (1979) |
|
|
1973 |
6.4 |
Pilot census; P/F ratios |
U.S. Department of Commerce (1979)f |
|
Togo |
1961 |
7.0 |
Demographic survey |
U.S. Department of Commerce (1979) |
|
|
1971 |
6.6 |
Census; method of estimation not stated |
Lopez-Escartin (1991d) |
|
1981 |
6.0 |
Census |
Agounké et al. (1989) |
|
|
1982–1984 |
6.9g |
Demographic and Health Survey, 1988 |
Agounké et al. (1989) |
|
|
1985–1987 |
6.5g |
Demographic and Health Survey, 1988 |
Agounké et al. (1989) |
|
|
Middle Angola |
1960 |
6.4 |
Census; stable population theory |
United Nations (1979)d |
|
|
1970 |
6.7 |
Census; stable population theory |
Lopez-Escartin (1992d)d |
|
1983–1985 |
8.0 |
Census; P/F ratios |
|
Country |
Date of Estimate |
Data and Methodologyc |
Reference |
|
|
Cameroon |
1961 |
5.3 |
World Fertility Survey, 1978 |
Cochrane and Farid (1989) |
|
|
1960–1962 |
4.6 |
Demographic survey |
U.S. Department of Commerce (1979) |
|
1964 |
4.9 |
Subnational demographic survey |
Cameroon (1983) |
|
|
1966 |
5.7 |
World Fertility Survey, 1978 |
Cochrane and Farid (1989) |
|
|
1969 |
6.4 |
1976 census; Coale method |
United Nations (1983)d |
|
|
1971 |
6.5 |
World Fertility Survey, 1978 |
Cochrane and Farid (1989) |
|
|
1974–1978 |
6.4 |
World Fertility Survey, 1978 |
Cochrane and Farid (1989) |
|
|
1976 |
6.0 |
Census; P/F ratios |
Cameroon (1983)f |
|
|
1980 |
6.3 |
1987 census; Coale method |
Lopez-Escartin (1991a)d |
|
|
1987 |
5.7 |
Census; method of estimation not stated |
Lopez-Escartin (1991a)f |
|
|
1991 |
5.8 |
Demographic and Health Survey, 1991 |
Cameroon (1992) |
|
|
Central African Republic |
1959–1960 |
4.9 |
National demographic survey |
Central African Republic (1964) |
|
|
1975 |
5.7 |
Census |
Central African Republic (1987) |
|
1988 |
6.1 |
Census |
Lopez-Escartin (1992c) |
|
|
Chad Congo |
1964 |
5.4 |
Subnational sample; P/F ratios |
U.S. Department of Commerce (1979)f |
|
|
1960–1961 |
4.9 |
Survey; P/F ratios |
Congo (1965)f |
|
1974 |
5.5 |
Census |
Congo (1978) |
|
|
1977 |
6.5 |
1984 census; Coale method |
Lopez-Escartin (1991e)d |
|
|
1984 |
6.6 |
Census; P/F ratios |
Congo (1987)d |
|
|
Equatorial Guinea |
1983 |
5.6 |
Census |
Equitorial Guinea (1991) |
|
Gabon |
1960–1961 |
4.1 |
Census and demographic survey |
Gabon (1965) |
|
|
1969–1970 |
4.5 |
Census; stable population theory |
Lopez-Escartin (1991c)d |
|
Zaire |
1955–1957 |
5.1 |
National demographic survey |
Lopez-Escartin (1992f) |
|
|
1978 |
6.2 |
Census; Coale method |
Zaire (1991)d |
|
1984 |
6.7 |
Census; method of estimation not stated |
Zaire (1991) |
|
Eastern Burundi |
1964–1965 |
7.1 |
National demographic survey |
Burundi (1966) |
|
|
1970–1971 |
6.1 |
National demographic survey; P/F ratios |
Burundi (1972)d |
|
1978 |
6.5 |
Pilot survey, precensus |
Barampanze (1991) |
|
|
1979 |
6.4 |
Census |
Barampanze (1991) |
|
|
1981–1983 |
7.6 |
Demographic and Health Survey, 1987 |
Segamba et al. (1988) |
|
|
1984–1986 |
6.9 |
Demographic and Health Survey, 1987 |
Segamba et al. (1988) |
|
|
1990 |
7.0 |
Census; P/F ratios |
Thibon (1993)f |
|
|
Ethiopia |
1963 |
7.1 |
1970 Subnational demographic survey; Coale method |
Kidane (1990)d |
|
|
1964–1967 |
6.7 |
National sample survey, first round; stable population theory |
Ethiopia (1971)d |
|
1968–1971 |
5.8 |
National sample survey, second round; P/F ratios |
Ethiopia (1974)d |
|
|
1970 |
7.2 |
Subnational demographic survey; P/F ratios |
Kidane (1990)f |
|
|
1974 |
7.6 |
1981 demographic survey; Coale method |
Kidane (1990)d |
|
|
1981 |
8.8 |
Demographic survey; P/F ratios |
Kidane (1990)f |
|
|
1984 |
7.9 |
Census; P/F ratios |
Ethiopia (1991a)d |
|
|
1990 |
6.6 |
Family and fertility survey (preliminary) |
Ethiopia (1991b) |
|
|
Kenya |
1962 |
6.8 |
Census; authors’ assessment from a range of methods |
Blacker et al. (1979)f |
|
|
1969 |
7.6 |
Census; authors’ assessment from a range of methods |
Blacker et al. (1979)f |
|
1972–1973 |
7.7 |
Subnational demographic baseline survey |
U.S. Department of Commerce (1979) |
|
|
1977 |
8.0 |
National demographic survey |
Kenya (1989) |
|
|
1977–1978 |
7.9 |
World Fertility Survey, 1977–1978 |
Kenya (1980) |
|
|
1979 |
7.9 |
Census; P/F ratios |
Kenya (1989)f |
|
|
1984 |
7.7 |
Contraceptive prevalence survey, 1984 |
Kenya (1984) |
|
|
1983–1985 |
6.8 |
Demographic and Health Survey, 1988–1989 |
Kenya (1989) |
|
|
1986–1989 |
6.7 |
Demographic and Health Survey, 1988–1989 |
Kenya (1989) |
|
Country |
Date of Estimate |
Data and Methodologyc |
Reference |
|
|
Madagascar |
1962 |
6.6 |
Rural household sample survey |
Lopez-Escartin (1991b) |
|
|
1966 |
6.6 |
National demographic survey |
Lopez-Escartin (1991b) |
|
1968 |
6.8 |
1975 census; Coale method |
Lopez-Escartin (1991b)d |
|
|
1975 |
6.4 |
Census |
Lopez-Escartin (1991b) |
|
|
Malawi |
1966 |
7.3 |
Census; stable population theory |
United Nations (1979)d |
|
|
1970 |
8.1 |
1977 census; Coale method |
Malawi (1980)d |
|
1970–1972 |
8.0 |
Population change survey; method of estimation not stated |
U.S. Department of Commerce (1979) |
|
|
1977 |
7.6 |
Census; P/F ratios |
Malawi (1980)f |
|
|
1980 |
7.5 |
1987 census; Coale method |
||
|
1982 |
7.6 |
National demographic survey |
Malawi (1987a) |
|
|
1984 |
7.5 |
Family formation survey; P/F ratios |
Malawi (1987b)f |
|
|
1987 |
8.0 |
Census; P/F ratios |
Malawi (1991); Malawi, National Statistical Office, personal communication (1992)d |
|
|
1992 |
6.7 |
Demographic and Health Surveys (preliminary) |
Malawi (1993) |
|
|
Mozambique |
1963 |
6.9 |
1970 census; Coale method |
United Nations (1979)d |
|
|
1970 |
6.6 |
Census; P/F ratios |
U.S. Department of Commerce (1979)f |
|
1980 |
7.0 |
Census; stable population theory |
United Nations (1990)d |
|
|
Rwanda |
1970 |
7.8 |
National demographic survey; P/F ratios |
Rwanda (1973)f |
|
|
1978 |
8.7 |
Census |
Rwanda (1984) |
|
1983 |
8.5 |
National demographic survey |
Rwanda (n.d.)e |
|
|
Somalia |
1975 |
6.9 |
Census; P/F ratios |
Somalia (1984)f |
|
|
1980 |
7.4 |
National population survey; P/F ratios |
|
|
1983 |
6.8 |
Sample survey of five cities |
Somalia (1985) |
|
Tanzania |
1967 |
7.2 |
Census; P/F ratios |
|
|
|
1971 |
7.0 |
1978 census; Coale method |
United Nations (1990)d |
|
1973 |
6.3 |
National sample survey; author’s assessment from a range of methods |
Ewbank (1979)f |
|
|
1978 |
6.9 |
Census; P/F ratios |
Tanzania (1983)f |
|
|
1988 |
6.5 |
Census |
Tanzania (1990) |
|
|
1991–1992 |
6.3 |
Demographic and Health Survey, 1981–1982 (preliminary) |
Tanzania (1992) |
|
|
Uganda |
1969 |
6.8 |
Census; P/F ratios |
Uganda (1973)d |
|
|
1982–1984 |
7.4 |
Demographic and Health Surveys, 1988–1989 |
Kaijuka et al. (1989) |
|
1985–1988 |
7.4 |
Demographic and Health Surveys, 1988–1989 |
Kaijuka et al. (1989) |
|
|
Zambia |
1967 |
7.1 |
1974 sample census; Coale method |
United Nations (1979)d |
|
|
1969 |
6.9 |
Census; P/F ratios |
Zambia (1985a)f |
|
1973 |
7.3 |
1980 census; Coale method |
United Nations (1990)d |
|
|
1974 |
6.7 |
Sample census; P/F ratios |
Hill (1985)f |
|
|
1980 |
7.4 |
Census; P/F ratios |
Zambia (1985b)f |
|
|
1989–1992 |
6.5 |
Demographic and Health Survey, 1992 |
Gaisie et al. (1993) |
|
|
Zimbabwe |
1962 |
6.7 |
1969 census; Coale method |
United Nations (1979)d |
|
|
1969 |
8.2 |
Census; P/F ratios |
Thomas and Muvandi (1992)f |
|
1975 |
7.0 |
1982 census; Coale method |
United Nations (1990)d |
|
|
1982 |
7.1 |
Census; P/F ratios |
Thomas and Muvandi (1992)f |
|
|
1984 |
6.5 |
Reproductive health survey |
Zimbabwe (1989) |
|
|
1982–1984 |
6.7 |
Demographic and Health Survey, 1988–1989 |
Zimbabwe (1989) |
|
|
1987 |
5.1 |
Intercensal demographic survey |
Zimbabwe (1989) |
|
|
1985–1988 |
5.5 |
Demographic and Health Survey, 1988–1989 |
Zimbabwe (1989) |
|
|
Southern Botswana |
1971 |
6.6 |
Census; stable population theory |
U.S. Department of Commerce (1979)f |
|
|
1974 |
6.7 |
1981 census; Coale method |
United Nations (1990)d |
|
1981 |
7.1 |
Census |
Manyeneng et al. (1985) |
|
|
1982–1984 |
5.9 |
Demographic and Health Survey, 1988 |
Lesetedi et al. (1989) |
|
|
1984 |
6.5 |
Contraceptive prevalence survey |
Manyeneng et al. (1985) |
|
|
1985–1988 |
4.9 |
Demographic and Health Survey, 1988 |
Lesetedi et al. (1989) |
|
Country |
Date of Estimate |
Data and Methodologyc |
Reference |
|
|
Lesotho |
1961 |
5.6 |
World Fertility Survey, 1977 |
Cochrane and Farid (1989) |
|
|
1966 |
5.8 |
World Fertility Survey, 1977 |
Cochrane and Farid (1989) |
|
1971 |
5.5 |
World Fertility Survey, 1977 |
Cochrane and Farid (1989) |
|
|
1976 |
5.8 |
World Fertility Survey, 1977 |
Cochrane and Farid (1989) |
|
|
1976 |
5.3 |
Census; stable population theory |
United Nations (1990)d |
|
|
1986 |
5.2 |
Census; P/F ratios |
Lesotho (1991)d |
|
|
Namibia |
1992 |
5.6 |
Demographic and Health Survey, 1992 (preliminary) |
Namibia (1992) |
|
South Africa (black population only) |
1960 |
6.6 |
Source and method of estimation not stated |
Chimere-Dan (1993) |
|
|
1970 |
5.8 |
Source and method of estimation not stated |
Chimere-Dan (1993) |
|
1980 |
5.4 |
Source and method of estimation not stated |
Chimere-Dan (1993) |
|
|
1987–1989 |
4.6 |
South African Demographic and Health Survey |
Mostert (1990) |
|
|
Swaziland |
1966 |
6.9 |
Census; method of estimation not stated |
U.S. Department of Commerce (1979) |
|
|
1976 |
5.7 |
Census; stable population theory |
United Nations (1984)d |
|
1986 |
5.1 |
Census |
Warren et al. (1992) |
|
|
1988 |
5.0 |
Family health survey |
Warren et al. (1992) |
|
|
aThe TFRs have not always been calculated by using similar recall periods since, in a number of instances, theoretical purity was outweighted by data limitations. bEstimate refers to women aged 15–49 unless marked otherwise. cWhere no method is noted, direct estimation was used. dIndirect estimate based on the author’s calculations. en.d.=no date. fIndirect estimate provided in reference. gTFR for women aged 15–44. |
||||
Most recent estimates of the TFR in each country are shown in the map (the data for the map are from Table 2–1). African fertility rates are not homogeneous across the continent, and close investigation of demographic data reveals considerable diversity. In the 13 West African countries in Table 2–1, the estimated TFRs lie within a narrow range between 6.2 and 7.4 births per woman. Fertility in West Africa is highest in Niger, where the TFR was estimated to be 7.4 children per woman in 1992, and lowest in Nigeria, where the TFR was estimated to be 6.2 children per woman in 1990. For the 12 East African countries discussed in this chapter, fertility ranges from 5.5 children per woman in Zimbabwe to 8.5 children per woman

Total fertility rates in sub-Saharan Africa. SOURCE: See Table 2–1; estimates are the most recent available.
in Rwanda. In the majority of East African countries the TFR is between 6.4 and 7.0 children per woman.
Average fertility in Central Africa is somewhat lower than it is in either East or West Africa. Fertility in Central Africa was lower during the 1960s and 1970s than elsewhere in Africa because of high levels of infertility and subfecundity. In all probability, the most common cause of infertility in sub-Saharan Africa was a high prevalence of gonorrhea (Frank, 1983). Childlessness is a good indicator of overall infertility, and a rate of childlessness of 3 percent is what one might expect to see in a developing country (Frank, 1983). In Central Africa, the proportion of women aged 45 and over who have not had a live birth ranges from 11 percent in Chad and Angola to more than 20 percent in Congo, Gabon, and Zaire (Frank, 1983).
Fertility estimates are included for five countries in southern Africa: Botswana, Lesotho, Namibia, South Africa, and Swaziland. Most recent estimates for Botswana, South Africa, and Swaziland indicate that the TFR in these three countries lies between 4.5 and 5.0 children per woman. Fertility is slightly higher in Namibia and Lesotho, although the latest estimate of the TFR in Lesotho (5.2 children per woman in 1986) is now quite dated.
The black population of South Africa experienced a decline in fertility before any country of sub-Saharan Africa (Caldwell and Caldwell, 1993). This fact has been poorly documented for two reasons. First, a long period of international political isolation has meant that little has been written about the demographic situation in South Africa over the last 30 or so years. Second, the South African government has been reluctant to provide open access to demographic data. In addition, the primary means of collecting demographic data—the registration of births and deaths—has not been complete because black South Africans have not felt sufficiently vested in ensuring its accuracy (Caldwell and Caldwell, 1993).
Fortunately, the situation has improved recently. The country has entered a period of political, social, and economic reform, and new data have emerged from a DHS-type household survey conducted in 1987–1989 under the auspices of the Human Sciences Research Council of South Africa. There were some initial concerns about the general lack of documentation of the sampling and methodological strategies that were employed to collect these data (see, for example, Freedman, 1992; Caldwell and Caldwell, 1993), but these issues have now been rectified (R.Freedman, personal communication, 1993). These data reveal that the black population of South Africa currently has lower rates of childbearing and higher rates of modern contraceptive use than any country in sub-Saharan Africa. However, there will probably be a great deal of debate about the extent to which comparisons should be drawn between the South African experience and the experiences of other countries in the region.
Undoubtedly, African fertility has varied over time. The longstanding
belief that African fertility levels have remained the same for long periods is probably a result of the absence of reliable time-series data (Page, 1988). The seemingly regular occurrence of catastrophic events certainly creates substantial short-run variations in demographic rates that often go unrecorded. However, the subject of short-term fluctuations in fertility lies beyond the scope of this chapter.4 The only changes in fertility rates discussed below are the more permanent ones that have occurred over longer periods of time.
There is some evidence to suggest that fertility rates rose in several African countries during the 1960s and 1970s. As stated earlier, it is unclear what proportion of the change is genuine and what proportion is attributable to improvements in data collection. A popular example of a country in which fertility rates may have increased is Kenya. Historical fertility estimates for Kenya are available from the 1962 Post-Enumeration Sample Census, the 1969 census, and the 1977 National Demographic Survey. At face value, the data from these sources indicate that fertility rose dramatically from 5.3 births per woman in 1962 to 6.6 in 1969 and to 8.0 in 1977. Extensive manipulation resulted in official estimates being revised to 6.8 for 1962 and 7.6 for 1969. However, it is now apparent that the shapes of the age-specific fertility distribution derived from both the 1962 and the 1969 censuses were almost certainly biased (Blacker et al., 1979). Despite the extensive official data manipulation, TFR estimates for 1962 and 1969 are probably still too low. Fertility probably increased in Kenya between 1962 and 1977, but the true extent of the increase is unknown.
An increase in fertility in recent decades appears more certain in Cameroon and certain other Central African countries. Of the eight Central African nations included here, only in Cameroon and Angola was fertility higher than 5.5 births per women before 1975. Currently, fertility is estimated to be above this level in all six countries for which data are available after 1975. This increase in fertility has been attributed largely to a reduction in the historically high incidence of pathological sterility in Central Africa resulting from widespread STDs (Frank, 1983; Tambashe, 1992).
Recent indications exist that fertility may be falling in several sub-Saharan African countries, a topic that is taken up in more detail below. Table 2–1 shows fertility falling in 26 countries. In most cases, however, the declines in fertility are quite small, less than one birth per woman. The observed declines could be a function of using alternative strategies to estimate fertility at different points in time or the result of using unreliable
data. Evidence of declining fertility is strongest in Kenya, Botswana, and Zimbabwe. Apart from Ethiopia and Malawi, where the data are too unreliable to detect the magnitude of a decline with any measure of certainty, these are the only countries that show a recent fertility decline of more than 1.0 birth per woman. Recent data from various DHS surveys indicate that fertility may be falling in other countries as well, including Senegal, Zambia, and parts of Nigeria. However, in these and other cases, the changes in fertility are smaller and less definite. Further observation is required to confirm these trends.
Detecting the start of a decline in fertility is not always easy. The number of children a woman bears is the outcome of a series of complex interactions among biological, social, economic, and other factors. These factors can be conveniently divided into the proximate (biological and behavioral) determinants that directly influence fertility, and all other social and economic factors that affect fertility only indirectly through the proximate determinants (Bongaarts and Potter, 1983). Early detection of fertility decline through behavioral changes affecting the proximate determinants is made difficult because certain aspects of socioeconomic development can have competing effects on the proximate determinants that cancel each other at low levels of development (Lesthaeghe et al., 1981). Hence, early detection of fertility decline would be considerably easier if we had more precise measures of each of the proximate determinants and a clearer understanding of how these variables relate to one another. (See Chapter 3 for a more indepth discussion of proximate determinants in sub-Saharan Africa.) Finally, fertility and nuptiality patterns may be affected by the recent implementation of structural adjustment programs by several African governments in response to worsening economic conditions. It is unclear whether any crisis-induced reductions in fertility would be sustainable for long periods of time. It is worth noting, however, that economic conditions in Kenya, Botswana, and Zimbabwe have been better than average for the region during the past 10 years (van de Walle and Foster, 1990).
Shape of the Fertility Distribution
A great deal can be learned about the timing and intensity of childbearing from a simple examination of the shape of the fertility schedule by age. However, construction of fertility schedules requires reasonably accurate data because the omission or misplacement of vital events can lead to serious errors. Recent estimates of age-specific fertility rates (ASFRs) are presented in Figures 2–1 to 2–4. The data for these figures are provided in Table 2–2. The data reveal a remarkable degree of similarity among estimates across countries, particularly given the many difficulties associated with collecting accurate demographic data in an area where significant per-
centages of the population are unable to recall either their own or their children’s dates of birth. Below, first births and the timing of subsequent births are discussed.
First Births
The age at which a woman gives birth for the first time has important implications for the health and well-being of the mother and her child (Haaga, 1989). Compared to older women, teenage mothers face greater risks of pregnancy- and delivery- related complications, maternal morbidity and mortality, and having premature or low-birthweight babies. Significant educational and economic consequences also result from having children at a very young age. The most publicized examples of these consequences relate to lost educational opportunities (Working Group on the Social Dynamics of Adolescent Fertility, 1993). Under a natural fertility regime, with little or no use of modern contraception, the mother’s age at first birth is also an important determinant of completed family size.
In general, African countries have relatively high rates of adolescent fertility, and the median age of women at first birth in sub-Saharan Africa is approximately two years younger than it is in North Africa, Asia, or Latin America (Arnold and Blanc, 1990). Table 2–2 reveals that the largest differences between age-specific fertility schedules for a subset of countries in sub-Saharan Africa occur among women aged 15–19. This finding is largely attributable to differences in the average age of marriage in these countries. For example, teenage fertility is highest in Mali, where the mean age of 15.7 at first marriage is among the lowest in Africa (Traore et al., 1989). Similarly, adolescent fertility is low in Burundi where the mean age at first marriage is relatively high, 19.5 years (Segamba et al., 1988).
In the past, the vast majority of childbearing in Africa probably took place within the institution of marriage. However, recent survey data have identified a weakening of the link between the age at which a woman first marries and the age at which a woman first gives birth. What appears to be occurring in several countries is that the age at first marriage is increasing while the age at first birth is remaining constant. Consequently, several countries have recorded an increase in births among unmarried adolescents. In Kenya and Botswana, more than 70 percent of teenagers who give birth either are unmarried or become pregnant before they marry (Population Reference Bureau, 1992; see Chapter 4, for a discussion of marriage trends and the relation of marriage and fertility.)
TABLE 2–2 Age-Specific Fertility and Total Fertility Rates for Selected Sub-Saharan Africa Countries
|
|
Age |
|||
|
Areas and Countries |
Year of Survey |
15–19 |
20–24 |
25–29 |
|
Western |
|
|||
|
Burkina Faso |
1985 |
0.152 |
0.328 |
0.321 |
|
Ghana |
1988 |
0.130 |
0.258 |
0.279 |
|
Liberia |
1986 |
0.188 |
0.289 |
0.275 |
|
Mali |
1987 |
0.209 |
0.288 |
0.293 |
|
Niger |
1992 |
0.230 |
0.327 |
0.317 |
|
Nigeria |
1990 |
0.144 |
0.267 |
0.274 |
|
Senegal |
1986 |
0.161 |
0.274 |
0.274 |
|
Togo |
1988 |
0.129 |
0.269 |
0.277 |
|
Middle |
|
|||
|
Cameroon |
1991 |
0.164 |
0.282 |
0.260 |
|
Congo |
1984 |
0.152 |
0.287 |
0.294 |
|
Eastern |
|
|||
|
Burundi |
1987 |
0.052 |
0.268 |
0.321 |
|
Ethiopia |
1990 |
0.102 |
0.293 |
0.287 |
|
Kenya |
1988–1989 |
0.153 |
0.315 |
0.295 |
|
Malawi |
1992 |
0.161 |
0.287 |
0.269 |
|
Tanzania |
1991–1992 |
0.144 |
0.278 |
0.268 |
|
Uganda |
1988–1989 |
0.186 |
0.325 |
0.322 |
|
Zambia |
1993 |
0.156 |
0.294 |
0.271 |
|
Zimbabwe |
1988–1989 |
0.103 |
0.247 |
0.246 |
|
Southern |
|
|||
|
Botswana |
1988 |
0.127 |
0.213 |
0.203 |
|
Lesotho |
1986 |
0.091 |
0.250 |
0.239 |
|
Namibia |
1992 |
0.108 |
0.208 |
0.249 |
|
South Africab |
1987–1989 |
0.124 |
0.223 |
0.196 |
|
Swaziland |
1988 |
0.129 |
0.224 |
0.211 |
|
All countries |
|
|||
|
(unweighted average) |
|
0.137 |
0.262 |
0.260 |
|
NOTE: Estimates from DHS birth-history data are based on 3- or 4-year recall periods instead of the conventional 5-year period in order to avoid the problem of displacement of births identified by Arnold (1990). aTFRs do not match those in Table 2–1 because of different recall periods. bBlack population only. |
||||
|
|
Total Fertility Rate |
|||
|
30–34 |
35–39 |
40–44 |
45–49 |
|
|
0.279 |
0.215 |
0.104 |
0.038 |
7.2 |
|
0.243 |
0.187 |
0.116 |
0.059 |
6.4 |
|
0.226 |
0.185 |
0.115 |
0.062 |
6.7a |
|
0.265 |
0.199 |
0.114 |
0.040 |
7.0a |
|
0.258 |
0.196 |
0.106 |
0.042 |
7.4 |
|
0.222 |
0.162 |
0.095 |
0.067 |
6.2 |
|
0.265 |
0.200 |
0.100 |
0.050 |
6.6 |
|
0.244 |
0.215 |
0.111 |
0.073 |
6.6a |
|
0.228 |
0.149 |
0.062 |
0.020 |
5.8 |
|
0.263 |
0.195 |
0.102 |
0.032 |
6.6 |
|
0.290 |
0.241 |
0.129 |
0.084 |
6.9 |
|
0.274 |
0.210 |
0.101 |
0.058 |
6.6 |
|
0.246 |
0.183 |
0.099 |
0.034 |
6.6a |
|
0.254 |
0.197 |
0.120 |
0.058 |
6.7 |
|
0.228 |
0.184 |
0.108 |
0.040 |
6.3 |
|
0.275 |
0.231 |
0.098 |
0.034 |
7.4 |
|
0.242 |
0.194 |
0.105 |
0.031 |
6.5 |
|
0.222 |
0.160 |
0.085 |
0.036 |
5.5 |
|
0.187 |
0.146 |
0.082 |
0.037 |
5.0a |
|
0.198 |
0.159 |
0.082 |
0.025 |
5.2 |
|
0.219 |
0.175 |
0.115 |
0.044 |
5.6 |
|
0.164 |
0.125 |
0.060 |
0.023 |
4.6 |
|
0.198 |
0.129 |
0.067 |
0.033 |
5.0 |
|
0.229 |
0.176 |
0.094 |
0.042 |
6.0 |
|
SOURCES: Burkina Faso (no date); Cameroon (1992); Congo (1987); Ethiopia (1991b); Lesotho (1991); Malawi (1993); Mosert (1990); Namibia (1992); Niger (1992b); Tanzania (1992); Warren et al. (1992); Zambia (1993), and calculations from Demographic and Health Surveys standard recode files. |
||||
Timing of Subsequent Births
Figures 2–1 to 2–4 illustrate another essential feature of fertility in Africa: Unlike Western populations, childbearing continues throughout a woman’s reproductive years with no obvious “stopping” behavior. The peak of childbearing occurs between 20 and 29 and falls slowly, indicating little parity-specific limitation. In societies that practice family limitation, fertility rates depart from a natural fertility schedule as women age, because women use efficient methods of contraception to prevent pregnancy once they have achieved their desired family size. There is little evidence of a stopping pattern in any of the fertility schedules for sub-Saharan Africa, despite the reported practice of terminal abstinence in some societies.
It is important to note, however, that there is some debate about the path that fertility decline in Africa is likely to take and, consequently, the effect of a decline in fertility on the shape of the age-specific fertility distribution. Caldwell et al. (1992) argue that the nature of fertility decline in Africa is likely to be very different from that observed in Asia or Latin America. The reasons are related to differences in constraints on premarital and extramarital sexuality, and different emphases on the need and reasons for birth spacing. In Africa, efficient contraception may be used to space children more efficiently rather than as a means to lower completed family

FIGURE 2–1 Age-specific fertility rates: western Africa.


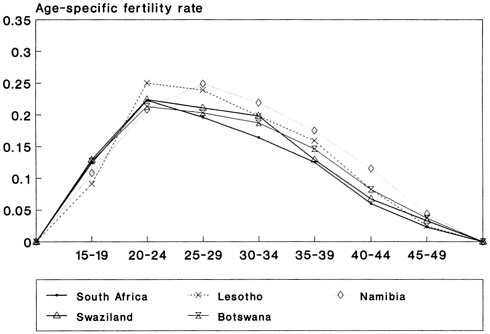
FIGURE 2–4 Age-specific fertility rates: southern Africa.
size. There may also be a growing demand for efficient contraceptives among unmarried women who want to delay the onset of marriage and childbearing. Consequently, Caldwell et al. predict that fertility decline in Africa is likely to involve a simultaneous uptake in contraceptive use at all ages.
Socioeconomic Differentials in Achieved Family Size
The relationship between various indicators of socioeconomic development and family size is an important topic that is of direct relevance to planners and policymakers attempting to integrate population variables into development planning. Place of residence and education are examined here because they are usually two of the most efficient predictors of fertility decline.
Place of Residence
Previous studies have consistently observed that women living in urban areas have fewer children than their rural counterparts. The explanation for this difference is often that women in urban areas tend to have more education and are more likely to participate in the formal labor market. Conse-
quently, these women are more likely to appreciate the advantages of having a smaller family. At the same time, urban women are assumed to have better knowledge of, and access to, modern contraception than women in rural areas.
Age-specific fertility rates by place of residence are shown in Table 2–3 for selected countries that participated in the DHS. The data confirm our a priori expectations: Rural fertility is substantially higher than urban fertility in every country even in those countries where national-level fertility estimates do not indicate a recent decline in childbearing (for example, Mali, Togo, and Uganda). The average difference in total fertility is 1.8 births per woman; however, the difference ranges from less than 1.1 births per woman in Cameroon and Liberia to more than 2.5 births per woman in Ethiopia, Tanzania, and Togo. The urban-rural differential is usually highest among those aged 15–19 and 45–49, reflecting differences in age at marriage and limitation of family size, respectively.
Level of Education
Fertility has also been closely associated with female educational levels, although identifying the direction of any causal relationship between fertility and education is complex (Cochrane, 1979). Lower levels of fertility are associated usually with higher levels of education. Typically, the explanation for this association revolves around the fact that more educated women are more likely to delay marriage and to work for paid employment in the formal labor market after leaving school. Consequently, the demand for children may be inversely related to educational level. Literacy skills may improve women’s ability to practice efficient contraception and may empower them with more decision-making authority in the household. However, it could be that the initiation of childbearing is a factor in the termination of education.
Several studies have found that low levels of education as opposed to no education may actually be associated with relatively higher fertility. Small amounts of education may break down birth-spacing practices, including long breastfeeding intervals and postpartum abstinence, without lowering fertility desires or increasing age at marriage. On the other hand, higher levels of education are almost always associated with the lowest fertility.
Age-specific fertility rates by level of education for countries participating in the DHS are presented in Table 2–4. The essential point to take from this table is that fertility does not appear very responsive to small amounts of education. The average TFR for women with no education, 7.0 (as shown at the bottom of the table), is identical to that for women with 1 to 4 years of education. In five countries, Burundi, Kenya, Liberia, Mali, and Nigeria, fertility rises with a small amount of education. (Fertility may
TABLE 2–3 Age-Specific Fertility and Total Fertility Rates by Current Residence
|
Country and Residence |
Age |
Total Fertility Rate |
||||||
|
15–19 |
20–24 |
25–29 |
30–34 |
35–39 |
40–44 |
45–49 |
||
|
Western Ghana |
|
|||||||
|
Urban |
0.153 |
0.204 |
0.262 |
0.209 |
0.137 |
0.104 |
0.044 |
5.3 |
|
Rural |
0.091 |
0.284 |
0.287 |
0.259 |
0.213 |
0.122 |
0.066 |
6.9 |
|
Liberia |
|
|||||||
|
Urban |
0.173 |
0.270 |
0.261 |
0.206 |
0.187 |
0.087 |
0.039 |
6.1 |
|
Rural |
0.202 |
0.306 |
0.286 |
0.241 |
0.184 |
0.126 |
0.073 |
7.1 |
|
Mali |
|
|||||||
|
Urban |
0.172 |
0.256 |
0.284 |
0.253 |
0.169 |
0.083 |
0.020 |
6.2 |
|
Rural |
0.224 |
0.300 |
0.296 |
0.270 |
0.209 |
0.122 |
0.042 |
7.3 |
|
Niger |
|
|||||||
|
Niamey |
0.118 |
0.259 |
0.266 |
0.246 |
0.180 |
0.070 |
0.034 |
5.9 |
|
Rural |
0.242 |
0.333 |
0.324 |
0.261 |
0.196 |
0.105 |
0.042 |
7.5 |
|
Nigeria |
|
|||||||
|
Urban |
0.091 |
0.211 |
0.267 |
0.227 |
0.138 |
0.056 |
0.038 |
5.1 |
|
Rural |
0.164 |
0.287 |
0.276 |
0.227 |
0.163 |
0.089 |
0.068 |
6.4 |
|
Senegal |
|
|||||||
|
Urban |
0.098 |
0.242 |
0.249 |
0.241 |
0.189 |
0.067 |
0.027 |
5.6 |
|
Rural |
0.212 |
0.297 |
0.291 |
0.282 |
0.206 |
0.117 |
0.051 |
7.3 |
|
Togo |
|
|||||||
|
Urban |
0.072 |
0.211 |
0.226 |
0.209 |
0.150 |
0.079 |
0.035 |
4.9 |
|
Rural |
0.169 |
0.304 |
0.305 |
0.261 |
0.238 |
0.122 |
0.085 |
7.4 |
|
Middle Cameroon |
|
|||||||
|
Urban |
0.130 |
0.273 |
0.250 |
0.189 |
0.130 |
0.049 |
0.013 |
5.2 |
|
Rural |
0.189 |
0.290 |
0.268 |
0.261 |
0.160 |
0.067 |
0.023 |
6.3 |
|
Eastern Burundi |
|
|||||||
|
Urban |
0.130 |
0.261 |
0.265 |
0.227 |
0.092 |
0.025 |
0.000 |
5.0 |
|
Rural |
0.048 |
0.269 |
0.323 |
0.291 |
0.245 |
0.133 |
0.086 |
7.0 |
|
Ethiopia |
|
|||||||
|
Urban |
0.028 |
0.167 |
0.200 |
0.176 |
0.112 |
0.065 |
0.012 |
3.8 |
|
Rural |
0.122 |
0.314 |
0.301 |
0.288 |
0.228 |
0.106 |
0.065 |
7.1 |
|
Kenya |
|
|||||||
|
Urban |
0.130 |
0.250 |
0.220 |
0.176 |
0.107 |
0.016 |
0.043 |
4.7 |
|
Rural |
0.159 |
0.334 |
0.312 |
0.259 |
0.192 |
0.107 |
0.034 |
7.0 |
|
Malawi |
|
|||||||
|
Urban |
0.135 |
0.268 |
0.242 |
0.210 |
0.149 |
0.086 |
0.012 |
5.5 |
|
Rural |
0.165 |
0.291 |
0.273 |
0.261 |
0.202 |
0.123 |
0.062 |
6.9 |
|
Tanzania |
|
|||||||
|
Dar es Salaam |
0.083 |
0.214 |
0.202 |
0.180 |
0.101 |
0.022 |
0.000 |
4.0 |
|
Rural |
0.148 |
0.296 |
0.285 |
0.240 |
0.192 |
0.115 |
0.045 |
6.6 |
|
Uganda |
|
|||||||
|
Urban |
0.139 |
0.304 |
0.298 |
0.170 |
0.152 |
0.060 |
0.000 |
5.6 |
|
Rural |
0.194 |
0.329 |
0.325 |
0.285 |
0.239 |
0.100 |
0.036 |
7.5 |
|
Zambia |
|
|||||||
|
Urban |
0.133 |
0.263 |
0.265 |
0.222 |
0.171 |
0.078 |
0.028 |
5.8 |
|
Rural |
0.184 |
0.328 |
0.276 |
0.264 |
0.221 |
0.121 |
0.032 |
7.1 |
|
Zimbabwe |
|
|||||||
|
Urban |
0.083 |
0.190 |
0.199 |
0.149 |
0.097 |
0.047 |
0.006 |
3.9 |
|
Rural |
0.113 |
0.283 |
0.271 |
0.259 |
0.188 |
0.099 |
0.045 |
6.3 |
|
Southern Botswana |
|
|||||||
|
Urban |
0.115 |
0.171 |
0.161 |
0.150 |
0.123 |
0.045 |
0.026 |
4.0 |
|
Rural |
0.134 |
0.235 |
0.222 |
0.190 |
0.155 |
0.090 |
0.038 |
5.3 |
|
All countries (crude average) |
|
|||||||
|
Urban |
0.113 |
0.234 |
0.242 |
0.202 |
0.140 |
0.061 |
0.022 |
5.1 |
|
Rural |
0.166 |
0.299 |
0.290 |
0.259 |
0.202 |
0.110 |
0.053 |
6.9 |
|
SOURCES: Cameroon (1992); Ethiopia (1991b); Malawi (1993); Niger (1992); Tanzania (1992); Zambia (1993), and calculations from Demographic and Health Surveys standard recode files. |
||||||||
TABLE 2–4 Age-Specific Fertility and Total Fertility Rates by Level of Education
|
Country and Years School |
Age |
Total Fertility Rate |
||||||
|
15–19 |
20–24 |
25–29 |
30–34 |
35–39 |
40–44 |
45–49 |
||
|
Western Ghana |
|
|||||||
|
0 |
0.163 |
0.281 |
0.305 |
0.236 |
0.187 |
0.132 |
0.060 |
6.8 |
|
1–4 |
0.163 |
0.280 |
0.267 |
0.233 |
0.202 |
0.074 |
0.100 |
6.6 |
|
5–7 |
0.157 |
0.284 |
0.306 |
0.198 |
0.150 |
0.085 |
0.023 |
6.0 |
|
8+ |
0.099 |
0.232 |
0.253 |
0.217 |
0.193 |
0.085 |
0.028 |
5.5 |
|
Liberia |
|
|||||||
|
0 |
0.188 |
0.298 |
0.286 |
0.236 |
0.193 |
0.117 |
0.065 |
6.9 |
|
1–4 |
0.194 |
0.338 |
0.342 |
0.252 |
0.152 |
0.179 |
0.082 |
7.7 |
|
5–7 |
0.204 |
0.333 |
0.302 |
0.239 |
0.141 |
0.096 |
0.108 |
7.1 |
|
8+ |
0.165 |
0.233 |
0.185 |
0.143 |
0.142 |
0.051 |
0.000 |
4.6 |
|
Mali |
|
|||||||
|
0 |
0.233 |
0.289 |
0.293 |
0.267 |
0.203 |
0.115 |
0.037 |
7.2 |
|
1–4 |
0.198 |
0.312 |
0.294 |
0.209 |
0.133 |
0.098 |
0.305 |
7.8 |
|
5–7 |
0.218 |
0.317 |
0.279 |
0.206 |
0.148 |
0.140 |
0.000 |
6.5 |
|
8+ |
0.084 |
0.227 |
0.291 |
0.349 |
0.121 |
0.000 |
0.000 |
5.4 |
|
Nigeria |
|
|||||||
|
0 |
0.210 |
0.283 |
0.269 |
0.220 |
0.166 |
0.091 |
0.062 |
6.5 |
|
1–4 |
0.178 |
0.353 |
0.332 |
0.255 |
0.198 |
0.090 |
0.090 |
7.5 |
|
5–7 |
0.134 |
0.309 |
0.308 |
0.255 |
0.123 |
0.036 |
0.032 |
6.0 |
|
8+ |
0.059 |
0.185 |
0.232 |
0.203 |
0.109 |
0.015 |
0.091 |
4.5 |
|
Senegal |
|
|||||||
|
0 |
0.197 |
0.289 |
0.285 |
0.276 |
0.207 |
0.104 |
0.041 |
7.0 |
|
1–4 |
0.088 |
0.274 |
0.307 |
0.199 |
0.182 |
0.000 |
0.090 |
5.7 |
|
5–7 |
0.112 |
0.252 |
0.237 |
0.269 |
0.114 |
0.028 |
0.000 |
5.1 |
|
8+ |
0.045 |
0.169 |
0.204 |
0.168 |
0.167 |
0.000 |
0.000 |
3.8 |
|
Togo |
|
|||||||
|
0 |
0.168 |
0.307 |
0.299 |
0.254 |
0.225 |
0.111 |
0.074 |
7.2 |
|
1–4 |
0.131 |
0.287 |
0.253 |
0.305 |
0.238 |
0.101 |
0.115 |
7.2 |
|
5–7 |
0.107 |
0.244 |
0.268 |
0.180 |
0.155 |
0.071 |
0.000 |
5.1 |
|
8+ |
0.048 |
0.151 |
0.186 |
0.164 |
0.124 |
0.212 |
0.000 |
4.4 |
|
Eastern Burundi |
|
|||||||
|
0 |
0.051 |
0.267 |
0.318 |
0.287 |
0.239 |
0.123 |
0.091 |
6.9 |
|
1–4 |
0.066 |
0.285 |
0.315 |
0.335 |
0.253 |
0.169 |
0.000 |
7.1 |
|
5–7 |
0.043 |
0.262 |
0.364 |
0.266 |
0.294 |
0.163 |
0.062 |
7.3 |
|
8+ |
0.062 |
0.244 |
0.298 |
0.258 |
0.154 |
0.151 |
0.000 |
5.8 |
|
Kenya |
|
|||||||
|
0 |
0.231 |
0.306 |
0.303 |
0.275 |
0.193 |
0.105 |
0.034 |
7.2 |
|
1–4 |
0.284 |
0.353 |
0.311 |
0.268 |
0.176 |
0.098 |
0.041 |
7.7 |
|
5–7 |
0.188 |
0.338 |
0.307 |
0.229 |
0.197 |
0.112 |
0.059 |
7.2 |
|
8+ |
0.097 |
0.280 |
0.257 |
0.180 |
0.111 |
0.049 |
0.016 |
5.0 |
|
Country and Years School |
Age |
Total Fertility Rate |
||||||
|
15–19 |
20–24 |
25–29 |
30–34 |
35–39 |
40–44 |
45–49 |
||
|
Uganda |
|
|||||||
|
0 |
0.243 |
0.341 |
0.326 |
0.290 |
0.246 |
0.107 |
0.032 |
7.9 |
|
1–4 |
0.185 |
0.324 |
0.307 |
0.273 |
0.231 |
0.085 |
0.048 |
7.3 |
|
5–7 |
0.187 |
0.321 |
0.352 |
0.243 |
0.189 |
0.083 |
0.030 |
7.0 |
|
8+ |
0.087 |
0.291 |
0.272 |
0.272 |
0.221 |
0.000 |
0.000 |
5.7 |
|
Zimbabwe |
|
|||||||
|
0 |
0.203 |
0.294 |
0.270 |
0.289 |
0.180 |
0.122 |
0.077 |
7.2 |
|
1–4 |
0.211 |
0.311 |
0.280 |
0.261 |
0.174 |
0.077 |
0.015 |
6.7 |
|
5–7 |
0.125 |
0.272 |
0.238 |
0.208 |
0.154 |
0.082 |
0.020 |
5.5 |
|
8+ |
0.072 |
0.179 |
0.216 |
0.141 |
0.116 |
0.011 |
0.000 |
3.7 |
|
Southern Botswana |
|
|||||||
|
0 |
0.118 |
0.242 |
0.218 |
0.216 |
0.188 |
0.107 |
0.062 |
5.8 |
|
1–4 |
0.178 |
0.235 |
0.223 |
0.228 |
0.137 |
0.071 |
0.018 |
5.5 |
|
5–7 |
0.143 |
0.225 |
0.205 |
0.162 |
0.133 |
0.067 |
0.000 |
4.7 |
|
8+ |
0.096 |
0.174 |
0.167 |
0.113 |
0.082 |
0.046 |
0.000 |
3.4 |
|
All countries (crude average) |
|
|||||||
|
0 |
0.182 |
0.291 |
0.288 |
0.259 |
0.202 |
0.112 |
0.058 |
7.0 |
|
1–4 |
0.171 |
0.305 |
0.294 |
0.256 |
0.189 |
0.095 |
0.082 |
7.0 |
|
5–7 |
0.147 |
0.287 |
0.288 |
0.223 |
0.163 |
0.088 |
0.030 |
6.1 |
|
8+ |
0.083 |
0.215 |
0.233 |
0.201 |
0.140 |
0.056 |
0.012 |
4.7 |
|
SOURCE: Calculated from Demographic and Health Surveys standard recode files. |
||||||||
rise with small amounts of education in other countries as well, but the increase may be masked by the way the education categories were formed.) Even with 5–7 years of education, the average TFR remains high at 6.1 births per women. This figure represents a modest reduction in fertility of less than one child per woman, compared to women who have never attended school.
Fertility is considerably more responsive at higher levels of education. Women with eight or more years of education have many fewer children than women with no education. The difference ranges from 1.3 children per woman in Ghana to 3.5 children per woman in Zimbabwe. One explanation is that secondary education has a large positive and significant effect on the average age at first marriage and the average age at first birth (Westoff, 1992).
RECENT EVIDENCE OF A FERTILITY DECLINE IN COUNTRIES PARTICIPATING IN THE DHS
Sub-Saharan Africa is the only major region of the developing world that has not yet undergone a general decline in fertility. So the question of when fertility is likely to decline is a pressing one. The possibility that fertility may already be declining in several African countries was mentioned in an earlier discussion of TFRs. The evidence presented in Table 2–1 indicates that many sub-Saharan African countries are experiencing minor declines in fertility. However, small declines in fertility could be artificial—the product of using different strategies to estimate fertility at different points in time, or the product of unreliable data. Consequently, more detailed analysis is required to confirm whether small observed declines in fertility are genuine.
This section provides corroborating evidence for fertility declines in the sub-Saharan African countries that are participating in the DHS, when it exists. Two strategies are used to judge the veracity of recent trends in TFRs for DHS countries. The first strategy is based on a simple fact: It is easier to accept a change in fertility as genuine if it is accompanied by a change in one of the proximate determinants of fertility that would account for it (e.g., an increase in age at marriage or in the use of contraceptives). Consequently, changes in fertility are compared with changes in marriage patterns, changes in acceptance and mix of contraceptive methods, and changes in family size preferences. The second strategy is to conduct an independent, in-depth analysis of birth histories by using life table techniques.
Table 2–5 presents direct estimates of the total fertility rate for each of the 11 African countries for which detailed DHS information were available. The surveys were conducted over a 5-year period, 1986–1990. The fertility estimates do not all refer to the same date. They have been calculated by using recall periods of 0–3 years and 4–7 years prior to the date each country was surveyed.
Fertility appears to have fallen in 10 of the 11 countries included in Table 2–5. The average decline in fertility is slightly less than 1 child per woman, with a range of 1.2 children per woman in Zimbabwe to 0.4 in Ghana. In eight countries, the declines in fertility are statistically significant at the 5 percent level. Uganda is the only country that shows no evidence of a decline.
In reality, the eight cases with statistically significant declines can be split into two groups. Group A includes Kenya, Botswana, and Zimbabwe, where declines in fertility appear to be reasonably certain. The decline in fertility rates in all three countries has been accompanied by an increase in the proportion of women using modern contraception. (See Table 2–6 for current levels of modern contraceptive use.) DHS data in Table 2–5 show
TABLE 2–5 Total Fertility Rate for Women Aged 15–44; Selected Demographic and Health Surveys, 1986–1990
|
|
Total Fertility Ratea |
|
|||
|
Region and Country |
Year of Survey |
0–3 Years Prior to Survey |
4–7 Years Prior to Survey |
Change |
|
|
Absolute |
Percentage |
||||
|
Western |
|
||||
|
Ghana |
1988 |
6.1 |
6.4 |
–0.3 |
–5.8 |
|
Liberia |
1986 |
6.4 |
6.8 |
–0.4 |
–5.9 |
|
Mali |
1987 |
6.8 |
7.7 |
–0 |
–11.2 |
|
Nigeria |
1990 |
5.9 |
6.9 |
–1.0b |
–18.1 |
|
Senegal |
1986 |
6.4 |
7.6 |
–1.2b |
–15.6 |
|
Togo |
1988 |
6.2 |
7.2 |
–1.0b |
–13.3 |
|
Eastern |
|
||||
|
Burundi |
1987 |
6.5 |
7.4 |
–0.9b |
–12.4 |
|
Kenya |
1988–1989 |
6.5 |
7.1 |
–0.6b |
–8.9 |
|
Uganda |
1988–1989 |
7.2 |
7.1 |
+0.1 |
+1.0 |
|
Zimbabwe |
1988–1989 |
5.3 |
6.6 |
–1.3b |
–18.9 |
|
Southern |
|
||||
|
Botswana |
1988 |
4.8 |
5.6 |
–0.8b |
–14.0 |
|
aTo minimize problems caused by the displacement of births, estimates of the total fertility rate have been calculated on the basis of 4-year periods instead of conventional 5-year periods. Because only women aged 15–49 were surveyed, the total fertility rates are restricted to women aged 15–44 to avoid problems of truncation in the period 4–7 years prior to the survey. bRates for the two periods are significantly different at the 5 percent level. SOURCES: Freedman and Blanc (1992); Nigeria (1992). |
|||||
that the group B countries, Burundi, Mali, Nigeria, Senegal, and Togo, also experienced statistically significant declines in fertility; however, these declines have not been accompanied by substantial increases in the median age at marriage, the percentage of women using modern methods of contraception, or a substantial decrease in ideal family size, which might explain the decline in fertility. (See Table 2–6 for most recent estimates.)
Group A: Countries in Which Fertility Declines Have Occurred
Fertility decline has been most dramatic in Kenya, Botswana, and Zimbabwe. In Kenya, fertility rates fell by slightly more than 0.5 child per woman between 1987 and 1989 and by 1.2 children per woman between 1979 and 1989. Overall, the Kenyan DHS results not only indicate that the transition to lower fertility is already under way, but also suggest that it
TABLE 2–6 Key Features of African Fertility: Selected DHS Countries
|
|
Fertility Preferencea |
Modern Contraceptive Use (%)a |
Median Age at First Marriage (women aged 25–49) |
|
|
Region and Country |
Ideal Family Sizeb (number of children) |
Want No More Children (%) |
||
|
Western |
|
|||
|
Ghana |
5.5 |
23 |
4.7 |
18.3c |
|
Liberia |
6.5 |
17 |
7.0 |
17.5 |
|
Mali |
6.9 |
17 |
1.2 |
15.7c |
|
Nigeria |
6.2 |
15 |
3.8 |
16.9 |
|
Senegal |
7.2 |
19 |
2.6 |
16.6c |
|
Togo |
5.6 |
25 |
3.4 |
18.4 |
|
Eastern |
|
|||
|
Burundi |
5.5 |
24 |
1.0 |
19.5 |
|
Kenya |
4.8 |
49 |
14.7 |
18.5c |
|
Uganda |
6.8 |
19 |
2.7 |
17.5c |
|
Zimbabw |
5.4 |
33 |
27.2 |
18.6 |
|
Southern |
|
|||
|
Botswana |
5.4 |
33 |
28.9 |
|
|
aCurrently married women aged 15–49. bExcludes non-numeric responses. cAges 20–49. dAge at first sexual intercourse. SOURCE: Demographic and Health Surveys First Country Reports. |
||||
may accelerate in the future (Cross et al., 1991). Fertility decline has been even more dramatic in Zimbabwe where the DHS-based estimate implies that fertility fell by 1.2 children per woman between 1982–1984 and 1985– 1988. The rate of decline in Zimbabwe is even greater if one accepts the results from the Intercensal Demographic Survey, which yield an estimated TFR of 5.1 for 1987, instead of the DHS estimate of 5.5 for 1985–1988. In Botswana, the DHS-based fertility estimates are 5.9 in 1982–1984 and 4.9 children per woman in 1985–1988. Other sources have yielded considerably higher fertility estimates in Botswana in the recent past: 6.5 in the 1984 Family Health Survey (FHS) and 7.1 in the 1981 census. Comparing the results from the various surveys is difficult, however, because different questions and methods of estimation were used. Furthermore, close comparisons of the DHS and the FHS revealed that the two samples differed appreciably in composition (Thomas and Muvandi, 1992) and that the number of children ever born was inconsistent between surveys, at least for older women (United Nations, 1992). Finally, the estimate of the TFR based on the 1981 census was probably too high, tending to exaggerate the extent of the decline in fertility over the last 10 years (Rutenberg and Diamond, 1993). Nevertheless, the difference in fertility rates between the various sources is too great to be attributable solely to problems of sampling or estimation.
Countries in group A are distinguished from countries in group B by the fact that recorded decreases in fertility have been accompanied by changes in other fertility-related variables. As discussed above, collecting accurate demographic data in sub-Saharan Africa is difficult. Hence, for countries that have a low TFR, it is reassuring to find a low average desire for children, a high use of efficient contraception, and a high median age at first marriage. Table 2–6 summarizes the data on these key indicators. Two crude measures of fertility preference are presented: the mean ideal family size and the proportion of all women who want no more children. Of the women in the 11 populations, only women in Kenya, Botswana, and Zimbabwe considered the mean ideal family size to be fewer than 5 children.5 Among all women in Kenya, the mean ideal number of children fell dramatically from 5.8 in 1984 to 4.4 in 1989 (Kenya, 1989). Also of note is the age pattern of preference in 1989, with women aged 40–44 preferring 5.5 children, women aged 25–29 preferring 4.4, and women aged 15–19
preferring 3.7. Furthermore, compared to women in other countries, women in these three countries were more likely to indicate at the time of the DHS that they did not want additional children. In Kenya, nearly half the married women in the DHS sample reported that they wanted no more children. In Zimbabwe and Botswana, the proportion was closer to one-third.
Another important indicator of women’s fertility intentions is use of contraception. In group A countries, more than 14 percent of married women used some type of modern contraceptive at the time of the DHS. In Botswana, the increase in the number of women using modern contraceptives since 1984 is large enough to account for the observed decline in fertility (van de Walle and Foster, 1990). The level of contraceptive use among married women is even higher in Zimbabwe: Almost all women who were interviewed knew of at least one method of contraception; 93 percent of married women had used contraception at one time; and 36 percent of married women were currently using a modern method. Contraceptive prevalence in Kenya has also increased sharply: 27 percent of married women reported using some method of contraception in 1989, a fourfold increase in use from 1977–1978 levels (Kenya, 1989). Part of the increase in the demand for contraceptives may be the result of women wanting to space children more efficiently rather than wanting to limit family size (van de Walle and Foster, 1990; Caldwell et al., 1992).
Additional information on the nature of the fertility decline in Kenya, Botswana, and Zimbabwe can be obtained from an analysis of birth histories. These histories allow us to describe the family formation process in greater detail. For example, rather than just observing that a woman has had a birth in the last 12 months, birth histories can tell us birth order and the timing between pregnancies. Consequently birth histories enable the researcher to identify changes in fertility behavior that are specific to parity. Because the vast majority of women in Africa marry and have children, changes in fertility behavior between cohorts are most likely to occur after women have had several children. Consequently, a parity-specific investigation of fertility behavior can be a useful way to detect small changes in fertility for a country at the beginning of a transition toward lower fertility (Brass and Juarez, 1983).
Life table techniques provide the best way to analyze birth history data. This approach views the family formation process as a series of steps in which women pass successively through marriage to first births to second births and so on, until they achieve their completed family size. When data are available for a cohort of women who have completed their fertility, parity progression ratios (PPRs) can be calculated directly. For each age cohort, these ratios measure the proportion of women who have had n children and proceed to have an additional child. Because the majority of women included in cross-sectional data sets have not completed their fertil-
ity, it is inappropriate to calculate PPRs. Another measure, analogous to the PPR, is suggested by Rodriguez and Hobcraft (1980). It measures the proportion of women in an age cohort who, having attained an nth birth, go on to an (n+1)th birth within 60 months. This measure is usually called a censored parity progression ratio (CPPR). One advantage of CPPRs over TFRs is that they are robust with respect to the problem of misreported dates of births. As long as the index birth is reported as having occurred within 60 months of the preceding one, the CPPR is unaffected.
Unfortunately, Rodriguez and Hobcraft’s measure is biased because it systematically excludes women with long birth intervals (Brass and Juarez, 1983). A simple adjustment to correct this limitation has been proposed by Brass and Juarez (1983). This variant of the CPPR is reported below and denoted B60. Because no formula exists to calculate the standard errors associated with the B60s, inferences about changes in fertility trends may be drawn only by examining general patterns in the data.
Table 2–7 presents the B60s for Botswana, Kenya, and Zimbabwe. To simplify the table, neighboring parity progression ratios for the same cohort have been combined by multiplying consecutive indices together. The summary measures represent the combined probability of having two additional births, that is, the probability of moving from the nth to the (n+1)th parity within 60 months multiplied by the probability of moving from the (n+1)th to the (n+2)th parity within 60 months of the previous birth.
The B60s reveal the pattern of fertility decline that has occurred in these countries. The most important finding is that there appears to have been a general reduction in fertility across cohorts of women at all parities in the probability of having additional births. In Kenya, the largest decline across cohorts appears to have been among women with seven children. Fewer women who have given birth to seven children now continue to have an eighth and a ninth child. In Botswana, the B60s imply that important reductions in fertility have also occurred at low-order parities (first to third and third to fifth births). In Zimbabwe, the greatest reductions have occurred in the middle-order parities (third to fifth and fifth to seventh parities).
Group B: Countries in Which Fertility May be Declining
Evidence in favor of a fertility decline is not as strong in the other countries exhibiting a decline in Table 2–5, namely, Burundi, Mali, Nigeria, Senegal, and Togo. As shown in Table 2–6, in all five countries the demand for children, as measured by mean ideal family size, remains high; and few married women are currently using modern methods of contraception.
Of the countries in group B, Senegal is the country likeliest to be on the verge of undergoing a decline in fertility. The total fertility rate in Senegal was 7.1 births per woman in 1978, according to WFS data. According to
TABLE 2–7 Cumulated Cohort Parity Progression Ratios: Group A Countries
|
|
Censored Parity Progression Ratios (B60s) by Age Group |
|||
|
Country and Women’s Age |
1–3 |
3–5 |
5–7 |
7–9 |
|
Botswana |
|
|||
|
20–24 |
.308 |
|
||
|
25–29 |
.487 |
.312 |
|
|
|
30–34 |
.604 |
.446 |
.395 |
|
|
35–39 |
.652 |
.549 |
.379 |
.356 |
|
40–44 |
.678 |
.571 |
.480 |
.388 |
|
45–49 |
.644 |
.615 |
.495 |
.505 |
|
Kenya |
|
|||
|
20–24 |
.704 |
|
||
|
25–29 |
.761 |
.675 |
.626 |
|
|
30–34 |
.771 |
.734 |
.547 |
.408 |
|
35–39 |
.794 |
.759 |
.616 |
.504 |
|
40–44 |
.797 |
.772 |
.652 |
.553 |
|
45–49 |
.813 |
.811 |
.650 |
.596 |
|
Zimbabwe |
|
|||
|
20–24 |
.622 |
|
||
|
25–29 |
.664 |
.500 |
.237 |
|
|
30–34 |
.682 |
.598 |
.518 |
.481 |
|
35–39 |
.741 |
.666 |
.559 |
.504 |
|
40–44 |
.733 |
.689 |
.616 |
.560 |
|
45–49 |
.765 |
.709 |
.605 |
.518 |
|
SOURCE: Calculations based on data from the Demographic and Health Surveys. |
||||
the DHS, fertility fell to 6.6 by 1986, and provisional analysis of the recent census suggests it fell further to 6.3 in 1988 (Senegal, 1992). It is important to note, however, that the census and the DHS estimates are based on different kinds of data and different methodologies. The DHS collected detailed birth histories from all women. The census only asked women about the number of births they had in the last 12 months. Unfortunately, the latter approach is particularly susceptible to reporting bias because women tend to omit systematically children that have died or moved away. It has been established that the number of births in the 12 months preceding the census was underestimated (Senegal, 1992). Consequently, part of the difference between the fertility estimates from the DHS and those from the census may be attributable to flaws in the census data. Nevertheless, both the DHS and the census estimates are at least half a child per woman lower than the WFS estimates.
Some support for a decline in fertility in Senegal comes from apparent changes in contraceptive use and marriage patterns. The percentage of women currently using any method of contraception rose from 3.9 in 1978 to 11.4 in 1986. At the same time, there appears to have been an increase in the average age at first marriage among Senegalese women. DHS data indicate that the median age at marriage for women aged 40–44 at the time of the survey was 16.1 years in comparison to 17.2 years for women 20–24, and provisional results from the 1988 census indicate that the average age at first marriage is continuing to rise (Senegal, 1992). Westoff (1992) argues that this change in marriage patterns is sufficient to account for the slight drop in fertility. However, if the decrease in fertility is the result of an increase in the age at first marriage and first birth, then the greatest declines in fertility should have occurred among women in the youngest age groups. A simple comparison of age-specific fertility rates between data from the WFS and the DHS would suggest that changes in fertility have occurred in the youngest ages. The age-specific fertility rates for the two youngest age groups are between 8 and 16 percent lower in the DHS than they were in the WFS, but are virtually identical for the older four age groups. However, this pattern is not confirmed by a detailed internal analysis of the DHS data. These data suggest that fertility levels fell for all cohorts. A comparison of ASFRs for 0–3 and 4–7 years prior to the survey shows that the largest reductions in fertility occurred among women in the older age groups (Arnold and Blanc, 1990). Moreover, inspection of the B60s for Senegal in Table 2– 8 indicates that fertility has fallen most consistently for parities three and higher. These discrepancies prevent Senegal from being placed in group A among countries in which declining fertility is confirmed. Even so, it is probable that at least some part of the observed fertility decline in Senegal is genuine, particularly the portion that results from an increasing age at first marriage.
In Nigeria, the DHS data indicate a decline in fertility of 1.3 children per woman, the largest absolute decline reported for any African country for which DHS data are available. Although some proportion of the decline is certainly genuine, other evidence does not support a decline of this magnitude. First, the use of contraception is extremely limited among Nigerian women. As shown in Table 2–6, only 6.0 percent of married women used any method of contraception in 1990, and only 3.5 percent used modern methods. Furthermore, the proportions of Nigerian women that are married by age 17 and that become mothers by age 20 appear to be stable across cohorts (Nigeria, 1992). On the other hand, the pattern in B60s in the lower parities is consistent with a fertility decline. However, there is evidence to suggest that the number of births in the 5 years preceding the survey was underestimated (Nigeria, 1992).
More detailed analysis of data from Nigeria shows that the national
TABLE 2–8 Cumulated Cohort Parity Progression Ratios: Group B Countries
|
|
Censored Parity Progression Ratios (B60s) by Age Group |
|||
|
Country and Women’s Age |
1–3 |
3–5 |
5–7 |
7–9 |
|
Burundi |
|
|||
|
20–24 |
.826 |
.594 |
|
|
|
25–29 |
.874 |
.782 |
||
|
30–34 |
.825 |
.889 |
.673 |
.687 |
|
35–39 |
.848 |
.786 |
.673 |
.611 |
|
40–44 |
.793 |
.795 |
.655 |
.476 |
|
45–49 |
.789 |
.822 |
.664 |
.559 |
|
Mali |
|
|||
|
20–24 |
.755 |
.580 |
|
|
|
25–29 |
.760 |
.642 |
.676 |
|
|
30–34 |
.761 |
.716 |
.633 |
.525 |
|
35–39 |
.726 |
.695 |
.657 |
.536 |
|
40–44 |
.768 |
.706 |
.701 |
.568 |
|
45–49 |
.670 |
.680 |
.625 |
.643 |
|
Nigeria |
|
|||
|
20–24 |
.606 |
|
||
|
25–29 |
.683 |
.612 |
|
|
|
30–34 |
.730 |
.640 |
.532 |
.517 |
|
35–39 |
.748 |
.671 |
.608 |
.454 |
|
40–44 |
.757 |
.705 |
.624 |
.440 |
|
45–49 |
.776 |
.746 |
.672 |
.573 |
|
Senegal |
|
|||
|
20–24 |
.733 |
|
||
|
25–29 |
.785 |
.646 |
|
|
|
30–34 |
.822 |
.771 |
.731 |
.438 |
|
35–39 |
.804 |
.753 |
.665 |
.482 |
|
40–44 |
.781 |
.755 |
.675 |
.546 |
|
45–49 |
.787 |
.797 |
.631 |
.555 |
|
Togo |
|
|||
|
20–24 |
.699 |
|
||
|
25–29 |
.714 |
.716 |
|
|
|
30–34 |
.771 |
.662 |
.524 |
|
|
35–39 |
.770 |
.728 |
.545 |
.544 |
|
40–44 |
.775 |
.730 |
.600 |
.519 |
|
45–49 |
.821 |
.744 |
.689 |
.514 |
|
SOURCE: Calculations based on data from the Demographic and Health Surveys. |
||||
averages mask very important regional differences in fertility patterns. Table 2–9 highlights the extent of these differences. In southwest and southeast Nigeria, the TFR is less than it is in the northeast and northwest regions, by one child per woman. Furthermore, there is enormous variation in the average age at first marriage and the level of contraceptive use among the regions. In the northeast and the northwest regions, almost half of all women are married by age 15. Marriage occurs later in southeast and southwest Nigeria, where the median age at first marriage is closer to 18 and 20, respectively. Current use of family planning is also much higher in southwest Nigeria, where 15 percent of currently married women were using some method of contraception at the time of the survey, compared with 9 percent in southeast Nigeria and 2 percent or less elsewhere. The contrast in rates of modern contraceptive use between regions is even greater. Therefore, upon closer examination of fertility in Nigeria, it appears that a fertility transition is limited to the southwest (and possibly the southeast) region(s) of the country and is not a country-wide phenomenon. Nonetheless, this transition is significant because this part of Nigeria has a larger total population than most African countries.
The small declines in fertility recorded in Mali, Burundi, and Togo probably should not be interpreted as heralding the onset of a major fertility transition in those countries. A comparison of the total fertility rates in the two reference periods shows fertility falling by less than 1.0 birth per woman in each of these three countries. At the same time, there were considerable problems in the DHS for all three countries with the displacement of births (Arnold, 1990). The most likely explanation for the observed decline in fertility is that the data are flawed in some way.
Mali has an extremely low mean age at first marriage, and more than half of all women report that they were married by age 16, as shown in Table 2–6. The desire for children is greater in Mali than in any of the other countries in sub-Saharan Africa covered by the DHS, and relatively few women want no more children. Only 1.2 percent of currently married women are using efficient contraception. Moreover, there is little evidence of parity-specific reductions in fertility in the B60s. These conditions are inconsistent with the reported decline in fertility. It is not surprising, therefore, to find evidence of a serious displacement of births in Mali. The problem appears particularly acute for children that died and for children whose exact month of birth was not known (Arnold and Blanc, 1990).
Fertility does appear to have fallen in Bamako, the capital of Mali. More than 16 percent of currently married women in Bamako are using some means of contraception, and 6 percent are using a modern method. Elsewhere in Mali, only 4 percent of married women are using any method of contraception, with less than 1 percent using a modern method. It is probably significant that in Bamako, the total fertility rate—an indication of
TABLE 2–9 Fertility and Related Measures in Nigeria, by Region, 1990
|
|
Region |
||||
|
Measure |
Northeast |
Northwest |
Southeast |
Southwest |
Total |
|
Age-specific fertility rates |
|
||||
|
15–19 |
0.224 |
0.194 |
0.106 |
0.074 |
0.146 |
|
20–24 |
0.280 |
0.281 |
0.256 |
0.210 |
0.258 |
|
25–29 |
0.237 |
0.274 |
0.268 |
0.270 |
0.263 |
|
30–34 |
0.221 |
0.229 |
0.220 |
0.211 |
0.220 |
|
35–39 |
0.140 |
0.256 |
0.162 |
0.176 |
0.159 |
|
40–44 |
0.129 |
0.134 |
0.053 |
0.078 |
0.092 |
|
45–49 |
0.075 |
0.061 |
0.050 |
0.073 |
0.064 |
|
Total fertility rate (1990) |
6.5 |
6.6 |
5.6 |
5.5 |
6.0 |
|
Total fertility rate (1981–1982)a |
6.0 |
6.4 |
5.7 |
6.3 |
5.9 |
|
Difference |
+0.5 |
+0.2 |
–0.1 |
–0.8 |
–0.1 |
|
Currently married women using any method of contraception (%) |
2.0 |
1.2 |
8.8 |
15.0 |
6.0 |
|
Using modern method (%) |
1.3 |
0.7 |
3.9 |
10.5 |
3.5 |
|
Median age at first marriage (women 25–49) |
15.2 |
15.4 |
18.3 |
19.7 |
16.9 |
|
Median age at first birth (women 25–49) |
18.8 |
19.5 |
19.6 |
20.5 |
19.7 |
|
aFrom World Fertility Survey. SOURCE: Nigeria (1992:23, 43, 61). |
|||||
fertility at the time of the survey—was considerably lower than the number of children ever born to women aged 40 to 49—an indicator of cumulative fertility in the past (Traoré et al., 1989). However, because of migration, the lifetime fertility of women aged 40–49 does not necessarily reflect cumulative fertility in Bamako.
In Burundi, age at first birth is relatively stable across age cohorts, though quite high by sub-Saharan African standards (Segamba et al., 1988). The DHS recorded very low use of modern contraceptives with only 1 percent of currently married women using a modern method of contraception. The B60s for Burundi provide a final check for any signs of a reduction in fertility that is parity specific, but provide no clear indication of parity-specific reductions in fertility. Hence, the recorded decline in fertility is suspect.
In Togo, the decline in fertility is likely to have been exaggerated by poor data, although a number of indications are consistent with fertility decline. Specifically, contraceptive use, primarily abstinence, is very high; contraceptive awareness is virtually universal (93.5 percent); family planning receives widespread approval (68.9 percent); and recently, there has been a 10 percent decline in the number of women marrying by age 20. However, there is little evidence of a parity-specific reduction in fertility in the B60s for Togo.
Finally, Group B should also include the most recently surveyed DHS countries for which data are not yet completely available. These include Cameroon and Zambia, for which first country reports have been published, and Malawi, Namibia, Niger, and Tanzania, for which only preliminary reports have been released. Because standard recode files are currently unavailable, the interpretation of recent fertility trends for these countries are based solely on the relevant DHS publications. None of these countries is included in Table 2–5 because the relevant DHS publications do not report age-specific fertility rates for 0–3 years and 4–7 years prior to the survey, the intervals indicated for the other populations. Neither do any of the reports discuss the reliability of birth history data. For example, none discusses the extent of misreporting of childrens’ dates of births that in earlier surveys resulted in the appearance of declines in fertility.
The Cameroon report indicates a modest decline in fertility, from 6.4 births per woman in 1978 to 5.8 births per woman in 1991. This latter estimate is very close to the 1987 census estimate of 5.7 births per woman derived using P/F ratios. Nationally, the use of modern contraceptives is very limited (around 4.3 percent among currently married women) and not supportive of a sustained decline in fertility. However, in Douala and Yaoundé, the two largest cities in Cameroon, use of modern contraceptives is much higher (12.1 percent of currently married woman), and the total fertility rate for these two cities is 4.4 births per woman.
In Zambia, the DHS reports that the TFR of 6.5 children per woman is down approximately 10 percent from the (heavily adjusted) figure obtained from the 1980 census. Contraceptive prevalence stands at approximately 9 percent nationally, 15 percent in urban areas, and 3 percent in rural areas. At least part of the observed decline in fertility may be the result of a trend towards later age at first marriage among younger women (Zambia, 1993:60), but comparisons of age-specific fertility rates between the DHS and the census figures show that most of the decline in fertility appears to have occurred for women aged 25–39 and not in the age group 15–19 as might be expected. Hence, the conclusion that fertility is falling in Zambia is tentative and further assessment of these newest data is warranted when they become available.
Recent data from the Malawi DHS proved the most difficult to interpret. Until 1984, estimates of the TFR in Malawi were thought to be fairly reliable. Fertility rates appear to have changed little in the late 1970s and early 1980s in Malawi, and three independent sources—the 1977 census, the 1982 Demographic Survey, and the 1984 Family Formation Survey— were all in close agreement that the TFR stood between 7.6 and 7.7 births per woman (Malawi, 1980, 1987a,b).
Data from the 1987 census, however, showed an unadjusted TFR of 5.7 births per woman (National Statistical Office, Zomba, personal communication, 1992). This is almost certainly a gross underestimate, perhaps because the information was not necessarily supplied by the woman who bore the children. By applying a P/F adjustment, the TFR was revised to 8.0 births per woman (Table 2–1), a considerable difference from the unadjusted figure but not out of line with some expectations (see for example, House and Zimalirana, 1992:144). Consequently, the DHS preliminary estimate of the TFR, 6.7 children per woman, is a surprise, being substantially lower than the adjusted census figure and even below the mean number of children ever born to women aged 40–49 in both the 1987 census and the 1992 DHS. (When fertility is not changing, the number of children ever born is generally lower than the unadjusted total fertility rate because older women tend to systematically omit certain births.) However, 1990 and 1992 were drought years, which may have affected behavior over the short term. And the recent massive AIDS-prevention campaign may have achieved lower fertility through increased use of condoms, especially outside of sanctioned unions.
If all these estimates are correct, then the conclusion would be that fertility has fallen only in the last 3 or 4 years. Two qualifications apply. First, as stated above, adjusting the period fertility rates from the 1987 census on the basis of a comparison of P/F ratios is only valid if fertility has been approximately constant over the recent past. If fertility declined before 1987, then cumulated period rates cannot be expected to equal lifetime
fertility, and the P/F ratios method would produce biased estimates of the true period rates.
Second, it should be possible to verify a recent decline in fertility rates by comparing mean numbers of children ever born by age groups across recent data sources. By imagining that the data were obtained from a single hypothetical cohort of women rather than from two independent samples, one can obtain an indirect estimate of the level of fertility. For example, if two surveys are exactly 5 years apart, women aged 15–19 in the first survey would be aged 20–24 in the second survey, and the incremental change in children ever born between these two groups would provide an estimate of the level of fertility between the two surveys. Applying this method to the recent data from Malawi produces an estimate of TFR of 6.8 births per woman for the intersurvey period. On the surface this estimate is quite consistent with the DHS figure, but actually the two methods yield quite different age-specific fertility schedules. Fertility probably fell in Malawi over the period 1987–1992, but more work will be needed to reconcile the various data sources when the DHS data are finally released.
Namibia gained its independence from South Africa in 1990, and conducted a national census in 1991 and a DHS in 1992. Unfortunately, results from the 1991 census are not yet available, but preliminary results from the DHS suggest that the national fertility rate for the years 1989–1992 was 5.6 births per woman. As with Nigeria, there are large differences in fertility levels across regions, from 6.4 children per woman in the Northwest region to 4.1 children per woman in the more urbanized Central/South region, which contains the capital, Windhoek. Differences in the use of modern contraceptives are also striking across regions, from 7 percent in the Northwest to 45 percent in the Central/South region.
In Niger, preliminary results indicate that there has been little or no change in fertility between the 1992 DHS and the 1988 census. Contraceptive prevalence rates are also extremely low. Despite reasonable levels of contraceptive awareness, only 4 percent of currently married women reported that they were currently using either a modern or a traditional method of contraception. Only in the capital, Niamey, are there any signs of a fertility reduction. In Niamey, the TFR was estimated to be 5.9 births per woman, compared with 7.2 births per woman for other urban areas and 7.5 births per woman for rural areas.
Preliminary data from the DHS in Tanzania indicate that the TFR stands at approximately 6.3 births per woman. This figure represents a slight decline from the 1988 census estimate of 6.5 children per woman. There also appear to be large urban-rural differences in fertility rates: for example, in the capital of Dar es Salaam, fertility is 4.0 children per woman, and 25 percent of currently married women are using modern means of contraception. More generally, however, the percentage of women using
modern methods of contraception remains low. Perhaps the most intriguing finding is that modern contraceptive use is highest in Kilimanjaro and Arusha, two districts that border on Kenya. Here, 25 and 12 percent, respectively, of currently married women are using a modern method of contraception. These figures are higher than for Dar es Salaam (11 percent) and quite comparable to some districts in Kenya in 1989. These two regions of Tanzania are more densely populated and more economically developed than most of the rest of the country. Consequently, one explanation for the relatively high levels of contraceptive use is that the special socioeconomic and demographic characteristics of the area make it more amenable to the introduction of modern family planning. Alternatively, the proximity of these two regions to the Kenyan border perhaps suggests that there is a diffusion of ideas about ideal family size spreading from the north.
COMPARISON OF RECENT FERTILITY TRENDS IN AFRICA AND OTHER DEVELOPING REGIONS
Fertility patterns in most African and Asian countries were very similar in the 1960s.6 As shown in Table 2–10, the total fertility rate in sub-Saharan Africa in 1965 was estimated to be 6.6 children per woman, only slightly higher than average for low- and middle-income countries. By 1989, fertility levels in developing countries varied markedly, but almost all regions had experienced some fertility decline. In East Asia, fertility fell by more than 50 percent, from 6.2 in 1965 to 2.7 in 1989. In Latin America, a decline in fertility probably began in the mid-1960s and resulted in a 40 percent decline by 1989. In South Asia, the decline was approximately 30 percent, from 6.3 to 4.4 births per woman.
Sub-Saharan Africa is the only major region of the developing world that has not yet undergone a general decline in fertility. The question arises: Is Africa more resistant to a change in fertility than elsewhere? This question is of enormous concern to population planners and policymakers, and has sparked a considerable amount of debate and controversy. Two distinct positions have emerged. In the past, Caldwell and Caldwell (1987, 1988) argued that even if Africa were to achieve levels of general development that exist elsewhere, the decline in fertility would continue to lag. This argument stresses the importance of both cultural and economic factors as determinants of fertility (Caldwell and Caldwell, 1987:416–417):7
High fertility (and a considerable number of surviving children) is associated with joy, the right life, divine approval, and approbation by both living and dead ancestors…. African parents almost certainly receive larger and more certain rewards from reproduction than do parents in any other society, and these upward wealth flows are guaranteed by interwoven social and religious sanctions.
Alternatively, the World Bank (1986:12–13) argues that the high fertility rates observed in Africa are not entirely unexpected because much of the rest of the world is relatively more developed:
The strength of traditional pronatalist attitudes in much of sub-Saharan Africa raises the question of whether they are unique to Africa or parts of Africa. The answer is, probably not. First, incomes are generally lower than in other countries, levels of education and health levels are poorer, and urbanization is less extensive…Second, much of the progress that has occurred in Africa…is so recent that old attitudes have had little time to change. Third, although traditional beliefs—for example, that having children allows ancestors to be “reborn” —reinforce pronatalist attitudes in much of Africa, such beliefs are not unique to Africa.
Is the fertility decline observed in Africa in line with other countries’ experience, or is Africa more resistant to fertility change? The 1986 World Bank report identifies several key areas in which sub-Saharan Africa lags behind the rest of the world. These include slower progress in the areas of education and health care, and lower rates of urbanization and industrialization. Table 2–10 presents various summary statistics demonstrating the progress that sub-Saharan Africa and other regions have made in these areas over the past 25 years.
In the past 25 years, the percentage increase in the proportion of children enrolled in school has been larger in sub-Saharan Africa than in any other region of the world. The proportion of females enrolled in primary education rose 94 percent, while the proportion enrolled in secondary education rose a staggering 600 percent.8 In absolute terms, however, the level of primary education in sub-Saharan Africa in 1989 is roughly equal to the levels in most other regions of the world in 1965. Although fertility in sub-Saharan Africa may appear less responsive to changes in enrollment in primary and secondary education than elsewhere (van de Walle and Foster, 1990; Adamchak and Ntseane, 1992), it is important to remember that fertility is likely to respond to changing levels of education only after a lag,
TABLE 2–10 Summary Indicators of Socioeconomic Development
|
Indicator |
Low- and Middle-Income Countries |
Sub-Saharan Africa |
East Asia |
South Asia |
Latin America and Caribbean |
|
Total fertility rate |
|
||||
|
1965 |
6.1 |
6.6 |
6.2 |
6.3 |
5.8 |
|
1989 |
3.9 |
6.6 |
2.7 |
4.4 |
3.5 |
|
Change (%) |
–36 |
0 |
–56 |
–30 |
–40 |
|
Percentage of age group enrolled in primary education (females only) |
|
||||
|
1965 |
63 |
31 |
– |
52 |
96 |
|
1988 |
97 |
60 |
123 |
76 |
108 |
|
Change (%) |
+54 |
+94 |
– |
+46 |
+13 |
|
Percentage of age group enrolled in secondary education (females only) |
|
||||
|
1965 |
14 |
2 |
– |
12 |
19 |
|
1988 |
36 |
14 |
41 |
26 |
55 |
|
Change (%) |
+157 |
+600 |
– |
+117 |
+189 |
|
GNP per capita |
|
||||
|
1965a |
439 |
316 |
155 |
208 |
1,236 |
|
1989 |
800 |
340 |
540 |
320 |
1,950 |
|
Change (%) |
+82 |
+8 |
+248 |
+54 |
+58 |
|
Infant mortality rate |
|
||||
|
1965 |
117 |
157 |
95 |
147 |
94 |
|
1989 |
65 |
107 |
35 |
95 |
50 |
|
Change (%) |
–44 |
–32 |
–63 |
–35 |
–47 |
and declines in fertility outside Africa did not occur at the levels of education currently found in Africa.
Table 2–10 also shows that the infant mortality rate (IMR) in 1965 was higher in sub-Saharan Africa than in any of the other broad regions represented in the table. Furthermore, the decline in the IMR was slowest in Africa. By 1989, the level of infant mortality in Africa was comparable to levels experienced by other regions in the mid-1960s. In Africa, fertility has not responded to the decline in mortality, perhaps because it is too recent and parents are not aware of it or are not convinced it is sustainable.
Finally, there was virtually no increase in gross national product (GNP) per capita in sub-Saharan Africa during 1965–1989. Following a brief period of economic growth in the 1970s, most African economies have experienced a gradual deterioration. The World Bank (1989) identified three distinct economic periods in contemporary African history: 1961–1972, a period of growth in per capita income; 1973–1980, a period of general stagnation; and 1981–1987, a period of general decline. There are exceptions to this generalization, most notably in Botswana and, to a lesser extent, in Cameroon, Congo, and Lesotho, where per capita incomes have risen consistently over the past 25 years. For the most part, however, African economies have faltered. Poor industrial and agricultural performance, falling commodity prices, declining exports, mounting debt, and increasing environmental degradation have all contributed to a deepening crisis (World Bank, 1989).
Figure 2–5 shows the relationship between the total fertility rate and GNP per capita. The figure includes data pooled from 1965 and 1989 so there are two points for each country. The figure includes data from each of the low- and middle-income countries (i.e., countries with a level of GNP per capita of less than $5,350 in 1989) for which data are available, with data points both for countries in Africa and for other developing countries.
Ordinary least squares regression methods were used to estimate two separate lines, one for African data points and the other for all other regions combined. The slope of the African line is less than the slope of the line representing the other countries. A formal statistical test was used to determine that there is a significant difference between the slopes of the two lines. Although cross-sectional data of this sort are not well suited to modeling change, the more gradual slope of the African line suggests that fertility in Africa may be less responsive to changes in GNP per capita than it is in other developing countries. Therefore, the graph provides some support for the Caldwells’ assertion that African fertility is more resistant to change. On the other hand, sub-Saharan Africa is only now approaching the development levels of the other regions in 1965, and sophisticated econometric techniques are required to control simultaneously for variations in GNP per capita, infant mortality rates, and primary and secondary school enrolment

FIGURE 2–5 Total fertility rates (TFR) by gross national product (GNP) per capita.
NOTE: Δ: African countries; +: other developing countries.
rates across countries. Once these controls are introduced, Africa no longer exhibits a slower fertility response to changes in GNP per capita (Working Group on Factors Affecting Contraceptive Use, 1993). Overall, it is probably too early to tell whether a major decline in fertility is likely to occur more or less slowly in Africa than elsewhere.
CONCLUSIONS
This chapter has presented a descriptive picture of childbearing in sub-Saharan Africa. It is clear that most countries in Africa began to experience a decline in mortality in the 1950s and 1960s (see Chapter 5), but the region has yet to experience a similar general decline in fertility. Consequently, the population growth rate is high, with the population of sub-Saharan Africa expected to double within the next 22–23 years.9 One overriding ques-
tion now faces African demographers: When and through what mechanisms is a general decline in fertility likely to occur?
Together, the Demographic and Health Surveys represent the biggest single data collection effort ever to be undertaken in sub-Saharan Africa, and birth histories have already been collected from more than 90,000 women. Attempting to identify the start of an African fertility transition has been one of the most important contributions of the DHS. At face value, DHS data imply that fertility is declining across much of Africa. However, this conclusion is not always supported by other related patterns of behavior (i.e., later marriage, increased contraceptive use, and lower fertility preferences) or by in-depth analysis of birth histories. Kenya, Botswana, Zimbabwe, parts of Nigeria, and, possibly, Senegal comprise the vanguard of the decline. In none of the above cases has fertility fallen to a level that would imply a zero rate of population growth (that is, a level that would just replace the existing population). Nonetheless, the reductions in fertility rates are important and may herald the onset of the fertility transition that at some point will stretch across the entire continent. What is particularly intriguing about these fertility declines, however, is not only that they are the first to have taken place, but also that they have arisen through changes in different proximate determinants. In the first four cases, fertility decline appears to be associated with an increase in the use of contraception. In Senegal, the decline appears associated with a trend toward later marriage.
DHS data also indicate that there are substantial differences in fertility by urban-rural residence and level of education even in countries whose national-level statistics do not indicate that a substantial decline in fertility has occurred. However, the absolute level of fertility in urban areas and among more educated women often remains high. There is also considerable overlap between the two groups so that the total contribution to fertility decline, so far, is small.
Despite the increase in information available from sample surveys and censuses, there is still a shortage of reliable data on fertility rates for many countries in Africa. There is no tradition of accurate data collection in the region, and vital registration statistics are unavailable. Given the resource constraints facing most governments, the instability of political regimes in the region, and the large-scale movements of many refugees across the continent as a result of drought, famine, or low-intensity warfare, the immediate prospects for accurate data collection are extremely poor. Censuses have provided the majority of the information on fertility rates, but censuses have been plagued frequently by problems that have resulted in incomplete or inaccurate coverage. In other cases, census counts were not published because they were politically unacceptable (the 1983 Guinea Census), too unreliable (the census of Nigeria in 1973), or simply lost due to conflict (Uganda in 1980, Liberia in 1984, and Somalia in 1986). Survey data from the region are thought to be reasonably reliable; yet despite WFS and DHS
efforts to ensure data quality, careful analysis has revealed significant inaccuracies. In addition, many countries in Africa have not been surveyed recently. The need for accurate and timely demographic data on fertility levels and trends for many African countries is still urgent.
REFERENCES
Adamchak, D.J., and P.G.Ntseane 1992 Gender, education, and fertility: A cross-national analysis of sub-Saharan African nations. Sociological Spectrum 12:167–182.
Agounké, A., M.Assogba, and K.Anipah 1989 Enquête Démographique et de Santé au Togo 1988. Lomé: Unité de Recherche Démographique, Direction de la Statistique; Columbia, Md.: Institute for Resource Development/Westinghouse.
Ahonzo, E., B.Barrere, and P.Kopylov 1984 Population de la Côte d’Ivoire: Analyse des Données Démographiques Disponsibles. Abijan. Ministère de l’Economic et des Finances, Direction de la Statistique.
Angola No date Boletim Demográfico. No. 10. Fecundidade e Mortalidade das provincias de Cabinda e do Zaire, Censo 1984. Luanda: Instituto Nacional de Estatistica.
Arnold, F. 1990 Assessment of the quality of birth history data in the Demographic and Health Surveys. Pp. 83–111 in An Assessment of DHS-I Data Quality. Demographic and Health Surveys Methodological Reports No. 1. Columbia, Md.: Institute for Resource Development/Westinghouse.
Arnold, F., and A.K.Blanc 1990 Fertility trends and levels. Demographic and Health Surveys Comparative Studies 2: Fertility. Columbia, Md.: Institute for Resource Development/Westinghouse.
Balepa, M., M.Fotso, and B.Barrière 1992 Demographic and Health Survey 1991. Yaoundé: National Department of the Second Population Census; Columbia, Md.: Institute for Resource Development/ Westinghouse.
Barampanze, G. 1991 Population Burundaise. Cahiers demographiques du Burundi, No. 2. Bujumbura: Premier Ministère et Ministère du Plan, Secrétariat d’Etat au Plan.
Benin 1988 Enquête sur la Fécondité au Benin, 1982. Rapport National. Tome I: Analyse des Principaux Résultats. Cotonou: Ministère du Plan et de la Statistique.
Blacker, J., B.Zaba, and K.Moser 1979 Fertility trends in Kenya 1962–1978—A reassessment. Unpublished report, Centre for Population Studies, Lond School of Hygiene and Tropical Medicine.
Blanc, A.K., and N.Rutenberg 1990 Assessment of the quality of data on age at first sexual intercourse, age at first marriage, and age at first birth in the Demographic and Health Surveys. Pp. 41–79 in An Assessment of DHS-I Data Quality. Demographic and Health Surveys Methodological Reports No. 1. Columbia, Md.: Institute for Resource Development/ Westinghouse.
Bongaarts, J., and R.G.Potter 1983 Fertility, Biology, and Behavior: An Analysis of the Proximate Determinants. New York: Academic Press.
Bongaarts, J., O.Frank, and R.Lesthaeghe 1990 The proximate determinants of fertility. Pp. 133–143 in G.T.F.Acsadi, G.Johnson-Acsadi, and R.A.Bulatao, eds., Population Growth and Reproduction in Sub-Saharan Africa: Technical Analyses of Fertility and Its Consequences. Washington D.C.: The World Bank.
Boserup, E. 1985 Economic and demographic interrerlationships in sub-Saharan Africa. Population and Development Review 11(3):383–397.
Brass, W., and F.Juarez 1983 Censored cohort parity progresion ratios from birth histories. Asian and Pacific Census Forum 10(1):5–13.
Brass, W., A.J. Coale, P.Demeny, D.F.Heisel, F.Lorimer, A.Romaniuk, and E.van de Walle 1968 The Demography of Tropical Africa. Princeton, N.J.: Princeton University Press
Burkina Faso No date Deuxième Recensement Général de la Population du 10 au 20 Décembre, 1985. Principales Données Définitives. Ouagadougou: Ministère du Plan et de la Cooperation.
Burundi 1966 Enquête Démographique, 1965. Bujumbura: Royaume du Burundi.
1972 Enquête Démographique, Burundi, 1970–71. Methodologie, Résultats Provisoires. Bujumbura: Département de Statistiques.
Caldwell, J.C., and P.Caldwell 1977 The role of marital sexual abstinence in determining fertility: A study of the Yoruba in Nigeria. Population Studies 31(2):193–217.
1987 The cultural context of high fertility in sub-Saharan Africa. Population and Development Review 13(3):409–437.
1988 Is the Asian family planning program model suited to Africa? Studies in Family Planning 19(1):19–28.
1990 Cultural forces tending to sustain high fertility. Pp. 199–214 in G.T.F.Acsadi, G. Johnson-Acsadi, R.A.Bulatao, eds., Population Growth and Reproduction in Sub-Saharan Africa: Technical Analyses of Fertility and Its Consequences. Washington, D.C.: The World Bank.
1993 The South African fertility decline. Population and Development Review 19(2).
Caldwell, J.C., P.Caldwell, and P.Quiggin 1989 The social context of AIDS in sub-Saharan Africa. Population and Development Review 15(2):185–234.
Caldwell, J.C., I.O.Orubuloye, and P.Caldwell 1992 Fertility decline in Africa: A new type of transition. Population and Development Review 18(2):211–242.
Cameroon 1983 The Cameroon Fertility Survey, 1978: A Summary of Findings. London: World Fertility Survey.
Central African Republic 1964 Enquête Démographique en République Centrafricaine, 1959–1960. Résultats Définitifs. Paris: Institut National de la Statistique et des Etudes Economiques.
1987 Recensement Général de la Population—1975. Analyse Abregée. Bangui: Direction Générale de la Statistique et des Etudes Economiques.
Chieh-Johnson, D., A.R.Cross, A.A.Way, and J.M.Sullivan 1988 Liberia Demographic and Health Survey, 1986. Monrovia: Bureau of Statistics, Ministry of Planning and Economic Affairs; Columbia, Md.: Institute for Resource Development/Westinghouse.
Chimere-Dan, O. 1993 Population policy in South Africa. Studies in Family Planning 24(1):31–39.
Coale, A.J. 1981 Robust estimation of fertility by the use of model stable populations. Asian and Pacific Census Forum 8(2):5–7.
Cochrane, S.H. 1979 Fertility and Education: What Do We Really Know? World Bank Staff Occasional Paper Number 26. Washington, D.C.: The World Bank.
Cochrane, S.H., and S.M.Farid 1989 Fertility in Sub-Saharan Africa, Analysis and Explanation. World Bank Discussion Paper Number 43. Washington, D.C.: The World Bank.
Congo 1965 Enquuête Démographique, 1960–1961. Résultats Définitifs. Paris: Institut National de la Statistique et des Etudes Economiques.
1978 Recensement Général de la Population du Congo, 1974. Tome IV: Tableaux Statistiques Détaillés . Brazzaville: Direction des Statistiques Démographiques et Sociales.
1987 Recensement Général de la Population et de l’Habitat de 1984. Tome 1: Ensemble du pays. Brazzaville: Bureau Central du Recensement.
Cross, A.R., W.Obungu, and P.Kizito 1991 Evidence of a transition to lower fertility in Kenya. International Family Planning Perspectives 17(1):4–6.
de Graft-Johnson, K.T. 1988 Demographic data collection in Africa. Pp. 13–28 in E.van de Walle, P.O.Ohadike, and M.D.Saka-Diakanda, eds., The State of African Demography. Liège: International Union for the Scientific Study of Population.
Equatorial Guinea 1991 Censo de Guinea Ecuatorial de 1983. Analisis de la Fecundidad. Malabo: Ministerio de Economia, Comercio y Planificación.
Ethiopia 1971 Population of Ethiopia: Results from the National Sample Survey 1st Round, 1964–1967. Statistical Bulletin No. 6. Addis Ababa: Central Statistical Office.
1974 The Demography of Ethiopia: Results of the National Sample Survey Second Round, Vol. 1. Statistical Bulletin No. 10. Addis Ababa: Central Statistical Office.
1991a The 1984 Population and Housing Census of Ethiopia. Analytical Report at National Level. Addis Ababa: Transitional Government of Ethiopia, Office of the Population and Census Commission.
1991b The 1990 Family and Formation Survey. Prelimary Report. Addis Ababa: Central Statistical Authority, Population Analyses and Studies Center.
Ewbank, D.C. 1979 Fertility estimation. Pp. 70–93 in R.A.Henin, ed., The Demography of Tanzania: An Analysis of the 1973 National Demographic Survey of Tanzania, Vol. IV. Dar es Salaam: Bureau of Statistics, Ministry of Finance and Planning and the Demographic Unit, Bureau of Resource Assessment and Land Use Planning, Univeristy of Dar es Salaam, United Republic of Tanzania.
Frank, O. 1983 Infertility in sub-Saharan Africa: Estimates and implications. Population and Development Review 9(1):137–144.
1987 The demand for fertility control in sub-Saharan Africa. Studies in Family Planning 18(4):181–201.
Freedman, R. 1992 Issues about fertility and family planning in South Africa. Report on a visit, October 25-November 24, 1992. Unpublished manuscript. Population Studies Center, University of Michigan, Ann Arbor.
Freedman, R., and A.K.Blanc 1992 Fertility transition: An update. International Family Planning Perspectives 18(2):44– 50.
Gabon 1965 Recensement et Enquête Démographiques, 1960–1961; Ensemble du Gabon. Résultats Définitifs. Paris: Institut National de la Statistique et des Etudes Economiques.
Gaisie, K., A.R.Cross, and G.Nsamukila 1993 Demographic and Health Survey 1992. Lusaka: University of Zambia and Central Statistical Office; Columbia, Md.: Macro International, Inc.
The Gambia 1976 Population Census, 1973. Statistics for Local Government Areas and Districts, Vol. III: General Report. Banjul: Central Statistics Division, Ministry of Economic Planning and Industrial Development.
1987 Population and Housing Census, 1983: General Report, Vol. I: Administrative and Analytical Procedures. Banjul: Central Statistics Division, Ministry of Economic Planning and Industrial Development.
Ghana No date 1984 Population Census of Ghana: Demographic and Economic Characteristics. Accra: Ghana Statistical Service.
1989 Ghana Demographic and Health Survey 1988. Accra: Ghana Statistical Service; Columbia, Md.: Institute for Resource Development/Westinghouse.
Haaga, J.G. 1989 Mechanisms for the association of maternal age, parity, and birth spacing with infant health. Pp. 96–139 in A.M.Parnell, ed., Contraceptive Use and Controlled Fertility: Health Issues for Women and Children: Background Papers. Washington, D.C.: National Academy Press.
Hill, A.L.L. 1985 The Demography of Zambia. Population, Health and Nutrition Department Technical Note, 85–9. Washington D.C.: The World Bank.
House, W.J., and G.Zimalirana 1992 Rapid population growth and poverty generation in Malawi. Journal of Modern African Studies 30(1):141–161.
Institute for Resource Development 1990 An Assessment of DHS-I Data Quality. Demographic and Health Surveys Methodological Reports No. 1. Columbia, Md.: Institute for Resource Development/ Macro Systems, Inc.
Kaijuka, E.M., E.Z.A.Kaija, A.R.Cross, and E.Loaiza 1989 Uganda Demographic and Health Survey, 1988/1989. Entebbe: Ministry of Health; Columbia, Md.: Institute for Resource Development/Westinghouse.
Kenya 1980 Kenya Fertility Survey, 1977–78. Nairobi: Central Bureau of Statistics, Ministry of Planning and National Development. London: World Fertility Survey.
1984 Kenya Contraceptive Prevalence Survey, 1984. First Report. Nairobi: Central Bureau of Statistics, Ministry of Planning and National Development.
1989 Kenya Demographic and Health Survey 1989. Nairobi: National Council for Population and Development, Ministry of Home Affairs and National Heritage; Columbia, Md.: Institute for Resource Development/Westinghouse.
Keyfitz, N. 1977 Introduction to the Mathematics of Population. Reading, Mass.: Addison-Wesley Publishing Company.
Kidane, A. 1990 Regional variation in fertility, mortality and population growth in Ethiopia, 1970– 1981. Genus 66(1,2):195–206.
Lesetedi, L.T., G.D.Mompati, P.Khulumani, G.N.Lesetedi, and N.Rutenberg 1989 Botswana Family Health Survey II 1988. Gaborone: Central Statistics Office, Ministry of Finance and Development Planning, and Family Health Division, Ministry of Health; Columbia, Md.: Institute for Resource Development/Westinghouse.
Lesotho 1991 1986 Population Census Statistical Tables, Vol. II. Maseru: Bureau of Statistics.
Lesthaeghe, R.J., ed. 1989 Reproduction and Social Organization in Sub-Saharan Africa. Berkeley: University of California Press.
Lesthaeghe, R.J., I.Shah, and H.Page 1981 On the compensating effects of changes in the proximate determinants of fertility. Pp. 71–94 in International Union of the Scientific Study of Population Conference Volume, Manila, 1981. Liège: International Union of the Scientific Study of Population.
Liberia No date 1984 Population and Housing Census. Summary Population Results. Monrovia: Bureau of Statistics, Ministry of Planning and Economic Affairs.
Lopez-Escartin, N. 1991a Données de Base sur la Population: Cameroun. CEPED working paper No. 1. Paris: Centre Français sur la Population et le Développement (CEPED).
1991b Données de Base sur la Population: Madagascar. CEPED working paper No. 2. Paris: Centre Français sur la Population et le Développement (CEPED).
1991c Données de Base sur la Population: Gabon. CEPED working paper No. 3. Paris: Centre Français sur la Population et le Développement (CEPED).
1991d Données de Base sur la Population: Togo. CEPED working paper No. 4. Paris: Centre Français sur la Population et le Développement (CEPED).
1991e Données de Base sur la Population: Congo. CEPED working paper No. 8. Paris: Centre Français sur la Population et le Développement (CEPED).
1992a Données de Base sur la Population: Mali. CEPED working paper No. 13. Paris: Centre Français sur la Population et le Développement (CEPED).
1992b Données de Base sur la Population: Mauritanie. CEPED working paper No. 14. Paris: Centre Français sur la Population et le Développement (CEPED).
1992c Données de Base sur la Population: Centrafrique. CEPED working paper No. 16—Version provisoire. Paris: Centre Français sur la Population et le Développement (CEPED).
1992d Données de Base sur la Population: Angola. CEPED working paper No. 17— Version provisoire. Paris: Centre Français sur la Population et le Développement (CEPED).
1992e Données de Base sur la Population: Cote D’Ivoire. CEPED working paper No. 18—Version provisoire. Paris: Centre Français sur la Population et le Développement (CEPED).
1992f Données de Base sur la Population: Zaire. CEPED working paper No. 19— Version provisoire. Paris: Centre Français sur la Population et le Développement (CEPED).
Malawi No date Malawi Population and Housing Census, 1987. Preliminary report. Zomba: National Statistical Office.
1980 Malawi Population Census, 1977. Zomba: National Statistical Office.
1987a Malawi Demographic Survey, 1982. Zomba: National Statistical Office.
1987b Malawi Family Formation Survey, 1984. Vol. II: Fertility, Family Size Preferences and Child Spacing. Zomba: Ministry of Health.
1991 Population and Housing Census, 1987: Summary of Final Results. Zomba: National Statistical Office.
1993 Malawi Demographic and Health Survey 1992: Preliminary Report. Columbia, Md.: Macro International, Inc.
Manyeneng, W.G., P.Khulumani, M.K.Larson, and A.A.Way 1985 Botswana Family Health Survey 1984. Columbia, Md.: Westinghouse Public Applied Systems.
Mhloyi, M.M. 1988 The determinants of fertility in Africa under modernization. Pp. 2.3.1–2.3.22 in African Population Conference, Dakar, 1988, Vol. 1. Liège: International Union for the Scientific Study of Population.
Mostert, W.P. 1990 Recent trends in fertility in South Africa. Pp. 63–73 in W.P.Mostert and J.M. Lötter, eds., South Africa’s Demographic Future. Pretoria: Human Sciences Research Council.
Namibia 1992 Namibia Demographic and Health Survey 1992. Preliminary Report. Niamey: Ministry of Health and Social Services, and Central Statistical Office, National Planning Commission; Columbia, Md.: Macro International, Inc.
Ndiaye, S., I.Sarr, and M.Ayad 1988 Enquôte Démographique et de Santé au Sénégal 1986. Dakar: Ministère de l’Economie et des Finances, Direction de la Statistique; Columbia, Md.: Institute for Resource Development/Westinghouse.
Niger 1992a Recensement Général de la Population 1988: Analyse des Données Définitives. Rapport de Synthèse. Niamey: Ministère de l’Economie et des Finances, Bureau Central du Recensement.
1992b Enquête Démographique et de Santé, Niger 1992. Rapport Préliminaire. Niamey: Direction de la Statistique et des Comptes Nationaux, Ministère des Finances et du Plan; Columbia, Md.: Macro International, Inc.
Nigeria 1992 Nigeria Demographic and Health Survey 1990. Lagos: Federal Office of Statistics; Columbia, Md.: Institute for Resource Development/Westinghouse.
Page, H.J. 1988 Fertility and family planning in sub-Saharan Africa. Pp. 29–45 in E.van de Walle, P.O.Ohadike, and M.D.Sala-Diakanda, eds., The State of African Demography. Liège: International Union for the Scientific Study of Population.
Page, H.J., and A.J.Coale 1972 Fertility and child mortality south of the Sahara. In S.H.Ominde and C.N.Ejiogu, eds., Population Growth and Economic Development in Africa. London: Heinemann Press.
Page, H.J., and R.Lesthaeghe, eds. 1981 Child-Spacing in Tropical Africa: Tradition and Change. London: Academic Press.
Population Reference Bureau 1992 Adolescent Women in Sub-Saharan Africa. Washington, D.C.: Population Reference Bureau.
Potter, J.E. 1977 Problems in using birth-history analysis to estimate trends in fertility. Population Studies 31(2):335–364.
Preston, S.H. 1983 An integrated system for demographic estimation from two age distributions. Demography 20(2):213–226.
Rodriguez, G., and J.N.Hobcraft 1980 Illustrative analysis: Life table analysis of birth intervals in Columbia. In World Fertility Survey Scientific Reports. Number 16. London: International Statistical Institute.
Rutenberg, N., and I.Diamond 1993 Fertility in Botswana: The recent decline and future prospects. Demography 30(2):143–157.
Rutstein, S.O., and G.T.Bicego 1990 Assessment of the quality of data used to ascertain eligibility and age in the Demographic and Health Surveys. Pp. 5–37 in An Assessment of DHS-I Data. Demographic and Health Surveys Methodological Reports No. 1. Columbia, Md.: Institute for Resource Development/Macro Systems, Inc.
Rwanda No date Enquête Nationale sur la Fécondité 1983. Tome I: Analyse des Résultats. Kigali: Bureau National de Recensement.
1973 Enquête Démographique, 1970. Kigali: Office Général des Statistiques.
1984 Recensement Général de la Population et de l’Habitat, 1978. Tome III: Fécondité— Mortalité. Kigali: Bureau National de Recensement.
Schoenmaeckers, R., I.H.Shah, R.Lesthaeghe, and O.Tambashe 1981 The child-spacing tradition and the postpartum taboo in tropical Africa: Anthropological evidence. Pp. 25–71 in H.J.Page and R.Lesthaeghe, eds., Child-Spacing in Tropical Africa: Traditions and Change. London: Academic Press.
Segamba, L., V.Ndikumasabo, C.Makinson and M.Ayad 1988 Enquête Démographique et de Santé au Burundi 1987. Gitega, Burundi: Ministère de l’Intérieur, Département de la Population; Columbia, Md.: Institute for Resource Development/Westinghouse.
Senegal 1988 Situation Economique. Dakar: Republique du Sénégal.
1992 Niveaux et Tendances de la Fécondité. Dakar: Direction de la Statistique.
Singh, S., J.Y.Owusu, and I.H.Shah, eds. 1985 Demographic Patterns in Ghana: Evidence from the Ghana Fertility Survey, 1979–80. London: World Fertility Survey.
Smith, D.P., E.Carrasco, and P.McDonald 1984 Marriage Dissolution and Remarriage. World Fertility Survey Comparative Studies Number 34. London: World Fertility Survey.
Somalia No date National Survey of Population, 1980–81: Report on Findings. Mogadishu: Central Statistical Department, Ministry of National Planning.
1984 Census of Population, 1975. Analytical Report. Mogadishu: Central Statistical Department, Ministry of National Planning.
1985 Fertility and Family Planning in Urban Somalia: Results of the Somali Family Health Survey in Five Cities, 1983. Mogadishu: Ministry of Health.
Tambashe, O. 1992 Infécondité et politique de population en Afrique centrale. Vie et Santé 12:3–7.
Tanzania No date Provisional Estimates of Fertility, Mortality and Population Growth for Tanzania. Dar es Salaam: Bureau of Statistics.
1983 1978 Population Census, Vol. VIII. Dar es Salaam: Bureau of Statistics.
1990 Population Census National Profile. Summary. Dar es Salaam: Bureau of Statistics.
1992 Tanzania Demographic and Health Survey, 1991/92. Preliminary Report. Dar es Salaam: Bureau of Statistics, President’s Office, Planning Commission; Columbia, Md.: Macro International, Inc.
Thibon, C. 1993 Evolution démographique de la population burundaise d’après les registres des missionaires et le recensement général 1990: Etude des fécondités. Départment d’historire, University of Burundi, Bujumbura.
Thomas, D., and I.Muvandi 1992 The Demographic Transition in Southern Africa: Another Look at the Evidence from Botswana and Zimbabwe. Yale University Economic Growth Center Discussion Paper No. 668. New Haven, Conn.: Yale Univeristy.
Traoré, B., M.Konaté, and C.Stanton 1989 Enquête Démographique et de Santé au Mali. Bamako: Centre d’Etudes et de Recherches sur la Population pour le Développement; Columbia, Md.: Institute for Resource Development/Westinghouse.
Uganda 1973 Report on the 1969 Population Census. Entebbe: Statistics Division, Ministry of Finance, Planning and Economic Development.
United Nations 1979 Demographic Yearbook—Special Issue: Historical Supplement. New York: United Nations.
1983 Manual X: Indirect Techniques for Demographic Estimation. Population Studies No. 81. New York: United Nations, Department of International Economic and Social Affairs.
1984 Demographic Yearbook, 1983. New York: United Nations.
1987 Fertility Behaviour in the Context of Development; Evidence from the World Fertility Study. Population Studies No. 100. New York: United Nations, Department of International Economic and Social Affairs.
1990 Demographic Yearbook, 1988. New York: United Nations.
1991 World Population Prospects 1990. Population Studies No. 120. New York: United Nations, Department of International Economic and Social Affairs.
1992 Child Mortality Since the 1960s: A Database for Developing Countries. New York: United Nations, Department of Economic and Social Development.
U.S. Department of Commerce 1979 A Compilation of Age-Specific Fertility Rates for Developing Countries. International Research Document No. 7. Washington, D.C.: Bureau of the Census,
van de Walle, E., and A.D.Foster 1990 Fertility Decline in Africa: Assessment and Prospects. World Bank Technical Paper Number 125, Africa Technical Department Series. Washington, D.C.: The World Bank.
van de Walle, F., and K.Omideyi 1988 The cultural roots of African fertility regimes. Pp. 2.2.35–2.2.52 in African Popu
lation Conference, Dakar, 1988. Liège: International Union for the Scientific Study of Population.
Venkatacharya, K. 1990 Simplified birth rate estimates under nonstable conditions. Demography 27(1):131– 147.
Warren, C.W., J.T.Johnson, G.Gule, E.Hlophe, and D.Kraushaar 1992 The determinants of fertility in Swaziland. Population Studies 46(1):5–17.
Westoff, C.F. 1992 Age at Marriage, Age at First Birth and Fertility in Africa. World Bank Technical Paper Number 169. Washington, D.C.: The World Bank.
Working Group on Demographic Effects of Economic and Social Reversals 1993 Demographic Effects of Economic Reversals in Sub-Saharan Africa. K.H.Hill and L.G.Martin, eds. Panel on the Population Dynamics of Sub-Saharan Africa, Committee on Population, National Research Council. Washington, D.C.: National Academy Press.
Working Group on Factors Affecting Contraceptive Use 1993 Factors Affecting Contraceptive Use in Sub-Saharan Africa. J.T.Bertrand and C.L.Jolly, eds. Panel on the Population Dynamics of Sub-Saharan Africa, Committee on Population, National Research Council. Washington, D.C.: National Academy Press.
Working Group on the Social Dynamics of Adolescent Fertility 1993 The Social Dynamics of Adolescent Fertility in Sub-Saharan Africa. C.H.Bledsoe and B.Cohen, eds. Panel on the Population Dynamics of Sub-Saharan Africa, Committee on Population, National Research Council. Washington, D.C.: National Academy Press.
World Bank 1986 Population Growth and Policies in Sub-Saharan Africa. A World Bank Policy Study. Washington, D.C.: The World Bank.
1988 Education in Sub-Saharan Africa. A World Bank Policy Study. Washington, D.C.: The World Bank.
1989 Sub-Saharan Africa, From Crisis to Sustainable Growth. Washington, D.C.: The World Bank.
1991 World Development Report 1991, The Challenge of Development. Washington, D.C.: The World Bank.
Zaire 1991 Recensement Scientifique de la Population, 1984. Un Aperçu Démographique. Kinshasa: Institut National de la Statistique.
Zambia 1985a Population and Housing Census of Zambia, 1980. Analytical Report. Volume II: Demographic and Socio-Economic Characteristics of Zambia Population. Lusaka: Central Statistical Office.
1985b Population and Housing Census of Zambia, 1980. Analytical Report Volume. Vol. IV: Fertility and Mortality Levels and Trends. Lusaka: Central Statistical Office.
Zimbabwe 1989 Demographic and Health Survey 1988. Harare: Central Statistical Office, Ministry of Finance, Economic Planning, and Development; Columbia, Md.: Institute for Resource Development/Westinghouse.


