


Below is the uncorrected machine-read text of this chapter, intended to provide our own search engines and external engines with highly rich, chapter-representative searchable text of each book. Because it is UNCORRECTED material, please consider the following text as a useful but insufficient proxy for the authoritative book pages.
1 Purpose of Workbook This workbook is designed to help planners answer questions about the magnitude of the need for public transit services within a geographic area, as well as the annual ridership (i.e. , demand) that a transit service could be expected to carry. Examples of questions that this workbook can help answer include ⢠How many residents of my community need passenger transportation service? ⢠How many trips per year are not being made because of the current lack of passenger trans- portation service? ⢠How many transit trips will the average resident make on a transit service in our community? ⢠We have enough annual funding to operate 50,000 vehicle-miles of service per year. How many passenger-trips per year are we likely to serve? ⢠If we operate a fixed-route transit service in our small city, how many passenger-trips per year are we likely to serve? ⢠If there were a commuter bus program from our community to the big city, how many daily passenger-trips would be served? For each question, a specific section/page of the workbook presents the method by which the question may be answered. These methods are intended to evaluate area-wide need or demand at a planning level of analysis. The methods were developed using data for rural counties and are most applicable for estimating need and demand in rural counties. The methods are also most useful in evaluating areas not currently served by passenger transportation. These methods are not intended to be used to assess demand for specific routes or needs in individual neighborhoods. In addition, the reader should be aware that the estimates of demand represent the demand that could be expected in a mature system (i.e., one that has been in operation for at least 12 to 18 months). Chapter 16 of TCRP Report 95 has information about the likely time for a newly established system to achieve mature demand. An Excel spreadsheet is available for applying the procedures described in this workbook. The spreadsheet can be downloaded from the TRB website by searching for TCRP Report 161. Appendix B provides step-by-step instructions for use of the spreadsheet. Organization of Workbook This workbook has four major chapters: Introduction, Need, Demand, and Data Sources. The remainder of this chapter explains the data collection necessary for using the methods in the workbook as well as definitions of terms used in the workbook. Chapters 2 and 3 provide C H A P T E R 1 Introduction
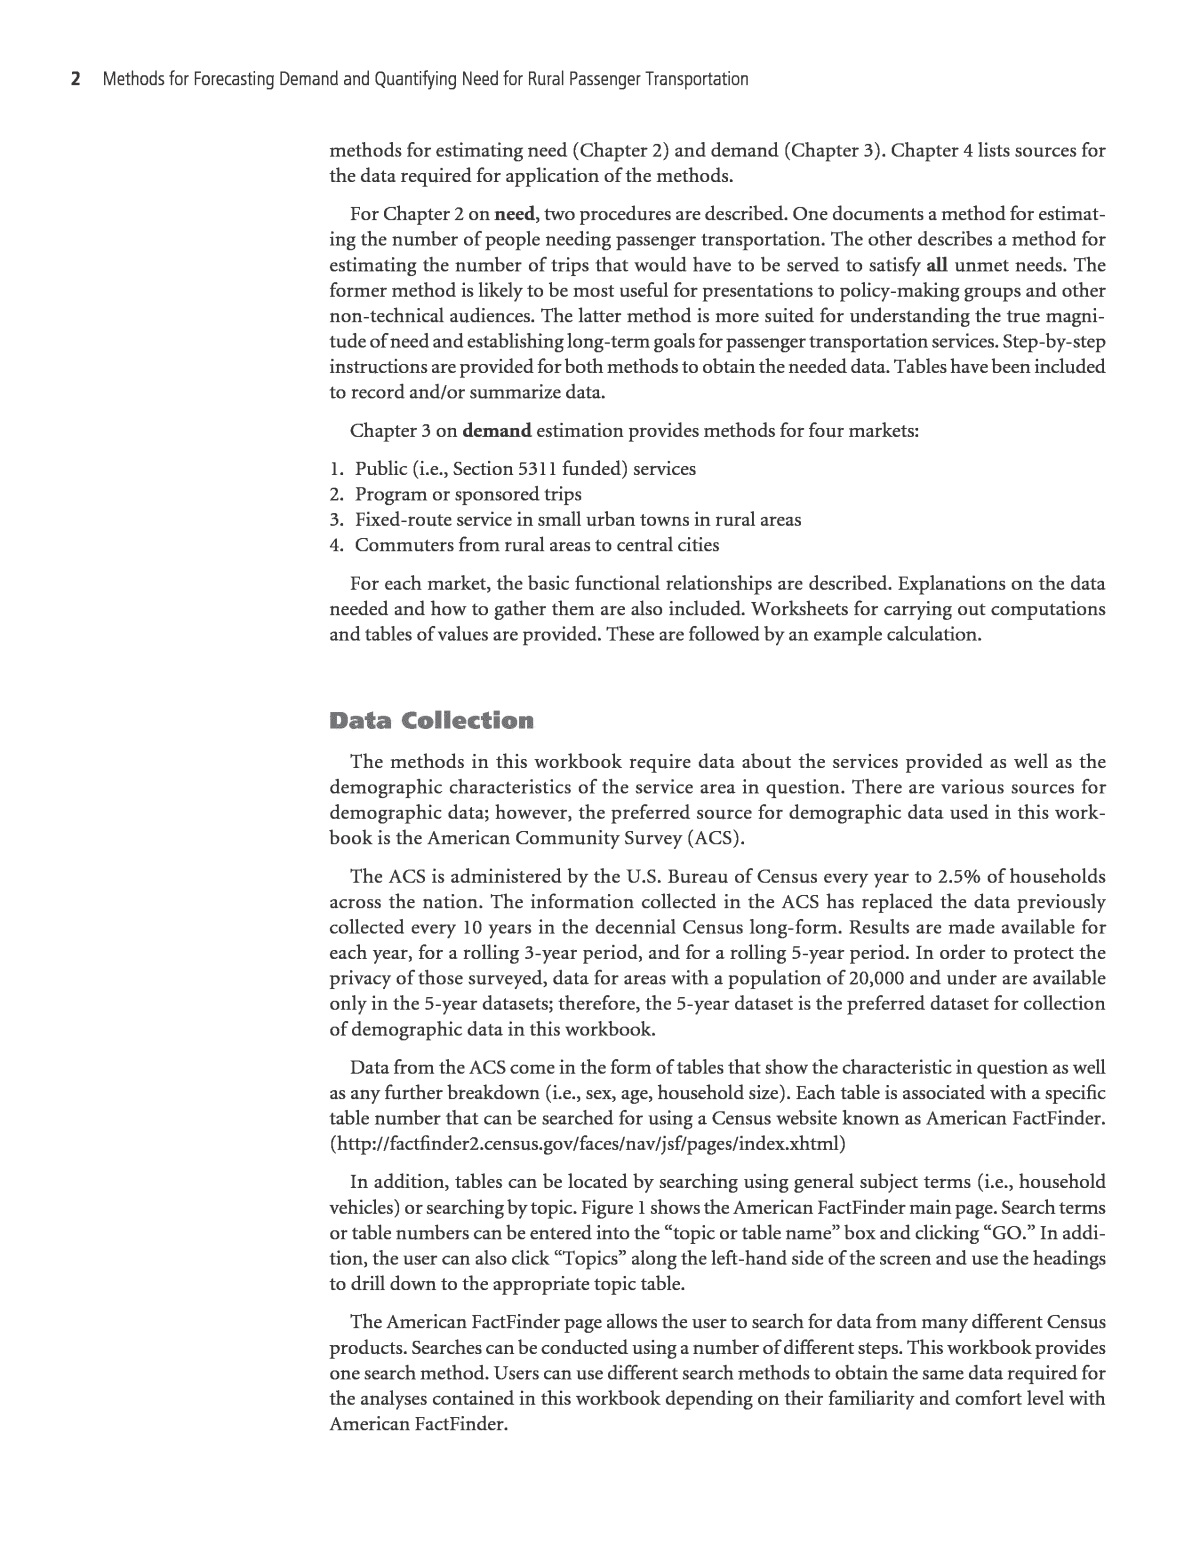
2 Methods for Forecasting Demand and Quantifying Need for Rural Passenger Transportation methods for estimating need (Chapter 2) and demand (Chapter 3). Chapter 4 lists sources for the data required for application of the methods. For Chapter 2 on need, two procedures are described. One documents a method for estimat- ing the number of people needing passenger transportation. The other describes a method for estimating the number of trips that would have to be served to satisfy all unmet needs. The former method is likely to be most useful for presentations to policy-making groups and other non-technical audiences. The latter method is more suited for understanding the true magni- tude of need and establishing long-term goals for passenger transportation services. Step-by-step instructions are provided for both methods to obtain the needed data. Tables have been included to record and/or summarize data. Chapter 3 on demand estimation provides methods for four markets: 1. Public (i.e., Section 5311 funded) services 2. Program or sponsored trips 3. Fixed-route service in small urban towns in rural areas 4. Commuters from rural areas to central cities For each market, the basic functional relationships are described. Explanations on the data needed and how to gather them are also included. Worksheets for carrying out computations and tables of values are provided. These are followed by an example calculation. Data Collection The methods in this workbook require data about the services provided as well as the demographic characteristics of the service area in question. There are various sources for demographic data; however, the preferred source for demographic data used in this work- book is the American Community Survey (ACS). The ACS is administered by the U.S. Bureau of Census every year to 2.5% of households across the nation. The information collected in the ACS has replaced the data previously collected every 10 years in the decennial Census long-form. Results are made available for each year, for a rolling 3-year period, and for a rolling 5-year period. In order to protect the privacy of those surveyed, data for areas with a population of 20,000 and under are available only in the 5-year datasets; therefore, the 5-year dataset is the preferred dataset for collection of demographic data in this workbook. Data from the ACS come in the form of tables that show the characteristic in question as well as any further breakdown (i.e., sex, age, household size). Each table is associated with a specific table number that can be searched for using a Census website known as American FactFinder. (http://factfinder2.census.gov/faces/nav/jsf/pages/index.xhtml) In addition, tables can be located by searching using general subject terms (i.e., household vehicles) or searching by topic. Figure 1 shows the American FactFinder main page. Search terms or table numbers can be entered into the âtopic or table nameâ box and clicking âGO.â In addi- tion, the user can also click âTopicsâ along the left-hand side of the screen and use the headings to drill down to the appropriate topic table. The American FactFinder page allows the user to search for data from many different Census products. Searches can be conducted using a number of different steps. This workbook provides one search method. Users can use different search methods to obtain the same data required for the analyses contained in this workbook depending on their familiarity and comfort level with American FactFinder.
Introduction 3 It is assumed that the table numbers associated with each table are unlikely to change on a frequent basis. Therefore, this is the preferred method used to search for and collect the appro- priate data for each method contained in the workbook. The various table numbers and titles are included in Table 1. They are organized by method. The instructions given throughout the remainder of this workbook for obtaining ACS data will yield data for the current 5-year period as of early 2012, except for disability characteristics. When data are available, the 5-year dataset for each table is the preferred dataset for all the methods contained in this workbook because it includes all jurisdictions, regardless of population size. The specific steps required to retrieve ACS data may change as the Census Bureau revises its website or its surveys. Figure 1. Methods to Search for ACS Tables. ACS Table Number Table Title Methods Using These Data B08201 Household Size by Vehicles Available Need â Popula�on Segments, Need â Mobility Gap, Demand â Non-program, Demand â Non-market speciï¬c B17001 Poverty Status in the Past 12 Months by Sex by Age Need â Popula�on Segments, Demand â Non-program B01001 Sex by Age Demand â Non-program S1810 Disability Characteris�cs Demand â Non-program B01003 Total Popula�on Demand â Small City Fixed-Route Note: Disability is not currently available in any 5-year datasets. It is only available in 3-year and 1-year datasets. The 5-year dataset will be available in ACS 2008-2012 in 2013. Table 1. ACS Table Numbers used in this Workbook.
4 Methods for Forecasting Demand and Quantifying Need for Rural Passenger Transportation Definitions Need 1. The number of people in a given geographic area likely to require a passenger transporta- tion service. 2. The difference between the number of trips made by persons who reside in households own- ing no personal vehicle and the number of trips that would likely be made by those persons if they had access to a personal vehicle. This measure is referred to as the Mobility Gap. Demand The number of trips likely to be made over a given period within a given geographic area at a given price and level of service. The procedures for preparing forecasts of demand have been stratified by market: ⢠Public (i.e., Section 5311 funded) services ⢠Program or sponsored trips ⢠Fixed-route service in small urban towns in rural areas ⢠Commuters from rural areas to central cities Trips As used in this workbook trips are defined as one-way trips made over a given time periodâ a day or a year. Given differences in data sources, trips are defined differently for different markets. For public systems and fixed-route services in small urban towns in rural areas, the Rural National Transit Database was used as the source of data. The definition of a trip is, therefore, the same as used in the NTD: The number of passengers who board operational revenue vehicles. Passengers are counted each time they board a vehicle, no matter how many vehicles they use to travel from their origin to their destination. The time period for these estimates is one year. For program or sponsored trips, the data used for analysis were gathered from many social- service agencies. For this market, a trip is a âlinked tripâ from an original origin to an ultimate destination. Transfers or intermediate stops are not counted as additional trips. The forecast method produces estimates of annual trips. For commuter trips, the method forecasts the number of transit trips based on a user-provided measure of person-trips. The definition of a trip will therefore depend on the source used. If the source is the Longitudinal Employment-Household Dynamics (LEHD) dataset, the values represent commuters rather than trips. To get estimates of trips, the values must be doubled to represent travel to and from work. If the source for âperson-tripsâ is the ACS or the Census Transportation Planning Package, a trip is a daily one-way journey from home to work. The value must be multiplied by two to get daily transit trips. When using either LEHD or ACS data that report commuting travel on an average day, the daily values should be multiplied by 255 to get annual transit trips. If some other source is used for person-trips (e.g., estimated by the urban area Metropolitan Planning Organization or by the State Transportation Agency), then the estimates will be in the units used for those projections. Mobility Gap The difference between the number of trips per day made by persons living in households having one personal vehicle available and those living in households that own no personal
Introduction 5 vehicles. This is a more conservative measure than comparing the trip rate for households with no vehicle available against households having one or more vehicles available. American Community Survey (ACS) A survey administered by the U.S. Bureau of the Census that collects data each year from a sample of approximately 2.5% of the households in the nation. The information collected in the ACS has replaced the data previously collected every 10 years in the decennial Census long-form. Results are made available for each year, for a rolling 3-year period, and for a rolling 5-year period. Given that the Census must suppress some data to maintain confidentiality, data for areas with a population of 20,000 or less are available only in the 5-year rolling summaries. Rural For the methodologies presented in this workbook, a rural county is defined as one having a population density of less than 1,000 persons per square mile. Urbanized Area As defined by the U.S. Census, an area consisting of a central place and adjacent territory with a general population density of at least 1,000 people per square mile of land area that together has a minimum residential population of at least 50,000 people. Urban Cluster As defined by the U.S. Census, an urban cluster consists of densely settled territory that con- tains at least 2,500 people, but fewer than 50,000 people. Urban Center A method is included in this workbook for estimating the demand for passenger transporta- tion from rural counties to urban centers. In this context an urban center is defined as the central place of an urbanized area.
