
5
Alternative Approaches to Liquefaction Triggering Assessment
There are a growing number of alternatives to the simplified stress-based approach to liquefaction triggering assessment discussed in Chapter 4. This chapter addresses such alternative methods that are either proposed or in use to assess liquefaction triggering. One is a screening tool—regional maps that delineate areas susceptible to liquefaction triggering largely on geologic grounds. Other methods described include a cyclic strain-based alternative to the cyclic stress-based approach, energy-based approaches, laboratory and physical model tests, field measurement of pore-pressure generation under dynamic loading, and computational mechanics approaches.
REGIONAL LIQUEFACTION HAZARD MAPS AND PAST OCCURRENCE OF LIQUEFACTION
Geologic maps provide a basis for depicting the potential for liquefaction triggering at a regional scale. Such depictions are usually employed as planning tools for government agencies and as guidance for site-specific studies. They are seldom used alone for site-specific liquefaction evaluations, but they have a role in site characterization (Siegel, 2013) and in determining whether a detailed liquefaction evaluation is required.
The mapping approach to liquefaction hazard assessment can be traced to a comprehensive study that correlated mappable geologic units with liquefaction damage during the 1964 Alaska earthquake (McCulloch and Bonilla, 1970). Later, mappable sedimentary deposits of various ages
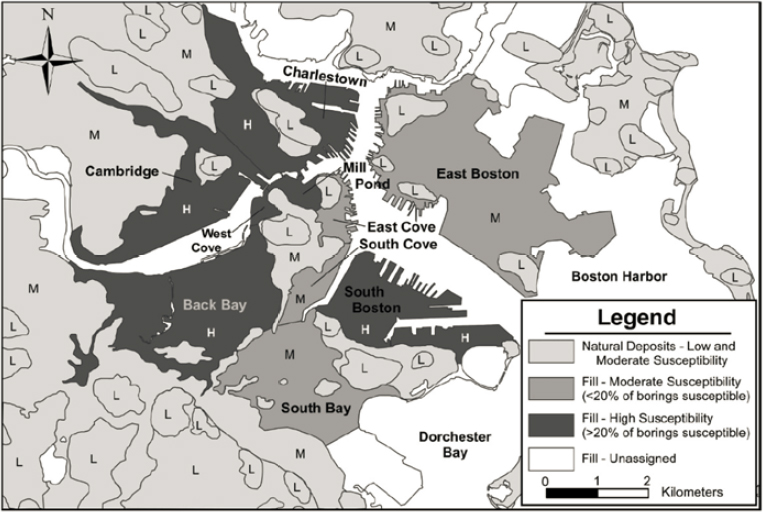
and depositional environments were ranked qualitatively by liquefaction potential and used to develop maps of liquefaction susceptibility (Youd and Perkins, 1978). The past decade has brought quantitative assessment of liquefaction potential into liquefaction-hazard maps. Modern liquefaction hazard maps incorporate geotechnical estimates of the liquefaction potential of individual geologic units based on measured in situ parameters across each unit and probabilistic estimates of ground shaking (Baise et al., 2006; Holzer et al., 2011). An example of such a map for Boston, Massachusetts (Brankman and Baise, 2008), is shown in Figure 5.1. Similar maps have been developed elsewhere: for example, for California (California Geological Survey, 2004, 2008), Indiana and Kentucky (Haase et al., 2011), and South Carolina (Heidari and Andrus, 2010, 2012).
Regional liquefaction maps could have a role in probabilistic evaluations of liquefaction triggering. As noted in Chapter 4, the Bayesian methods used to develop several of the probabilistic triggering relationships assume non-informative prior probabilities of liquefaction. If the empirical relationships for cyclic resistance ratios (CRRs) developed by Bayesian methods were presented as CRR curves associated with different likelihood ratios rather than different probability levels, the curves could be combined with prior probabilities derived from regional liquefaction maps to obtain more representative posterior probabilities of liquefaction (see Box 4.2).
Regional geologic perspectives on liquefaction hazards also underpin the AASHTO (2014) guide specifications. If evidence of previous liquefaction is found in the vicinity of a site, then a detailed liquefaction analysis is always required. Interpreted broadly, the guideline encourages consideration of evidence for liquefaction not just at the site but also in analogous deposits nearby, and not just during modern earthquakes but also in the recent geologic past.
Liquefaction maps and geologic screening methods warrant continued development. Maps of probabilistic liquefaction hazard could be expanded in coverage, even to a national scale similar to the national seismic hazard maps. The mapping could be anchored in geotechnical data from the geologic map units. A database of geologic evidence for liquefaction, compiled recently for the central and eastern United States (Tuttle and Hartleb, 2012), extends the timescale of observations into previous millennia and could be extended nationwide. Such regional products would not replace site-specific evaluations; rather, they would provide guidance as to the need for site-specific evaluations.
CYCLIC STRAIN-BASED APPROACH
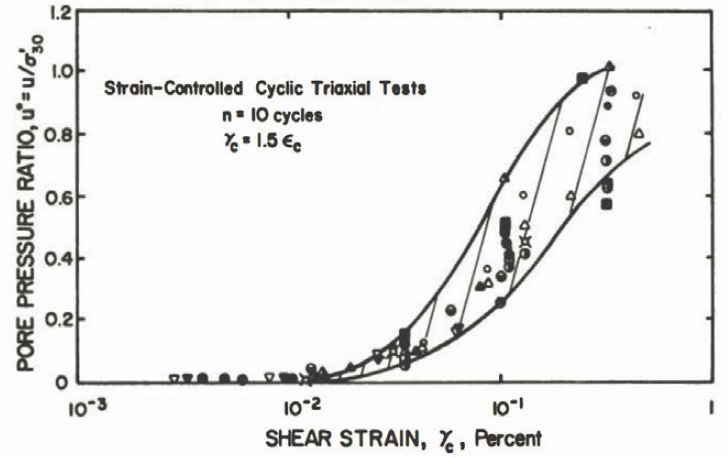
The cyclic strain approach (Dobry et al., 1982) assesses liquefaction triggering through the prediction of pore-pressure generation as a function of the earthquake-induced shear strain (see Chapter 2). The approach takes advantage of the fact that cyclic compression (for drained conditions) and pore-pressure generation (for undrained conditions) are related more closely to shear strain than shear stress (Silver and Seed, 1971; Youd, 1972; Martin et al., 1975; Dobry and Ladd, 1980). As shown in Figure 5.2, the relationship between excess pore-pressure ratio (ru) and cyclic shear strain (γ) for a given number of constant amplitude strain cycles in strain-controlled tests falls in a relatively narrow band, particularly at low strains and pore-pressure ratios, across different sands prepared at different relative densities using different techniques and tested at different effective confining pressures. The volumetric threshold shear strain, defined as the shear strain below which no pore pressure develops, is consistently about 0.01% for normally consolidated sands (Dobry and Abdoun, 2011).
The strain approach to evaluating liquefaction triggering involves predicting the excess pore-pressure ratio, which requires an estimate of the earthquake-induced shear strain. The induced
shear strain is computed as the earthquake-induced shear stress at a given depth divided by the shear modulus of the soil at the same depth. The earthquake-induced shear stress is calculated using the same approach as the stress-based method (Chapter 4, Equation 4.1), and the shear modulus of the soil is related to the soil shear wave velocity (Vs) and the reduction in shear modulus with increasing shear strain. This method ignores the effect of pore-pressure generation on the shear modulus of soil. Given the computed earthquake-induced shear strain and the number of strain cycles, the pore-pressure ratio can be estimated from a curve such as shown in Figure 5.2.
Proponents of the strain-based method argue that the relationship between pore pressure and shear strain is only moderately influenced by such factors as soil density, soil fabric, and confining pressure (Dobry et al., 1982; Dobry, 1985), so that a large suite of correction factors is not necessary. The main parameter used to characterize the in situ soil for the strain approach is the Vs, which is a more fundamental material parameter than is penetration resistance. Theories are available that predict how Vs is influenced by effective stress and other variables (Kramer, 1996). Recently, induced shear strain was used as the unifying parameter to interpret liquefaction triggering charts for in situ parameters and to explain pore-pressure generation from different centrifuge experiments (Dobry and Abdoun, 2011), which shows the potential for the strain approach to provide important insights into the prediction of liquefaction triggering.
A limitation of the strain-based approach proposed by Dobry and colleagues (1982), however, is the computation of the number of equivalent strain cycles needed to use Figure 5.2 or a similar relationship. The shear strain computed using the procedures outlined above represents the average shear strain during earthquake shaking. Correlations developed for the number of equivalent stress cycles could be used (see, e.g., Liu et al., 2001) to evaluate the average shear strain based on an average shear modulus, but this approach assumes that the equivalency of stress cycles (which is based on a cyclic strength curve) is the same as the equivalency of strain cycles, and this assumption is uncertain (Carter and Seed, 1988; Green and Terri, 2005). The issue can be avoided by using the maximum shear strain after a given number of stress-controlled loading cycles (Cetin and Bilge, 2012), but in this case, the estimated shear strain includes the effects of pore-pressure generation, which is not taken into account in other simplified procedures.
One application of the strain approach is to determine if the induced shear strain exceeds what might be called the “threshold” shear strain (about 0.01%), below which no excess pore pressure is generated. If the induced shear strain is less than the threshold shear strain, this method predicts that liquefaction is not of concern. If the induced shear strain exceeds the threshold shear strain, additional analyses of the potential for triggering of liquefaction and its consequences are necessary.
Despite its introduction more than 30 years ago, the strain approach has not been a focal point of further extensive research development, and it has not gained traction in engineering practice. The uncertainty associated with predicting the strain amplitude may be inhibiting adoption of strain-based methods. Issues related to the relationship between the number of equivalent strain cycles and earthquake magnitude, many of which are similar to issues related to the number of equivalent stress cycles discussed subsequently in the section on laboratory assessment of liquefaction triggering, must also be resolved with respect to the strain approach. In addition, full validation and calibration of the strain approach against field case histories is needed for this approach to become a more accepted method of assessing the potential for triggering liquefaction. Research in this area would be of value.
ENERGY-BASED APPROACHES
Liquefaction triggering approaches that employ ground motion intensity measures other than the peak ground acceleration (PGA) commonly have been classified as “energy-based” approaches, regardless of whether the intensity measure is truly a measure of energy. Many of the proposed procedures were developed using an approach similar to that used for the simplified stress-based procedures (i.e., correlations relating in situ test measurements to the liquefaction resistance derived from field case histories).
Input energy is fundamental to the breakdown of the soil fabric, which, in turn, leads to pore-pressure generation and liquefaction. Seismologists quantify the energy released during earthquakes with simple equations relating seismic wave energy to earthquake magnitude (see, e.g., Gutenberg and Richter, 1956). Nemat-Nasser and Shokooh (1979) developed a mechanics-based relationship between dissipated energy and excess pore-pressure generation, and several experimental studies developed similar empirical relationships (e.g., Davis and Berrill, 1982; Berrill and Davis, 1985; Yamazaki et al., 1985; Yanagisawa and Sugano, 1994; Liang, 1995; Green et al., 2000, Polito et al. 2008). As a result, it has been concluded that research and development of energy-based approaches should continue (Youd et al., 2001).
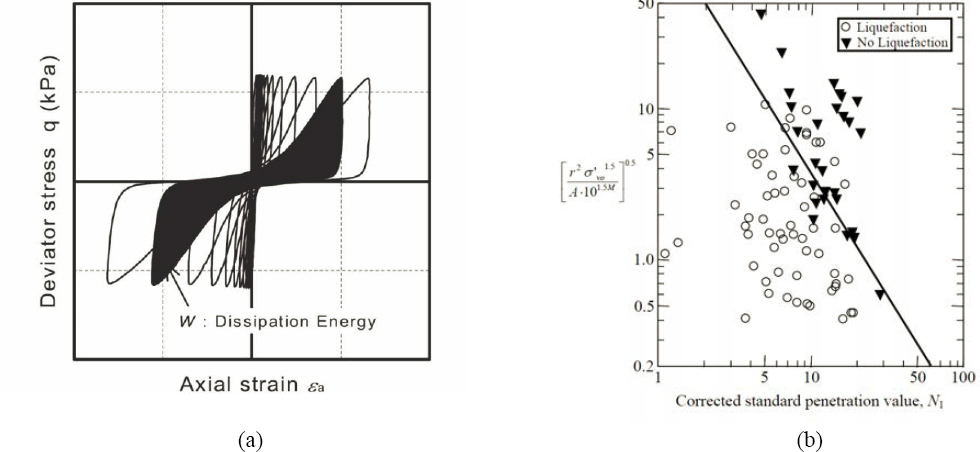
The proposed energy-based approaches have several forms, but they are all founded on quantifying both the seismic demand and the liquefaction resistance in terms of energy. One of the earliest energy approaches was based on dissipated energy, which is proportional to the cumulative area bounded by stress-strain hysteresis loops (see Figure 5.3a). One such cumulative energy approach for evaluating the potential for liquefaction triggering was proposed by Davis and Berrill (1982) and modified by Berrill and Davis (1985). The seismic demand is computed from the estimated seismic wave energy released at the earthquake source (Gutenberg and Richter, 1956), modified to account for the attenuation of the energy with distance due to both geometrical spreading (Davis and Berrill, 1982) and material damping (Berrill and Davis, 1985). These investigators coupled this modified seismic wave energy with an empirical relationship that relates dissipated energy per unit volume of soil to excess pore-pressure generation to develop an expression for seismic demand. Using case history data, a correlation was developed between corrected standard penetration test (SPT) N-values and the dissipated energy required to cause liquefaction (see Figure 5.3b). The biggest drawbacks of the approach are the relatively large variability in the estimated seismic energy demand and the lack of a unique link between seismic wave energy arriving at the site and dissipated energy in a stratum at a given depth. Nevertheless, their approach was pioneering and set the stage for several subsequent studies that apply more refined approaches to estimate dissipated energy in a soil profile (e.g., Law et al., 1990; Green, 2001; Kokusho, 2013).
Proponents of energy-based procedures state that these procedures have the potential to capitalize on the strengths of both the stress-based and the strain-based procedures because energy per unit volume of soil is a function of both stress and strain (Green, 2001). Other reported advantages of the energy-based approaches are the absence of a magnitude scaling factor (MSF) and the ability to account for differences in the characteristics of shaking in different tectonic regions (e.g., Central and Eastern North America relative to Western North America) and for non-earthquake sources of vibration (see, e.g., Green and Mitchell, 2004). Energy-based procedures are also subject to some of the limitation of other procedures, however. For example, for some of the proposed procedures, the effects of pore-pressure generation are ignored when estimating the dissipated energy demand, similar to the approach taken in the stress-based and strain-based methods. Although not yet used in practice, research and development of energy-based approaches should continue because the potential advantages of the approach over currently used procedures appear promising.
Procedures that use Arias intensity (Arias, 1970) as a measure of the strength of earthquake shaking have also been referred to as energy-based procedures (see, e.g., Kayen and Mitchell, 1997). Originally developed to quantify the damage potential of earthquake motions on buildings, Arias intensity is proportional to the integral of the acceleration-time history squared over time. As a result, it is influenced by the amplitude variation, frequency content, and duration of the earthquake motion. As such, Arias intensity, then, could be considered a reasonable measure to quantify seismic demand, and several ground motion predictive relationships have been developed to estimate Arias intensity as a function of earthquake magnitude, distance, and other parameters (see, e.g., Kayen and Mitchell, 1997; Travasarou et al., 2003; Lee and Green, 2008, 2010). Nevertheless, the use of Arias intensity as the sole intensity measure for quantifying seismic demand for evaluating liquefaction triggering potential has been questioned (see, e.g., Green and Mitchell, 2003). Specifically, laboratory studies have shown that liquefaction resistance is independent of the frequency of the applied loading for the range of frequencies of interest in earthquake engineering (Riemer et al., 1994), but Arias intensity is influenced by the frequency content of an earthquake motion. Furthermore, the large standard error in Arias intensity ground motion prediction equations suggests that there will be large uncertainty in the prediction of seismically generated pore pressures based on Arias intensity even if a unique relationship between pore-pressure generation and Arias intensity is established.
LABORATORY AND PHYSICAL MODEL TESTING
Within the context of this report, laboratory testing refers either to index property testing for soil characterization purposes or to single-element cyclic laboratory tests in which a presumably representative homogeneous specimen is subject to known stress or strain boundary conditions and is cyclically loaded. Index property tests are used to classify the soil and to assess the susceptibility of a soil to liquefaction triggering either directly (e.g., on the basis of grain size and plasticity) or indirectly (e.g., by validating soil classification obtained indirectly from cone penetration test [CPT] data). Grain size and plasticity data may indicate that the potential for liquefaction triggering can be assessed using the simplified method (with percent passing the #200 sieve as an input parameter); that the soil is not susceptible to liquefaction triggering (as discussed in Chapter 4); or that the soil is amenable to sampling and cyclic laboratory testing for evaluation of the potential for liquefaction triggering (as discussed in this chapter).
In addition to grain size and soil plasticity, the maximum and minimum density (or unit weight) of a granular soil may also be useful parameters for establishing the relative density1 of soil used in laboratory testing, as liquefaction triggering potential of a granular soil in situ is generally considered to be related to relative density and not the absolute density of the soil. In situ characterization of relative density usually relies on indirect measurement via correlation with SPT or CPT resistance given the difficulty in recovering relatively undisturbed samples. In situ relative density evaluated on the basis of CPT or SPT resistance, however, is rarely, if ever, used to assess liquefaction triggering potential. Instead, CPT or SPT resistance is used directly to assess liquefaction triggering potential (e.g., using the simplified method).
In this report, the term “physical model testing” refers to either “1-g”2 shake table testing or dynamic centrifuge model testing. The designation of “1-g” assigned to shake table testing distinguishes it from centrifuge testing wherein models are loaded via a shake table but the shake table is mounted in a geotechnical centrifuge and centrifugal acceleration is used to multiply the body forces on the soil skeleton (for model scaling purposes). Physical model testing may be used to evaluate the behavior of potentially liquefiable systems subject to earthquake loading, including layered soil profiles and soil-structure systems. Layered soil profiles may include horizontally layered stacks of soil (even if the soil type is uniform [e.g., to evaluate confining pressure effects and to validate numerical models]), sloping soil profiles, and profiles with embankments or a free face (e.g., a riverbank). Due to the dependence of liquefaction triggering potential on the stress level in the soil, and given the difficulty and expense of large-scale 1-g shake table testing, the usefulness of 1-g shake table tests is limited. Centrifuge model testing allows scaled model testing, with the model scale equal to the centrifuge acceleration (in multiples of the acceleration of gravity). Modern geotechnical centrifuge model testing began in the 1970s and matured since 1985 as a tool to investigate factors that influence liquefaction triggering and consequences. Nevertheless, the efficacy of centrifuge model tests for liquefaction studies has been questioned given sample preparation issues, grain size and permeability effects, and the influence of boundary conditions unique to centrifuge models.
There have been few advances in laboratory testing for liquefaction triggering assessment since the 1985 report (NRC, 1985) on liquefaction was published. This, perhaps, reflects both the
___________________
1 The relative density of a soil is equal to (emax-e)/(emax-emin) where e is the void ratio of the soil, emax is the maximum void ratio of the soil (representative of its loosest state), and emin is the minimum void ratio of the soil (representative of its densest state).
2 g is the gravitational field equal to 9.8 Newtons per kilogram.
great difficulty in obtaining high-quality samples (samples in which the soil structure is relatively undisturbed) for testing and the trend toward in situ testing to evaluate soil liquefaction resistance. Nonetheless, laboratory testing remains a valuable tool for investigating the influence of factors such as effective overburden pressure and fines content on liquefaction triggering potential and for assessing triggering potential in soils amenable to recovery of high-quality, relatively undisturbed samples. For example, soils with significant fines content, particularly if the fines are plastic, may be amenable to laboratory testing to determine their in situ resistance to triggering. Furthermore, the applicability of the simplified method to assessing the liquefaction triggering potential of these types of soils is suspect, as noted in Chapter 4. It is therefore often desirable to recover relatively undisturbed high-quality samples of potentially liquefiable finer-grained soils using thin-walled tubes, preferably using special techniques such as fixed piston sampling (Osterberg, 1952; ASTM D6519) or gel push sampling (Huang et al., 2008). Reimer (2007) describes laboratory testing of low-plasticity silty soil to evaluate its liquefaction triggering potential for the Bay Area Rapid Transit expansion project from Fremont to San Jose, California.
Cyclic Laboratory Testing
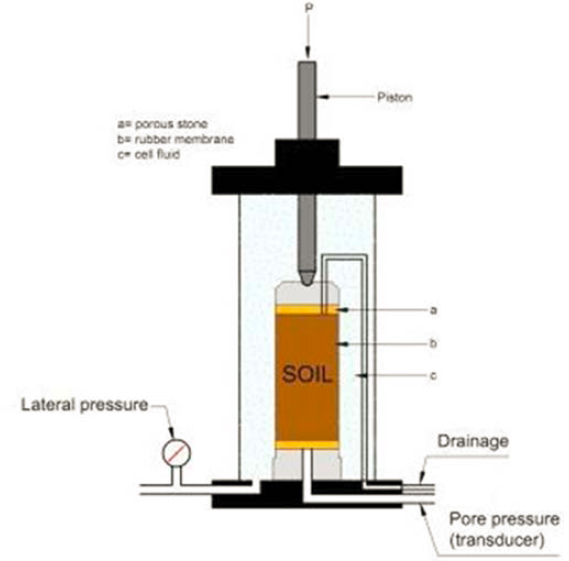
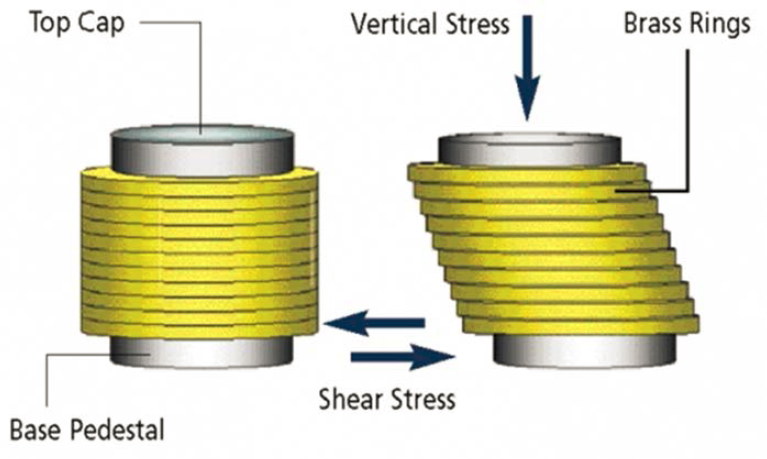
Laboratory tests that can be used to evaluate or provide insight into liquefaction triggering in soils include cyclic triaxial (CTX) tests and cyclic direct simple shear (CyDSS) tests (Kramer, 1996). CTX tests use a cylindrical sample with a height-to-diameter ratio typically equal to 2.0 or greater encased by a flexible membrane and rigid caps on either end, as illustrated in Figure 5.4. The radial boundary condition in CTX tests is generally stress controlled (i.e., through application of a constant confining pressure in the cell that encloses the specimen). Cyclic loading in a CTX test is usually applied by pushing and pulling on the piston attached to the top cap. CyDSS tests use cylindrical specimens with a height-to-diameter ratio typically equal to 0.5. The radial boundary condition in this test is typically strain controlled, with the specimen confined against lateral deformation by a rigid stack of sliding rings, as illustrated in Figure 5.5, or a wire-wrapped membrane. Both approaches are intended to enforce a zero lateral strain boundary condition representative of vertically propagating shear waves in a horizontally layered soil profile. Cyclic loading in a CyDSS test is usually applied via application of a shear force or shear displacement on a horizontal plane to either the top or the bottom of the specimen (with the other end fixed), as illustrated in Figure 5.5, and it is assumed that a complementary shear stress (necessary for equilibrium of the specimen) develops on vertical planes along the sides of the specimen.
Cyclic hollow cylinder torsional shear tests can also be used to assess soil liquefaction triggering in the laboratory. In these tests, a vertically oriented hollow cylindrical specimen encased in membranes on the inside and outside of the hollow cylinder is mounted in a cell between rigid base and top caps, subject to a constant confining pressure, and loaded cyclically by a torsional force of displacement applied to either the top or the base. Hollow cylindrical specimens must be used to maintain a relatively constant shear strain on a horizontal plane in the specimen, as shear strain varies linearly from zero at the center of a torsionally loaded cylinder to a maximum value along the outer perimeter. Due to difficulties in preparing a hollow cylindrical specimen of cohesionless soil, however, this type of test is much less commonly used for investigating liquefaction than CTX or CyDSS tests.
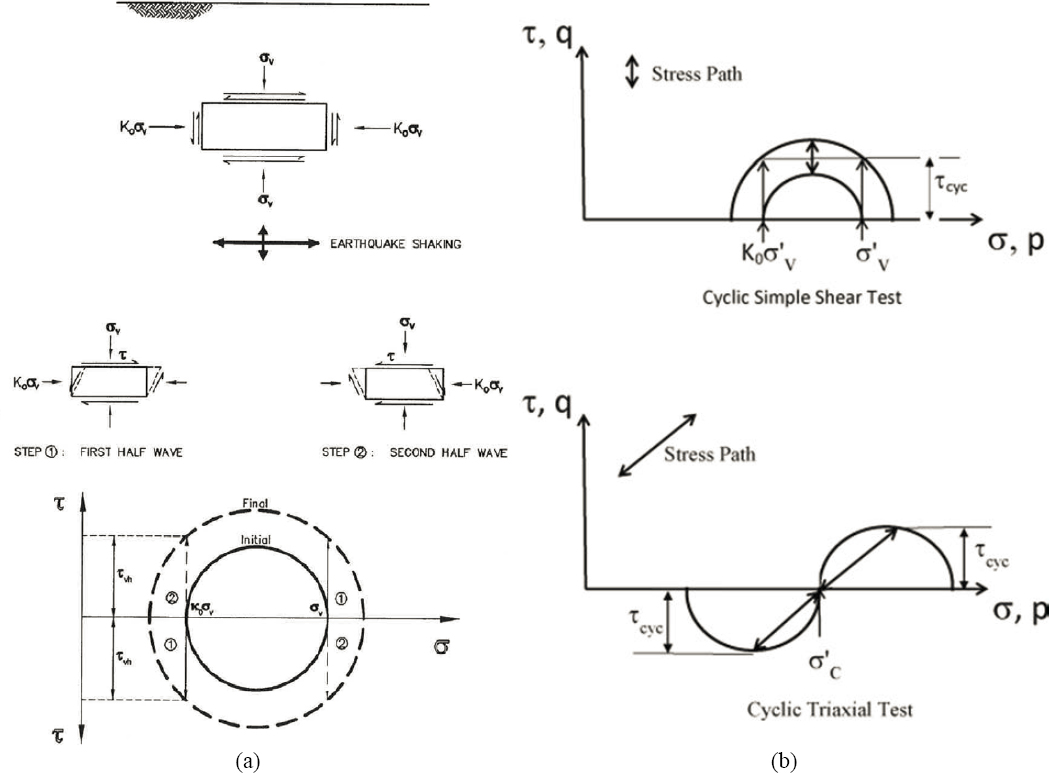
CTX tests are easier to perform than CyDSS tests, but CyDSS tests provide a better representation of both the in situ initial (K0) stress and strain state in level ground and the earthquake-induced stresses due to vertically propagating shear waves. As illustrated in Figure 5.6, simple shear loading accurately reflects the initial (at rest) in situ stresses in level ground (i.e., the K° stress state) and the stresses imposed on an element of soil by a vertically propagating shear wave in horizontally layered soil (i.e., imposition of a cyclic shear stress with no change in normal stress on the vertical and horizontal planes). The CTX test applies the cyclic shear stress that represents the earthquake load on the 45° plane of the laboratory specimen (i.e., not on the horizontal plane to which the earthquake shear stress is applied in the field). The normal stress on that 45° plane is not constant as it is on horizontal plane in the field, but instead varies about the mean normal stress.
The stress state in the hollow cylinder torsion test also closely approximates the stresses induced in the ground by a vertically propagating shear wave, since the vertical and horizontal normal stresses are constant and a shear stress is applied to the horizontal plane (Towhata and Ishihara, 1985). But this test is typically limited to testing of reconstituted specimens and is rarely, if ever, used to test undisturbed samples due to the difficulty in trimming an undisturbed cylindrical sample and mounting it in the device. CyDSS, CTX, and cyclic hollow cylinder torsional shear tests can all be used to study patterns of behavior that affect the liquefaction triggering potential of soils in situ (e.g., the effect of the initial effective stress level and the effect of an initial static shear stress) on reconstituted samples.
Cyclic laboratory test methods (CTX, CyDSS, and hollow cylinder torsional shear) can provide substantial insight into the factors that affect liquefaction triggering. Laboratory cyclic tests have had and will continue to have an essential role in investigating and evaluating, for example, the influence of density (or relative density), fines content, particle size and size distribution, degree of saturation, and nonuniform load cycles on the potential for liquefaction triggering. As noted in Chapter 4, the extrapolation of the relationships used in the simplified method for overburden stress, grain size, and magnitude effects into ranges where they are not constrained by field data need to be informed by this type of laboratory testing. CTX testing remains popular for this purpose due to the ease with which the tests can be performed and the availability of equipment. Caution is warranted, though, when using CTX tests due to the difference in stress state between the CTX test and the field condition. Laboratory testing is also useful for developing constitutive relationships for pore-pressure development prior to liquefaction and for the post-liquefaction behavior of soils.
It is difficult to obtain relatively undisturbed samples of cohesionless liquefiable soil. As noted previously, soils with enough plastic fines can maintain their structures if sampled using specialized thin-walled tubes and sampling equipment that minimizes disturbance. Recovering samples of sandy or gravelly soils without enough fines to maintain their structure during sampling, extrusion, and mounting in the test cell requires techniques such as ground freezing. Use of ground freezing to recover relatively undisturbed samples for laboratory evaluation of liquefaction triggering potential relies on the assumption that a unidirectional freezing front will push porewater that expands as it freezes out ahead of the freezing front without disturbing the soil, thus preserving the soil structure and maintaining its properties (Yoshimi et al., 1978; Hofmann et al., 2000). Note, however, that ice continues to expand in volume during freezing, and therefore the assumption that no soil volume change is induced by a unidirectional freezing front is questionable. The question is raised, then, of whether freezing the soil for sampling and then
thawing the soil for testing disrupts the fabric or erases any aging effects that may have occurred in the field, even given zero net volume change of the soil skeleton during this process.
Ignoring any loss of age-related increase in liquefaction resistance by fabric changes associated with freezing and thawing would be conservative. If the geologic age of the deposit is known, the effect of aging could be accounted for by empirically adjusting the laboratory-measured resistance based on the in situ Vs using concepts developed by Andrus and colleagues (2009). Another technique that may effectively preserve the physical structure of the specimen prior to sampling is impregnating the ground with a biopolymer (Sutterer et al., 1996). This approach is burdensome, however, and has been investigated only a few times for research purposes. Due to the expense and difficulty in obtaining relatively undisturbed samples through ground freezing or other special techniques, laboratory testing for site-specific evaluation of liquefaction triggering in sandy and gravelly soils is generally limited to projects of high value, where there are critical consequences, and for research purposes. A technique that allows cost-effective recovery and testing of cohesionless soil samples such that in situ cyclic resistance was retained would facilitate laboratory testing for liquefaction triggering evaluation of such soils in situ for more routine projects.
Assessment of Liquefaction Triggering Potential from Cyclic Laboratory Tests
While nonuniform load sequences can be applied in cyclic laboratory testing, including load sequences based on strong motion time histories, there is no generally accepted procedure for performing and interpreting the results of such laboratory tests. Therefore, most laboratory test programs employ uniform cycles of loading. In a typical laboratory-based liquefaction triggering assessment, the objective is to evaluate the cyclic strength curve for the soil (see Chapter 2, Figure 2.7). If only a limited number of cyclic tests can be performed, they can be used to anchor a typical cyclic strength curve from the literature for a soil of similar composition. Once the cyclic strength curve is known, the factor of safety can then be assessed based on the representative cyclic stress ratio (CSR) from the simplified stress-based approach (see Chapter 4, Equation 4.2) and Neq, the representative number of uniform cycles for the design earthquake. Alternatively, a laboratory-based assessment of liquefaction triggering potential can be accomplished by applying the representative CSR to the specimen and comparing the number of cycles of loading to liquefaction under this stress ratio to Neq.
If enough specimens are available, laboratory testing can be used to generate the complete cyclic strength curve. The cyclic strength curve still must be related to the specific value of the CRR, however, to use in the liquefaction potential assessment based on Neq. Thus, choosing the correct value of Neq is a key issue in a laboratory-based evaluation of liquefaction triggering. Additionally, it must be kept in mind that laboratory tests evaluate only the liquefaction on an element level (i.e., on the sample being tested) as opposed to the larger liquefiable soil mass present in the field.
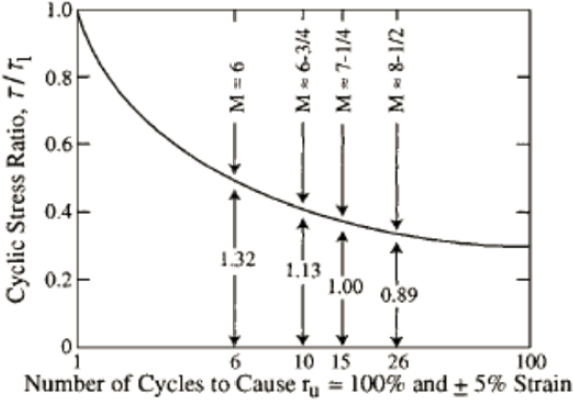
Seed and colleagues (1975b) used a variant of the Palmgren-Miner (P-M) high-cycle fatigue theory (Palmgren, 1924; Miner, 1945) to develop a correlation between Neq and earthquake magnitude from approximately 60 strong motion recordings from North and South America. The Seed and colleagues (1975b) approach to compute Neq consists of taking a weighted average of the “peaks” in an acceleration-time history, wherein the amplitude of a peak was defined as the maximum value of the time history between successive zero crossings (known as the zero-crossing method; ASTM, 2011). Seed and colleagues (1975b) based their weighting function on the shape of the laboratory cyclic strength curve shown in Figure 5.7 and used 0.65 amax, where amax is the peak acceleration in the earthquake record, as their reference value for the amplitude of the peaks in the time history: that is, peaks having an amplitude of 0.65 amax were given a weight of one; peaks having amplitudes greater than 0.65 amax were given weights greater than one; and peaks having amplitudes greater than 0.65 amax were given weights less than one. The resulting relationship between Neq and earthquake magnitude is shown in Figure 5.7. The Neq values in Figure 5.7 have remained the standard of practice for over 20 years (Youd et al., 2001).
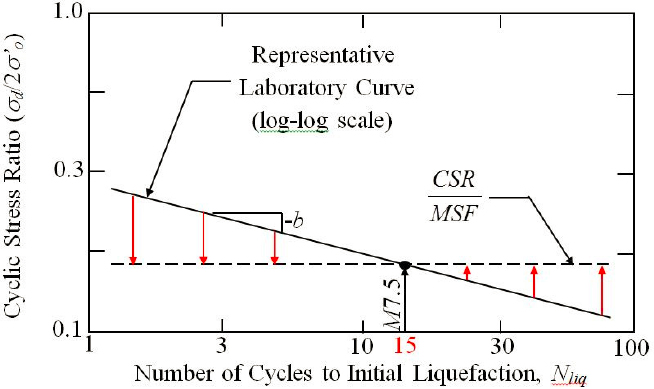
Neq is intimately related to the MSF used in the simplified method for liquefaction assessment described in Chapter 4. Seed and Idriss (1982) derived their MSF values from Figure 5.7 by dividing the CSR at Neq for magnitude (M) by the CSR at Neq equal to 15, the value for Neq for M = 7.5 (the reference magnitude). More recent studies on Neq (and the MSF) rely on the observation that when plotted on log-log axes, the laboratory cyclic strength curve generally plots as a straight line with a slope of -b, as illustrated in the Figure 5.8, and a log-log plot of CSR divided by MSF versus Neq will therefore be a horizontal line (i.e., straight line with the slope equal to zero). The relationship between Neq and MSF is solely a function of the “b-value” in Figure 5.8 (see, e.g., Liu et al., 2001; Green and Terri, 2005; Boulanger and Idriss, 2015). If b and Neq are known, the corresponding MSF is easily derived. Alternatively, Neq values can be derived from the MSF
values. The committee is not aware, however, that reconciliation of Neq values with MSF values derived from field data has not been attempted.
Studies on Neq since 2001 have included defining peaks in an acceleration-time history using alternative approaches: namely, approaches other than the zero-crossing method used by Seed and colleagues (1975b) (see, e.g., Hancock and Bommer, 2005; Stafford and Bommer, 2009); accounting for the effect of multidirectional shaking (see, e.g., Liu et al., 2001; Carter et al., 2014); and accounting for the influence of the soil’s stress-strain response (see, e.g., Green and Terri,
2005; Boulanger and Idriss, 2015). Important conclusions drawn from these studies include that Neq is negatively correlated with the peak ground acceleration (see, e.g., Biondi et al., 2004); that Neq is a function of site-to-source distance (see, e.g., Liu et al., 2001; Green and Terri, 2005; Stafford and Bommer, 2009); and that Neq may vary with depth in the soil profile (see, e.g., Green and Terri, 2005). Green and Terri (2005) questioned the appropriateness of using a high-cycle fatigue theory for computing Neq for liquefaction evaluations. These findings have profound implications, not only for laboratory assessment of liquefaction potential but also for the simplified method itself due to the intimate relationship of Neq and the MSF. If Neq depends on, among other factors, site-to-source distance, peak ground acceleration, response characteristics of the soil, and depth in the profile, then the MSF may also depend on these variables. In this vein, Boulanger and Idriss (2015) proposed MSF values that are a function of soil response characteristics, quantified in terms of the slope (i.e., b-value) of the laboratory cyclic strength curve (see Figure 5.8) and correlated to in situ penetration resistance.
At the present time, there is no consensus on either Neq or MSF values for use in liquefaction triggering analyses. Considering the importance of Neq to both laboratory assessment of liquefaction triggering potential and to the MSF used in the simplified method for liquefaction triggering assessment and their interrelationship, this issue deserves further attention.
Approaches for site-specific liquefaction assessment that employ laboratory testing also include a hybrid approach in which the laboratory test results are used to calibrate a numerical pore-pressure generation model and the numerical model is then used to assess the liquefaction triggering potential of the soil. Such approaches are not well established, but they can provide useful information on major projects where the additional expense is warranted. Cyclic laboratory testing can also be used to determine if a fine-grained soil exhibits what Boulanger and Idriss (2006) described as “sand-like behavior,” and thus are susceptible to liquefaction triggering, or to what they described as “clay-like behavior,” and thus are susceptible to cyclic softening but not to liquefaction.
While laboratory testing to identify factors that influence liquefaction triggering potential and to develop constitutive models can be conducted using reconstituted specimens, the use of reconstituted specimens to establish the liquefaction triggering potential of soil in situ is problematic given difficulties establishing whether the fabric of the soil in situ is reproduced properly. Mulilis and colleagues (1977) showed that samples reconstituted to the same density using different compaction techniques can have cyclic shear strengths that vary by more than a factor of two due to differences in the soil fabric. Some studies, however, have suggested that small strain Vs may be used as an index for soil fabric. Specifically, samples of a given soil reconstituted by various methods to the same Vs have been shown to have similar cyclic resistance (Tokimatsu et al., 1986). This finding has led some investigators to reconstitute samples in the laboratory to the same Vs that was measured in situ, rather than to the same relative density (see, e.g., Wang et al., 2006; Baxter et al., 2008), assuming that the cyclic resistance of the reconstituted samples will then be similar to that of the undisturbed samples. There is no rigorous proof of this assumption, however, and the lack of confidence in the ability to replicate in situ fabric in reconstituted samples remains a major obstacle for laboratory-based approaches to evaluating liquefaction triggering potential. A demonstration that specimens reconstituted to their in situ shear wave velocity have the same cyclic resistance as the in situ soil would likely result in increased use of laboratory testing for evaluating the liquefaction triggering potential of soil in situ.
Physical Model Testing
As described earlier, physical model tests that can be used to study liquefaction triggering include 1-g shake table tests and centrifuge shake table tests. In a shake table test, a soil deposit is created on a platform connected to an actuator that shakes the platform. The actuator typically can be programmed to apply periodic (e.g., sinusoidal), random, or earthquake-like cyclic loads. Most shake tables translate in only one horizontal direction, although some can apply cyclic loads in two orthogonal horizontal directions. Certain shake tables apply vertical, rocking, and torsional loads, but these are generally used to evaluate structural response rather than geotechnical site response (e.g., liquefaction).
A 1-g model relies on gravity to apply body forces to the model. Therefore, soil in a 0.3-meter-tall model on a 1-g shake table behaves exactly like 0.3 meters of soil. Because soil behavior depends in a nonlinear manner on effective overburden stress, the properties and behavior of 0.3 meters of soil cannot be extrapolated to behavior of soil at greater depth. In geotechnical centrifuge testing, the physical model is mounted on a platform (sometimes referred to as a bucket) on the end of an arm that rotates horizontally. The axis on which the bucket swings is also horizontal and oriented perpendicular to the arm. As the arm rotates, the bucket “swings up” such that the body force vector (the resultant of the vertical gravity vector and the horizontal centrifugal acceleration vector) is always perpendicular to the platform. When the rotating arm reaches its terminal velocity—and therefore its terminal centrifugal acceleration—a shake table attached to the platform loads the platform in the same manner as a 1-g shake table loads its platform (i.e., cyclically, in a direction parallel to the base of the platform).
Centrifuge testing is usually conducted at centrifugal accelerations of 20 g or more, resulting in the bucket swinging up into a nearly horizontal position. The benefit of centrifuge model testing is that the body forces in the soil, and thus the length scale of the model, are related to the prototype (i.e., field) values by a factor equal to the resultant of gravity and the centrifugal acceleration (Kutter, 1992). Hence, theoretically, a 0.3-meter-tall layer of soil accelerated to 50 g in a centrifuge will have a model-to-prototype length scale of approximately 50 and thus behave like a 15-meter layer (50 × 0.3 meter) of soil. Such issues as particle size and permeability scaling, however, as well as the boundary conditions in the centrifuge container, can cloud the results of a centrifuge model test.
Both 1-g and centrifuge shake table testing of soil deposits are constrained by the lateral boundary condition in the soil container. Rigid wall containers result in all points along the vertical boundaries of the soil container moving in exactly the same manner horizontally (i.e., not allowing for any relative displacement of horizontal soil layers around the perimeter of the box—unlike a real soil deposit). The rigid walls of the container may inhibit the development of shear stress on the horizontal plane, inhibiting the liquefaction of the soil. The rigid walls may also create multiple reflections of the simulated earthquake waves off the sides of the soil container, resulting in complex stress states that do not represent field stress states. Therefore, both types of shake table tests (1-g and centrifuge) typically employ a laminar box soil container (i.e., a soil container made of a stack of thin, rigid horizontally oriented frames linked by a flexible membrane). The membrane allows them to move relative to each other in a plane parallel to the base of the container (i.e., parallel to the direction of shaking).
As noted above, 1-g model tests are limited by the dependence of liquefaction triggering on the magnitude of the effective overburden stress and the limited magnitude of the effective overburden stress achievable in 1-g models. Findings on liquefaction triggering behavior from a
0.3-meter-tall 1-g model simply cannot be used to infer soil behavior at depths greater than 0.3 m due to the many aspects of soil behavior that depend, in a nonlinear manner, on the effective overburden stress (e.g., strength, stiffness, compressibility, and shear-induced volume change). To be useful for the study of liquefaction triggering phenomena, 1-g shaking tables must be large enough that the stress levels in the soil approach relevant stress levels in the field (i.e., stress levels associated with depths on the order of at least several meters).
A few 1-g shake tables can accommodate models of the requisite size to study liquefaction triggering phenomena. Both the E-Defense shake table in Japan3 and the shake table at the University of California, San Diego4 can accommodate models approaching 10 meters in depth. Only the E-Defense table, however, can test saturated soil deposits for liquefaction studies. The earthquake engineering laboratory at the State University of New York (SUNY) at Buffalo developed a 6-meter-tall laminar box for liquefaction studies under the National Science Foundation’s Network for Earthquake Engineering Simulation (NEES) program.5 While the box has experienced experimental difficulties during development, it is, as of this writing, in a serviceable condition (personal communication, S. Thevanayagam, SUNY at Buffalo, July 19, 2016).
1-g shake table tests may also yield information useful for validating computational models and studying soil-structure interaction mechanisms and patterns of behavior of liquefied soil (e.g., the behavior of pile groups behind quay walls) (Motamed and Towhata, 2010). 1-g shake table tests have also proven useful for investigating the influence of multidirectional shaking and sample preparation effects on liquefaction triggering (Pyke et al., 1974; De Alba et al., 1975; Mulilis et al., 1975). These types of test, however, are subject to the limitations on effective overburden stress discussed above. Even if an appropriate large-scale 1-g shake table is available, the time and cost associated with large-scale testing is high: for instance, it can take over a month and several tens of thousand dollars to prepare and conduct one test. The cost of a series of multiple tests for systematic evaluation of the influence of effects such as particle gradation, relative density, or earthquake magnitude would likely be prohibitive. The use of large-scale 1-g shake table tests for site-specific evaluation of liquefaction triggering is also problematic given issues associated with preparation of a large-scale soil deposit in the model that is representative of the soil in situ (as discussed above with respect to preparation of specimens for laboratory testing).
If it can be demonstrated that the results of centrifuge tests in which liquefaction is triggered are reproducible and representative of field behavior, centrifuge model testing can provide a means of cost-effective testing for systematic evaluation of liquefaction triggering effects and for validating computational models for liquefaction triggering and its consequences. While not inexpensive, the cost of a series of centrifuge tests would typically be an order of magnitude less than the cost of a similar series of large-scale 1-g model tests. Furthermore, large capacity geotechnical centrifuges like that at the University of California, Davis, facility can accelerate models with soil layers on the order of 1 meter tall to centrifuge accelerations exceeding 60 g, corresponding to a 60-meter-deep soil deposit. Nevertheless, reliance on centrifuge model testing to study liquefaction phenomena has been hindered by a lack of standardized protocols for preparing experimental models and conducting tests and by the inability to reproduce test results at different test facilities (Arulanandan and Scott, 1993).
___________________
3 See http://www.bosai.go.jp/hyogo/ehyogo/index.html.
4 See http://nheri.ucsd.edu.
5 See http://nees.buffalo.edu.
Advances in centrifuge testing have led to a better understanding of the factors that influence centrifuge test results. The international Liquefaction Experimentation and Analysis Protocol (LEAP) program has been established to demonstrate that centrifuge model testing can give consistent and reliable results for the study of liquefaction phenomena (Manzari et al., 2014). Issues to be resolved include the influence of model preparation techniques on results; how to address permeability and grain size scaling issues (sand particles in a centrifuge may look like boulders at the prototype scale, and a viscous pore fluid must be used in centrifuge testing instead of water to satisfy permeability scaling); and the influence of boundary conditions associated with the centrifuge soil container (e.g., use of a laminar box versus boxes with hinged walls and other types of containers).
If centrifuge testing can be shown to be reliable for the study of liquefaction triggering, it can provide a means to evaluate many factors that influence triggering, including the same factors investigated with other types of laboratory testing (e.g., the influence of density or relative density, grain size distribution [including fines content], and initial effective stress). Centrifuge testing can also be used to investigate, for example, the influence of nonuniform soil profiles, sloping ground, soil non-homogeneity, and earthquake time histories (e.g., magnitude, duration, the sequence of nonuniform load cycles). Understanding the influence of these factors on liquefaction response can be useful not only for developing methods to predict liquefaction triggering but also for interpreting field data if there is better understanding of the factors that affect the complex response of a field site. With greater reliability of centrifuge testing for predicting liquefaction triggering there can be greater confidence assessing the consequences of liquefaction (Chapter 7) and for validation of computational models (Chapter 8).
FIELD MEASUREMENT OF PORE-PRESSURE GENERATION UNDER DYNAMIC LOADING
In situ measurement of pore-pressure generation during dynamic loading is another alternative for evaluating liquefaction triggering. This approach requires a controlled dynamic loading source and embedded sensors that measure the dynamic loading and the generation of pore pressures in the ground. The two most common sources of dynamic loading are controlled blasting (see, e.g., Charlie et al., 1992; Gohl et al., 2001) and a dynamic vibroseis truck (see, e.g., Rathje et al., 2005; Cox et al., 2009).
Controlled blasting has been used for many years to densify soils, but more recently it has been used as a research tool to induce large excess pore pressures within liquefiable soil deposits to study the response of various in situ structures within the liquefied soil (see, e.g., Ashford and Rollins, 2002; Ashford et al., 2006). Because blasting loads the soil rapidly and induces extreme ground accelerations, it is difficult to relate the blasting load level to an earthquake loading level using a stress-based approach. Thus, controlled blasting has not been used to predict liquefaction triggering at a specific site. This may be less of a limitation, however, for strain-based and energy-based approaches (e.g., Green, 2001; Green and Mitchell, 2004).
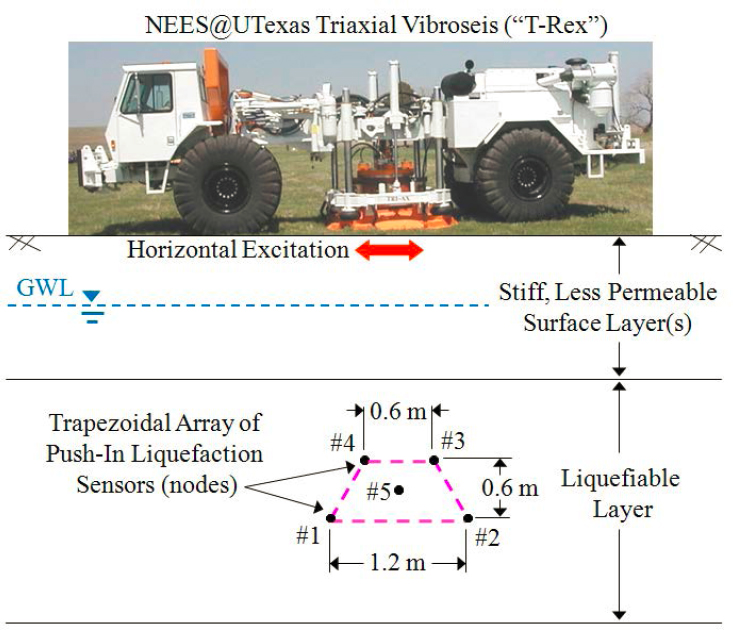
Vibroseis loading has been used to investigate pore-pressure generation characteristics in situ (see, e.g., Chang et al., 2007; Cox et al., 2009), as well as the efficacy of various soil improvement techniques (Chang et al., 2004; Stokoe et al., 2014a). A vibroseis truck applies cyclic loading to the ground surface through a vibrating base plate (see Figure 5.9). Horizontal excitation induces shear waves that can generate excess porewater pressures in the liquefiable layers. The excess porewater pressures are measured by embedded pore-pressure transducers, and the motions from
the seismic waves are measured by accelerations or geophones. The induced dynamic loading can be quantified by the cyclic shear strain amplitude, which is computed from motions measured at two or more locations (Rathje et al., 2004), or by the cyclic shear stress amplitude, which is computed from the derived shear strain and an estimate of the strain-compatible shear modulus (Stokoe et al., 2014b). Unlike laboratory tests, neither the cyclic shear strain nor the cyclic shear stress amplitudes induced by vibroseis loading are constant after porewater pressures are generated. In this sense, vibroseis loading is more similar to the loading applied during earthquake shaking than during uniform cycle laboratory tests. Testing is limited, however, to relatively shallow depths (less than about 3 to 4 meters), and the loading level, whether quantified in terms of strain or stress, is known only after the vibration measurements are processed. Perhaps more importantly, the soil around the embedded instrumentation may not remain undrained during loading because pore pressures are not generated at locations adjacent to the instrumentation array, which results in hydraulic head differences that induce flow. Depending on the hydraulic conductivity of the soil, this drainage effect may be significant, although it has not been investigated thoroughly in vibroseis liquefaction testing. Despite these limitations, vibroseis testing to directly measure the in situ liquefaction resistance has provided valuable insights into liquefaction.
COMPUTATIONAL MECHANICS APPROACHES TO ASSESS LIQUEFACTION TRIGGERING
Computational mechanics approaches to predict pore-pressure generation within an effective-stress site response framework have been used to evaluate liquefaction triggering. Two distinct approaches to predict earthquake-induced pore pressures have been employed (Beaty and Perlea, 2011): (1) a loosely coupled approach that predicts pore pressures based on accumulated strains; and (2) a fully coupled approach that uses a plasticity-based constitutive model to predict both the stress-strain and the pore-pressure response of the soil.
Martin and colleagues (1975) were the first to develop the loosely coupled approach. This model predicts plastic volumetric strain and then converts this value to an equivalent increment in porewater pressure. Alternative forms for the relationship that predicts the plastic volumetric strain have been proposed (see, e.g., Byrne, 1991). The required model parameters are developed from drained laboratory tests measuring volumetric strain and are validated using results from undrained laboratory tests measuring pore-pressure generation. Other models that can be used in the loosely coupled approach relate pore-pressure generation directly with the induced shear strain and number of cycles of loading (see, e.g., Dobry et al., 1982; Vucetic, 1986; and Matasovic and Vucetic, 1993). Numerous investigators have developed energy-based models for pore-pressure generation (see, e.g., Nemat-Nasser and Shokooh, 1979; Davis and Berrill, 1982; Berrill and Davis, 1985; Liang, 1995; Figueroa et al., 1997; Green et al., 2000; Davis and Berrill, 2001; Polito et al., 2008). Models for the loosely coupled approach also have been developed using the relationship between pore-pressure generation and the number of stress cycles of loading (Seed et al., 1976; Wang and Kavazanjian, 1989), but these models are not very robust for predicting liquefaction triggering because they require knowledge of the number of cycles required to trigger liquefaction. The pore-pressure generation models discussed above, or slight variants of them, have been incorporated within effective stress-based site response analysis programs D-MOD2000 (Matasovic and Ordonez, 2011) and DEEPSOIL (Hashash et al., 2012). These programs can be used to predict pore-pressure generation within a given soil profile for a specified earthquake input motion.
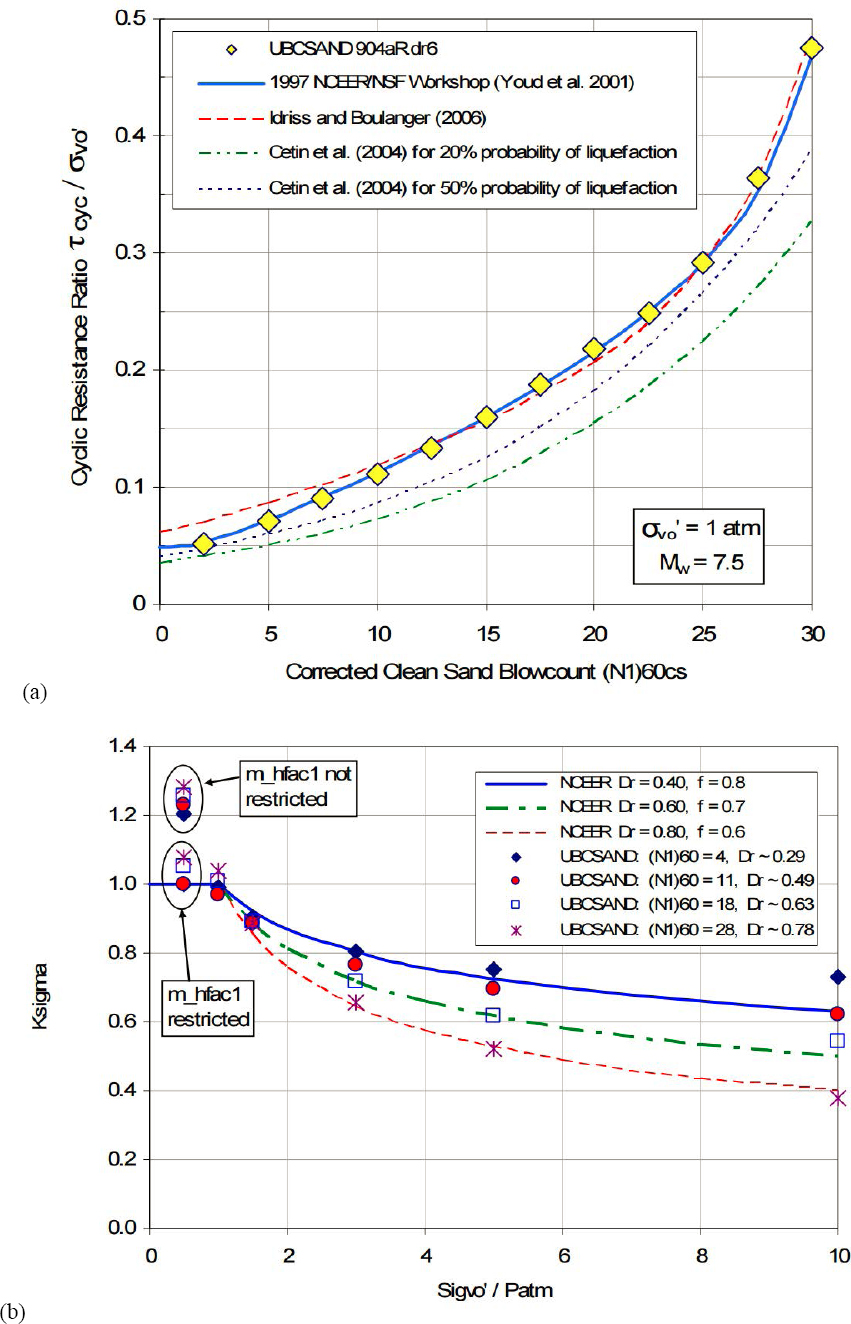
The fully coupled approach uses a constitutive model developed within a plasticity framework to predict the stress-strain and pore-pressure responses within the soil (Chapter 8). Examples of constitutive models developed for this purpose include those developed by Prevost and colleagues (1985), Iai and colleagues (1992, 2011), Cubrinovski and Ishihara (1998), and Dafalias and Manzari (2004), as well as models named PDMY02 (Yang et al., 2003, 2008), UBCSAND (Byrne et al., 2004), and PM4-Sand (Boulanger, 2010; Boulanger and Ziotopoulou, 2013, 2015). Some of these models have been implemented in open source computer programs (e.g., OpenSees) or commercially available (e.g., FLAC) computer programs. These constitutive models typically have a large number of constitutive parameters, but several researchers have developed practical recommendations that relate the model parameters to typical information available from a site characterization. The PM4-Sand model (Boulanger and Ziotopoulou, 2013), for example, has been methodically and transparently calibrated to produce responses consistent with field and laboratory observations of liquefiable soil behavior. The recommended model parameters from such a process are selected so that the models are calibrated to provide numerical results consistent with accepted empirical models for liquefied soil. An example of this calibration process for UBCSAND is shown in Figure 5.10.
In general, all of the pore-pressure generation models discussed above have been implemented within dynamic response computer programs, and their use requires that input acceleration-time histories be specified. They can provide insight into the process of pore-pressure generation within a soil deposit during seismic loading. Nevertheless, there are a couple of unresolved issues when using these models to predict liquefaction triggering. For one thing, there is little documented experience of interpreting liquefaction triggering analyses within the context of an excess pore-pressure ratio (ru) because it is not clear whether a pore-pressure ratio close, but not equal, to 1.0 represents liquefaction as inferred from field evidence. For another thing, it is difficult to obtain the necessary soil properties and model parameters for the analyses.
Input of representative earthquake acceleration-time histories may introduce ambiguity into a computational mechanics evaluation of liquefaction triggering. Different time histories may lead to different conclusions regarding liquefaction triggering. Guidance on this issue is available for structural engineers (e.g., on how many time histories to use and how to reconcile the results from analyses using different time histories), but it may not be appropriate for liquefaction assessment. ASCE/SEI 7-10 (ASCE, 2010) mandates that at least three time histories be used in a time history analysis, and that when less than seven time histories are used, the maximum response from among the individual analyses be considered. When seven or more time histories are used, the average response from among the analyses can be used for design. But, given that the pore-pressure ratio becomes asymptotic as it approaches 1.0, the use of an average pore-pressure ratio from multiple time history analyses is likely not appropriate. As noted above, uncertainty regarding which pore-pressure ratio should be considered indicative of liquefaction triggering may further complicate the interpretation of multiple time history analyses. It is also not clear which approach to selecting representative time histories is correct for a liquefaction analysis when the design acceleration is based upon a probabilistic seismic hazard analysis. Arguments that using a suite of time histories that conform to a uniform hazard spectrum (e.g., that such analyses consider multiple earthquakes simultaneously and that a conditional mean spectrum should be used [Baker, 2011]), as is common when site response analyses are conducted for structural design purposes, are also relevant to liquefaction analyses. Hashash and colleagues (2015) describe the use of two conditional mean spectra, one for a nearby relative small magnitude earthquake and one for a larger but more distant earthquake, to evaluate the liquefaction, lateral spreading, and seismic settlement for a site where the deaggregated hazard data indicated that the earthquake hazard bimodal. In the absence of any guidance on how to address these issues when a computational mechanics approach is used to assess liquefaction triggering and its consequences, the design engineer must use professional judgment.
The most critical shortcoming for the loosely coupled models is the lack of shear-induced dilatancy in them. Without dilatancy and the associated reduction in excess pore pressure, the loosely coupled approach may shield upper layers from the earthquake ground motions when deeper layers liquefy. This “base-isolation” effect may appear beneficial, but it may not be realistic in the field due to lateral variability, shaking due to non-vertically propagating shear waves or surface waves, and the transmission of shaking during instances of dilation-induced stiffening (Anderson et al., 2011). It is important to stress that it is never appropriate to use any effective stress based site response analysis to predict the earthquake-induced CSR for use in a simplified stress-based liquefaction triggering evaluation (see Chapter 4) because the simplified approach ignores the effects of pore-pressure generation.
Effective stress site response analyses are being used in practice with increasing frequency at liquefiable sites (Matasovic and Hashash, 2012). While these analyses have been used primarily to evaluate a site-specific acceleration response spectrum at potentially liquefiable sites, their use leads inevitably to consideration of whether or not the soil at the site will liquefy. As discussed above, however, questions about the interpretation of the results and concerns about the adequacy of these models as the soil approaches liquefaction limit their applicability for predicting liquefaction triggering. Further, although studies have been conducted to evaluate the ability of nonlinear, total stress site response analysis to predict site response (see, e.g., Stewart and Kwok, 2008), few studies have evaluated the ability of nonlinear effective stress models to predict pore-pressure generation, liquefaction triggering, and surface ground motions. Of particular concern is the ability of these programs to predict the pore-pressure response at relatively large pore-pressure ratios, where shear-induced dilatancy can influence the response. Validation exercises performed to date have used centrifuge data (see, e.g., Byrne et al., 2004) and instrumented field sites such as the Wildlife liquefaction array site from the 1987 Superstition Hills earthquake and Port Island from the 1995 Hyogo-ken Nanbu (Kobe, Japan) earthquake (see, e.g., Bonilla et al., 2005; Ziotopoulou et al., 2012). With the availability of additional centrifuge data through NEES, as well as additional field measurements of pore-pressure generation, these validation exercises need to continue. The LEAP project (Manzari et al., 2014) is one example of continuing efforts to calibrate these types of analyses. To demonstrate that these analyses can discriminate between liquefaction and non-liquefaction, these validation exercises need to focus not only on accurately predicting liquefaction and pore-pressure ratios close to 1.0 but also on predicting smaller pore-pressure ratios and non-liquefaction under small to moderate levels of shaking.


