
6
Residual Shear Strength of Liquefied Soil
Liquefaction triggering often reduces the shear strength of a soil so much as to induce damaging and potentially catastrophic displacements (e.g., flow sliding) and bearing capacity failures. The value assigned to the post-triggering large strain shear strength of the soil (hereafter referred to as the residual shear strength) is often the deciding factor when determining if the consequences of liquefaction triggering are acceptable or if remediation is necessary. Theoretically, any continuous seam of liquefiable material could induce lateral spreading or flow sliding regardless of how thin it is. Consequently, the value assigned to the residual shear strength can often result in differences of millions of dollars in the cost of a project.
The residual shear strength of a liquefied soil depends on many factors, including the grain size and grain size distribution of the soil and the initial density (or void ratio) of the soil. The stresses in the ground prior to the earthquake, and the presence of overlying confining layers, are also postulated to affect the residual shear strength of a soil. The post-triggering strength may also change as consequences develop due to effects such as particle rearrangement, excess pore
pressure and stress redistribution, and intermixing of soils during deformation. In view of the conditions that exist in the ground following liquefaction triggering, it is not surprising that researchers have had difficulty both in obtaining consistent, reproducible estimates of residual shear strength from field cases and in reproducing field conditions in the laboratory.
While laboratory testing has been used to estimate the steady state shear strength of soils (discussed in Chapter 2), such testing generally is viewed as unable to replicate the residual shear strength of liquefiable soil in situ (NRC, 1985; Seed, 1987; Stark et al., 1999). The steady state shear strength is a measure of the post-triggering shear strength of a soil under laboratory conditions. Field conditions often do not satisfy the conditions associated with the steady state of deformation, however, because the porewater pressure and void ratio redistribution that may accompany large deformation in the field violate the constant volume condition associated with the steady state. Furthermore, stress redistribution may change shear and normal stress levels in the ground significantly during flow sliding, and the constant strain rate requirement of the steady state strength is rarely, if ever, satisfied.
Because of the inability to replicate field conditions in the laboratory, estimates of residual shear strength are usually based on back analyses of case histories of lateral spreading and flow sliding. Correlations between residual shear strength and either standard penetration test (SPT) or cone penetration test (CPT) resistance have been proposed by a number of researchers, including Seed (1987), Seed and Harder (1990), Ishihara (1993), Olson and Stark (2002), Idriss and Boulanger (2008), Kramer (2008), Gillette (2010), Robertson (2010), and Kramer and Wang (2015). Because of the many factors that affect residual shear strength, back-calculated shear strength is often said to be a system characteristic rather than an inherent material property. Given this assumption, the residual shear strength can be expected to vary from one site to another because of system features such as geometrical configuration, stratigraphy, pre-earthquake stresses, and characteristics of structural interfaces. In addition, a number of flow slide case histories involve soils that slide into bodies of water. Hydroplaning traps water underneath the sliding material, so there is no shear stress on the bottom of the sliding soil. This can be significant when shear strengths are back-calculated.
RESIDUAL SHEAR STRENGTH OF SANDY SOILS
Several researchers have conducted field and laboratory studies to establish relations between the residual strength and parameters such as SPT or CPT resistance, effective stress prior to the earthquake, and fines content. Table 6.1 summarizes the studies on which residual shear strength relationships most commonly used in practice today are based. It should be noted that while these studies involved case histories of flow sliding, the results have sometimes been applied in practice to evaluate the potential for both flow sliding and lateral spreading. Olson and Johnson (2008) found that the level of mobilization of the shear strength they back-calculated from lateral spreading case histories was consistent with that calculated from flow slides by Olson and Stark (2002). This finding is not generally accepted, however, and most investigators have restricted their relationships to flow slides. The applicability of residual shear strength to the evaluation of lateral spreading is discussed in additional detail in Chapter 7.
TABLE 6.1 Studies of Residual Strength Estimates Based on Flow Slide Field Case Histories
| Source | Input Parameters | Remarks |
|---|---|---|
| Seed et al. (1988) | Corrected SPT values. | ExtensionExtension of Seed (1987) with uncertainty. |
| Seed and Harder (1990) | (N1)60-cs. | |
| Olson and Stark (2002) | Pre-earthquake effective stress and (N1)60 with no fines correction. Also CPT correlation. | Database expanded from Stark and Mesri (1992). Found no effect of fines content. |
| Idriss and Boulanger (2007) | Pre-earthquake effective stress and clean-sand corrected (N1)60-cs. | Based on Seed (1987), Seed and Harder (1990), and Olson and Stark (2002). |
| Robertson (2010) | Pre-earthquake effective stress and clean-sand equivalent CPT. | Based on critical state concepts and limited field cases. |
| Wang (2003), Kramer (2008), Kramer and Wang (2015) | Pre-earthquake effective stress and clean-sand equivalent CPT or SPT. | Based on critical state concepts. |
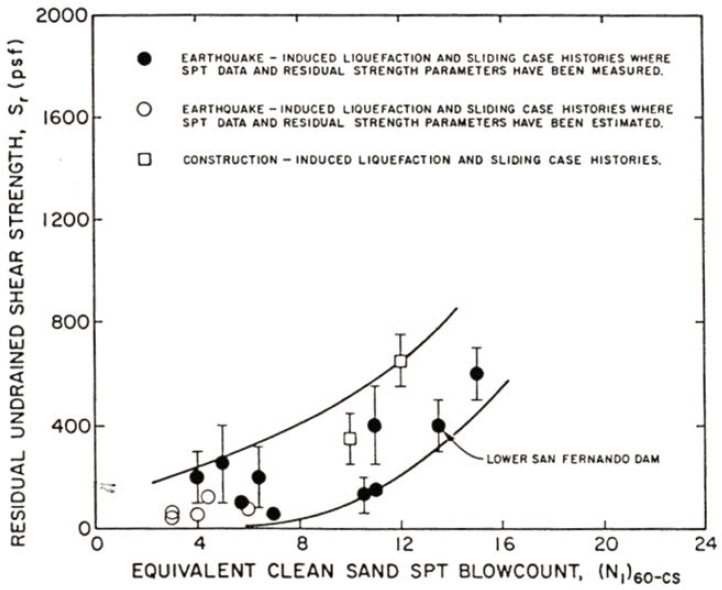
Seed (1987) proposed a correlation between residual shear strength and SPT resistance that related the shear strength back-calculated from 12 case histories of flow sliding to what he termed the equivalent clean-sand normalized SPT blow count, (N1)60-cs, of the soil. The equivalent clean-sand blow count is obtained using Equation 6.1, as follows:
| (N1)60-cs = (N1)60 + Ncorr | (6.1) |
where the value of the correction factor, Ncorr, depends on the fines content of the sand, as shown in Table 6.2.1 The value of (N1)60-cs used in Equation 6.1 should represent the pre-earthquake condition of the soil, although in some cases the values used in establishing the correlation were measured after the earthquake.
TABLE 6.2 Values of Ncorr Proposed by Seed (1987)
| Ncorr | 0 | 1 | 2 | 4 | 5 |
| % fines | 0 | 10 | 25 | 50 | 75 |
Using additional case histories and reanalysis of some of the case histories used in the earlier studies, Seed and others (1988) and Seed and Harder (1990) developed revised residual shear strength correlations that reflect uncertainty in the back-calculated values of residual shear strength. Figure 6.1 shows the relationship proposed by Seed and Harder (1990). The correlation presented in Figure 6.1 is still used by some engineers in practice, despite the wide band of uncertainty associated with the residual shear strength. Figures 6.2 through 6.6 represent the evolution of thinking regarding the relationship between residual shear strength and penetration resistance since development of the Seed and Harder (1990) relationship.
___________________
1 It is important to note that the correction proposed by Seed (1987) to obtain the equivalent clean-sand blow count for the residual strength correlation is different from the clean-sand correction used for the triggering correlations discussed in Chapter 4.
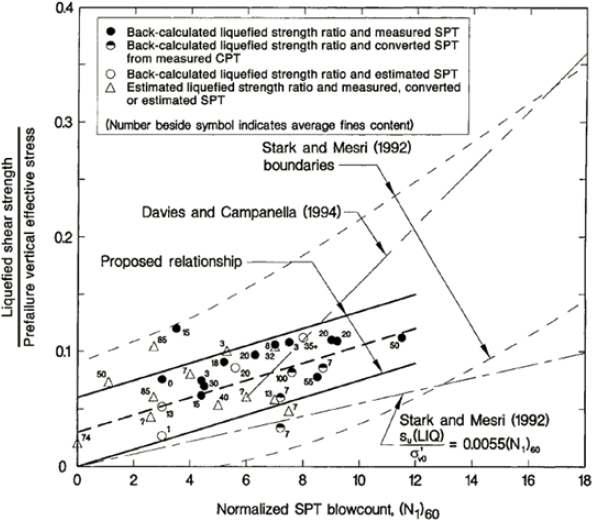
Castro (1987) reasoned that because soil density increases with increasing effective stress and the residual shear strength increases with increasing density, the residual shear strength in the field should increase with increasing pre-earthquake effective stress. Castro (1987, 1991) and Castro and Troncoso (1989) applied this concept to several tailings dams in South America. Using similar logic, Stark and Mesri (1992) correlated the ratio of the back-calculated residual shear strength, Sr, to the initial vertical effective stresses, σ′vo (or σ′vc), to the equivalent clean-sand normalized SPT blow count, (N1)60-cs, for 20 case histories of liquefaction-induced failure. Olson and Stark (2002) used an expanded database to correlate the residual shear strength ratio, Sr/σ′vo, to the normalized SPT resistance of the soil, (N1)60, and to the normalized CPT tip resistance, qc1. They concluded that the residual strength ratio was independent of fines content and recommended that no adjustment be applied to the SPT blow count for fines content. The residual shear strengths back-calculated by Olson and Stark (2002) were generally consistent with those presented by Seed and Harder (1990), with the notable exceptions of the case histories published by De Alba and colleagues (1988) and Marcuson and colleagues (1979), for which the values obtained by Olson and Stark (2002) were significantly lower than those obtained by the original investigators. The relationship between Sr/σ′v and (N1)60 developed by Olson and Stark (2002) is shown in Figure 6.2. Olson and Stark (2002) provide a similar plot for Sr/σ′v versus the normalized CPT tip resistance, qc1, and recommend that this be used in lieu of the SPT plot if CPT data are available (due to the greater reliability of CPT penetration resistance values).
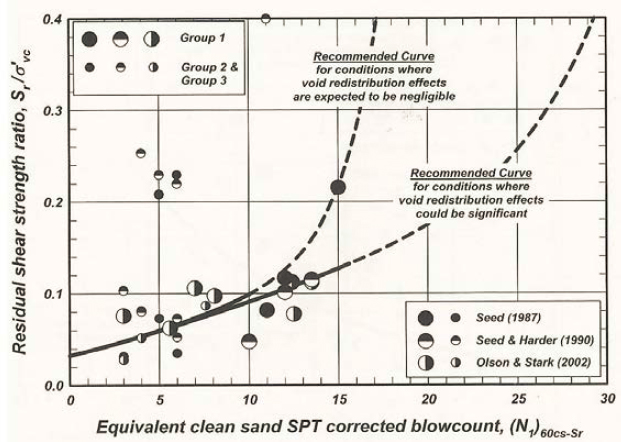
Idriss and Boulanger (2007) used data from Seed (1987), Seed and Harder (1990), and Olson and Stark (2002) to develop a correlation between the residual strength ratio (Sr/σ′vo) and the clean-sand normalized SPT blow count, (N1)60-cs. The correlation by Idriss and Boulanger (2007), presented in Figure 6.3, bifurcates into two branches at normalized clean-sand blow counts greater than about 8 blows/30 cm: one branch for conditions where void redistribution effects are expected to be negligible and one for cases in which void redistribution effects may be significant. In practice, the relationship where void redistribution effects could be significant is usually used given the difficulty in establishing that void redistribution effects are negligible. For (N1)60 values of 10 blows/30 cm or less, the best estimate line of Olson and Stark (2002) agrees reasonably well with the Idriss and Boulanger (2007) relationship. Idriss and Boulanger (2007) also provide a relationship between residual strength ratio and equivalent clean-sand normalized CPT tip resistance, qc1Ncs, drawn to be consistent with their (N1)60cs relationship.
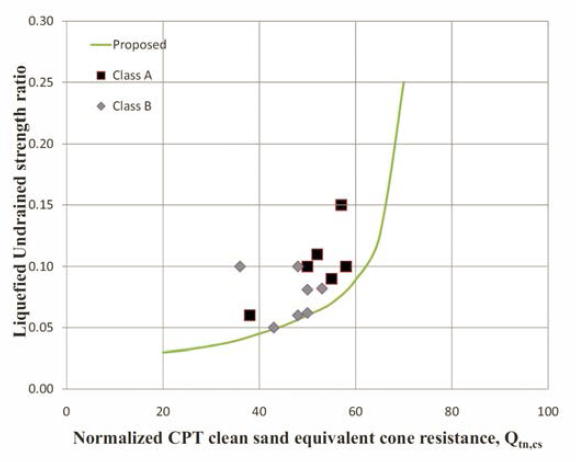
Based on critical state concepts and a limited number of field case histories, Robertson (2010) proposed the correlation between strength ratio and normalized CPT tip resistance shown in Figure 6.4. Consistent with critical state concepts, Robertson (2010) limits flow potential to soils having a normalized CPT tip resistance less than about 70 atmospheres (lower bound estimate). This value of normalized CPT tip resistance corresponds to a state parameter (Ψ) of approximately –0.05, consistent with findings that granular soils with Ψ > –0.05 are expected to experience strain softening and shear strength loss in undrained shear (Jefferies and Been, 2006; Shuttle and Cunning, 2007). The Robertson (2010) curve in Figure 6.4 falls between the best estimate line and
lower bound line shown by Olson and Stark (2002) for CPT normalized tip resistance for clean-sand values less than 60 atmospheres (normalized tip resistance for clean-sand values less than about 6 MPa) and then trends sharply upward, becoming asymptotic at roughly the same penetration resistance as the Idriss and Boulanger (2007) curve for conditions when void ratio redistribution effects are expected to be negligible.
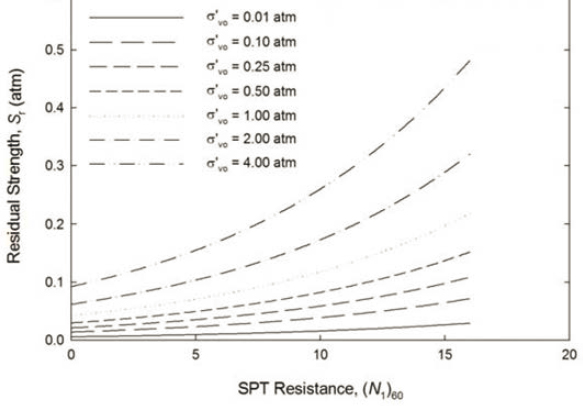
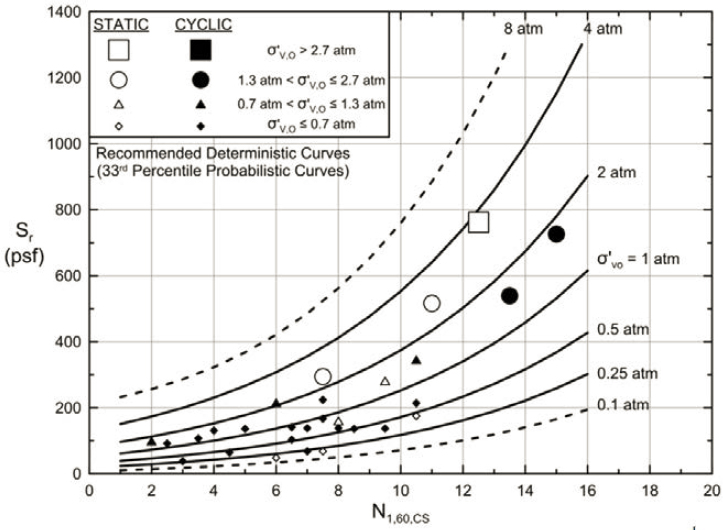
The previously described procedures (see, e.g., Olson and Stark, 2002; Idriss and Boulanger, 2007; Robertson, 2010) assumed the ratio of the residual strength to the pre-earthquake vertical effective stress linearly related to a resistance parameter (e.g., SPT blow count or CPT penetration resistance) value. That assumption implies that lines representing the critical state void ratio, isotropic consolidation, and the undrained steady state shear strength are parallel on plots of void ratio versus log effective stress. As was shown in Figure 2.5, however, the steady state line generally is somewhat steeper than the consolidation curve is, which, in turn, suggests that the soil becomes more contractive (i.e., the state parameter increases) with increasing effective stress. Wang (2003), Kramer (2008), and Kramer and Wang (2015) defined the ratio of the residual strength to the pre-earthquake vertical effective stress as a nonlinear function of the normalized penetration resistance and the magnitude of the pre-earthquake effective stress. Like Olson and Stark (2002), Kramer (2008) and Kramer and Wang (2015) did not find a systematic variation in the residual shear strength with fines content. Figure 6.5 shows the variation in the median estimate of the post-liquefaction strength, Sr, with (N1)60 and with initial vertical effective stress predicted by Kramer (2008). Gillette (2010) also presented a model in which the residual strength ratio varied with effective stress. Figure 6.6 relates the post-liquefaction strength to both the penetration resistance and the initial effective vertical stress Weber (2015). Note that these curves, recommended by Weber (2015) for use in deterministic analyses, represent the 33rd percentile values from a probabilistic analysis.
The concept of a nonlinear, stress-level dependent relationship between the residual strength and penetration resistance seems logical based upon critical state concepts. Nevertheless, the problems noted previously in determining residual strength from laboratory test data and the steady state shear strength must be kept in mind. More field data supporting this concept are needed.
RESIDUAL SHEAR STRENGTH OF GRAVELLY AND FINE-GRAINED SOILS
There are few documented case histories of flow failures (and lateral spreads) involving liquefied gravelly or fine-grained soils. Thus, there is a limited basis for the selection of residual shear strength values for stability analysis for those types of soils. The few available data for gravelly soils appear to be consistent with the assumption that the resistance to liquefaction triggering and the residual strength of gravelly soils are similar to those of sandy soils of the same equivalent penetration resistance2 (see, e.g., Harder, 1988; Andrus and Youd, 1989). Whereas available laboratory data indicate that the triggering resistance of gravelly soils is comparable to that of sands of similar relative density, those data also indicate that the post-triggering deformation potential of gravelly soils in undrained cyclic shear laboratory testing is significantly less than that of sands at the same relative density (Kokusho, 2007). This suggests that it may be conservative to assume that the mobilized residual strength of gravels during lateral spreading is similar to that of sands of the same equivalent penetration resistance. There are two kinds of soil classified as gravel: one with gravel particles floating in a matrix of finer soils (e.g., sand), and one where the gravel particles form the soil skeleton (i.e., soil classified as sand with enough gravel to form a stable soil skeleton, including possibly gravelly sands). Laboratory testing has typically addressed the second type of gravel, and not much is known about the first type. It is not clear that the conclusion about the deformation potential of gravel being less than that of sand at the same relative density applies to gravel embedded in a sand matrix. Because studying the behavior of gravelly soils in the laboratory requires large-scale tests, additional case histories may be required to resolve this issue.
___________________
2 Equivalent SPT blow count corrected for the effects of gravel particles or obtained from correlations with the Becker penetration test blow count.
Besides the finding that there is little field evidence of flow sliding in fine-grained soils (e.g., in low-plasticity silts and clays),3 the only potentially relevant data on flow sliding in these types of soils is the observation that flow slides have occurred in fine-grained mine tailings deposits (see, e.g., Castro and Troncoso, 1989; Castro, 1991). The relevance of findings on the behavior of fine-grained mine tailings to the behavior of natural fine-grained soils is uncertain, however. Additional research on this, and on the potential for flow sliding and lateral spreading in fine-grained soils in general, is needed.
DEALING WITH UNCERTAINTY
The limited number of available case histories and the substantial uncertainty associated with the load and resistance parameters characterizing flow failure and lateral spreading case histories result in considerable uncertainty in the correlations between residual shear strength and penetration resistance. In addition, the many factors that control the residual strength of liquefied soil masses in the field suggest that there will always be large scatter in any correlation between residual shear strength and a simple measure of penetration resistance or a combination of penetration resistance and initial effective stress. The committee notes that Figure 6.1 by Seed and Harder (1990) and Figure 6.3 from Olson and Stark (2002) provide some information on the uncertainty of their residual shear strength estimates. Providing such information to help guide engineers who wish to use these correlations is good practice. The model by Kramer (2008) and Kramer and Wang (2015) allows for quantitative estimation of uncertainty in residual strength considering scatter in the case history data and uncertainties in SPT resistance and vertical effective stress. Even without considering the uncertainties in SPT resistance and vertical effective stress, the standard deviation of the logarithm of the residual strength ranges from about 0.36 to 0.74 (a large range).
The large uncertainty in the evaluation of residual shear strength is often accommodated by use of a conservative estimate of strength (e.g., Seed et al., 2003; Idriss and Boulanger, 2008). While this may serve to ensure safe performance in future earthquakes, it may also result in unnecessary and uneconomical levels of remediation. While it is likely there will always be considerable uncertainty in residual strength relationships due to the factors discussed above, some sources of uncertainty may be reduced or eliminated through further study, among them reanalysis of available case history data, collection of additional and more detailed case history data, and laboratory and physical model testing. Examples of ways to reduce uncertainties include
- Evaluating the residual shear strength ratio as a nonlinear function of overburden stress, as suggested by Kramer (2008) and Kramer and Wang (2015), and employing critical state soil mechanics principles to guide how the relationship should look.
- For gravelly soils: evaluating reported incidents of flow sliding and lateral spreading from the 1964 Good Friday Alaska Earthquake (McCulloch and Bonilla, 1970), supplemented by additional field investigation as necessary.
- For fine-grained liquefiable soils: laboratory and physical model testing to establish the relationship between the post-earthquake residual strength; the residual strength measured by monotonic loading of cyclic laboratory tests after the soil liquefies; and the large
___________________
3 Clays with very high sensitivity: for example, quick clays (Mitchell and Soga, 2005), also susceptible to large flow slides, are usually triggered by static loading and are outside the scope of the present study.
- deformation shear strength of soil monotonically loaded in the laboratory using triaxial and simple shear tests and from field vane shear testing; as well as to investigate the relevance of data on the residual strength of fine-grained mine tailings to natural fine-grained soils.
Most importantly, as discussed in Chapter 3, collection of additional well-documented case histories of lateral spreading and flow sliding in all types of soils and geologic environments is a critical need.
In the future, it may be possible to address the issue of residual shear strength as a system response through the use of the computational mechanics tools discussed in Chapter 8 of this report, combined with accurate modeling of the key features that determine the response of a system involving soil liquefaction. This capability, however, is well beyond the present state of the practice. At present, given the difference in approaches used to characterize the undrained residual strength and the large uncertainty associated with residual strength values, the use of multiple correlations when assessing the undrained residual strength of a liquefiable soil is warranted.


