
Appendix C
Defining and Measuring Institutional Quality in Higher Education
Jordan Matsudaira Cornell University
November 2015
“Is college worth it?” In the past several years nearly every major news outlet in the United States has run a story posing some variation of the question.1 Rising tuition prices and student debt levels have increased the public’s concern over whether college investments are worth the money, and recent revelations of fraud and deceptive practices by large college chains have shed light on the reality that not all universities contribute positively to students’ success, and fueled calls for greater accountability for institutions receiving public funds. It may seem paradoxical that skepticism over the quality and value of postsecondary education has intensified in recent years, as the college earnings premium has risen over the past several decades and is currently near record levels.2 But while a deep body of research has answered the value proposition “is college worth it?” with a resounding “yes” on average—that is, on average the return to a college degree is not just positive but very high relative to other investments a person might make—this is a comforting answer to the wrong
___________________
1 Among many others, see http://www.nytimes.com/2014/05/27/upshot/is-college-worth-itclearly-new-data-say.html; http://www.washingtonpost.com/news/wonkblog/wp/2015/01/30/college-is-worth-it-if-yougraduate-on-time/; http://www.economist.com/news/united-states/21600131-too-many-degrees-are-waste-money-return-higher-education-would-be-much-better; http://www.forbes.com/sites/michakaufman/2015/03/20/is-college-still-worth-it/; and http://content.time.com/time/interactive/0,31813,2072670,00.html.
2 The college earnings premium is the ratio of the average earnings of college graduates to the average earnings of those with only a high-school degree. See Autor (2014) and Baum (2014) for recent tabulations. The college earnings premium rose from the late 1970s to about 2000, but has been relatively stable since.
question. For families choosing a college and for policymakers targeting support or sanctions to poorly performing institutions, the relevant question is whether a particular college is “worth it,” or which of a set of colleges is most “worth it.”
Unfortunately, there are currently few institution-specific indicators of quality suitable either for informing college choice or for use in policies aimed at improving accountability for institutions of higher education. In part, the lack of institution-specific quality information may be because the notion that attending college is anything but “the surest ticket to the middle class”3 has only recently been called into question. It is telling, for example, that the primary federal measure of institution “quality”—the graduation rate—measures only whether students complete their course of study, effectively taking for granted the benefits associated with doing so. In recent years a burgeoning private industry of college rankings and some state higher education administrative database tools have made richer information available about college attributes and performance. However, a) too little of this information is currently based on student outcomes—which I argue below is essential for measuring quality—is available; b) causal effects of institutions on outcomes inform almost none of these measures; and c) many data elements are not comparable across institutions due to different conceptual definitions and populations covered in different data sources.
There are reasons for the limited progress in developing college quality measures. Colleges and the students they serve have myriad and diverse goals, and many of these are intangible and not readily subject to measurement or quantification. But this is changing: new administrative data is increasingly available through the efforts of federal and state governments, private data collections, and institutional consortia that link various student outcomes to the educational institutions they attended. It is thus an opportune time to attempt to take stock of the current landscape of quality information available, and to begin to outline a research agenda to fill in the considerable gaps that exist in information to guide both college choice and public policies.
This paper aims to provide background for thinking about such an agenda. Below, I first suggest a framework for defining institutional quality that acknowledges both that quality is multidimensional and can differ for students at the same institution. Based on this definition, I discuss some of the properties relevant for evaluating the utility of different quality indicators. Next, I provide a brief overview of research, primarily in the field of economics, on college quality. Finally, I conclude with a sketch of some priority areas that future research should address to build better indicators and discuss some of the associated challenges. As I clarify below, I focus primarily on the need and challenges of developing better quality indicators to guide college choice and to
___________________
3 President Obama, in remarks announcing a proposal to make community college free. See https://www.whitehouse.gov/the-press-office/2015/09/12/weekly-address-new-college-scorecard.
inform accountability efforts, and thus consider primarily quality information that could be produced consistently for broad sets of institutions. Institutions may also benefit from better quality information to guide benchmarking and improvement efforts, but I comment only briefly on quality metrics and issues for this purpose. Additionally, in this paper I focus on institutional quality measures, but the framework here is general and could in principle be applied to smaller units within institutions, such as programs of study or even courses. Whether measuring quality at a more disaggregated level is desirable or feasible, however, deserves further discussion, as I discuss below.
DEFINING QUALITY IN HIGHER EDUCATION
In a 2001 report, Crossing the Quality Chasm, the Institute of Medicine (IOM) proposed a definition for health care quality that, suitably adapted, provides a useful starting point for defining quality in higher education: “The degree to which education services increase the likelihood of desired education outcomes.” The heart of this formulation is that quality is defined in terms of the causal impact that exposure to some educational experience (e.g., attending college A, or studying engineering at college B) has on some set of outcomes that is valued by the student or society more broadly (e.g., deepened knowledge of a subject area of interest; higher earnings; a reduced probability of criminal victimization, etc.).4 The IOM definition of health care quality also included consideration of whether health services “are consistent with current professional knowledge.” While process-oriented considerations might be valued per se (i.e., regardless of whether they affect student outcomes) in some conceptions of education quality, I ignore such issues below.
The most important feature of this view of college quality is that it is measured based on student (and broader societal) outcomes. Two observations about the current landscape of commonly used quality information follow immediately. First, much of the information about college performance currently available is based on input measures, such as faculty-student ratios, expenditures, or student test-scores. As I discuss below, some of these inputs may indeed have a causal impact on student outcomes and thus be useful proxies for quality. It is nonetheless important to keep inputs and practices (e.g., such as whether institutions provide counseling, link financial aid incentives to performance, etc.) conceptually distinct, and to verify their link to outcomes before accepting their value as quality measures. Second, measures of program completion are not direct measures of quality unless completion is valued as an
___________________
4 Education researchers commonly refer to this causal impact as an institution’s “value-added.” An important issue for measuring value-added is that the causal effect of attending college A is defined relative to some counterfactual, such as not attending college at all, or perhaps attending some other ‘reference’ institution. In this discussion, I assume the counterfactual is well posed and well understood (e.g., with quality measured as the effect of attending each institution relative to stopping one’s education at a high-school degree).
outcome per se. Graduation rates convey important information about the exposure of students in a cohort to an institution’s educational offerings, but treating them as quality information is akin to equating the efficacy of a pain medication with the fraction of those prescribed it that take the medicine. It may be that graduation rates convey quality information indirectly, insofar as students more satisfied with the quality of their education may be more likely to complete it, but the existence of this link should not be taken for granted.
Several other aspects of this definition deserve mention. First, college quality is multidimensional since there are myriad outcomes that students and society desire colleges to affect. For example, a recent survey of prospective and newly enrolled students conducted by Harris for New American Foundation asked respondents about the importance of 12 different “reasons to go to college.”5 A majority of students responded that 11 of the 12 options were “important” or “very important” (the top two of four response options). Of the options presented, the top three reasons were all related to labor market outcomes: “to improve my employment opportunities,” “to make more money,” and “to get a good job” with between 89 and 91 percent of respondents saying those were “important” or “very important.” Learning “more about a favorite topic or area of interest” or “more about the world” also rated highly, with 85 and 74 percent of respondents, respectively, saying those were “important” or “very important.” Finally, personal development (“to become a better person” and “to improve my self-confidence”) and improving the lives of their children also rated as important reasons to attend college. Other surveys, such as the CIRP Freshman Survey, asking why current students chose the college they did reveal similar priorities.6
Similarly, the impact of attending a particular college on a given outcome (say, the probability of becoming a doctor) may depend on a student’s academic preparation, interests, etc. and so an institution’s quality may be heterogeneous across different types of students. For example, some institutions might devote extra resources to serving students lacking college preparation and thus have higher quality—a greater impact on their future earnings, for example—for such students, even if they might have a less positive impact on more affluent students relative to other institutions.7 There are many student characteristics that might interact with institution quality, but the student’s academic preparation, interests, and career goals seem particularly relevant.
___________________
5 Details about the methodology and the survey instrument can be found here: http://devedcentral.pantheon.io/wp-content/uploads/2015/05/Harry_Poll_Survey_Instrument-FINAL.pdf.
6 See for example Tables on pages 38 and 41 of Eagan, Kevin, et al. (2014). Los Angeles: Higher Education Research Institute, UCLA. The American Freshman: National norms fall 2014.http://www.heri.ucla.edu/monographs/TheAmericanFreshman2014.pdf.
7 For example, a recent New York Times article suggests that Xavier University particularly excels in helping black students to get into medical school and become doctors. See http://www.nytimes.com/2015/09/13/magazine/a-prescription-for-more-black-doctors.html.
With only the considerations mentioned thus far, we already have a complex framework for defining college quality. If we imagine an exhaustive list of J education outcomes and a set of K types of students, then the quality of a particular institution has J x K dimensions. That is, to fully describe an institution’s quality we need to consider the causal impact that attending that institution has on each of the J different outcomes for each of the K different types of students. In many cases, a single summative measure of an institution’s quality is called for. It is natural to view such a measure as a weighted average of these J x K measures of institutional quality. Restating this with just a bit of formalism, we can measure institution i’s quality, ![]() , as
, as
![]()
where ![]() represents the causal impact of attending institution i on outcome j for students of type k, and wjk is the weight assigned to that outcome in constructing the overall measure of quality. These weights will depend on context and the intended use of the quality information, and will generally require judgements about the relative merit of each outcome.
represents the causal impact of attending institution i on outcome j for students of type k, and wjk is the weight assigned to that outcome in constructing the overall measure of quality. These weights will depend on context and the intended use of the quality information, and will generally require judgements about the relative merit of each outcome.
In discussions of quality, issues of affordability and value are sometimes blurred with outcomes so I clarify use of those terms here. The “value” of a college is a function of its quality (i.e., its causal impact on outcomes over a student’s life) relative to its price (including opportunity costs like foregone earnings)—that is, what you get relative to what you pay. Since the price of college to students can differ from the true resource cost of providing education, and not all benefits of education accrue to the individual receiving the education, the value of college or any other educational experience to students can differ from the value provided to society.
DESIRABLE PROPERTIES OF QUALITY INFORMATION
The ultimate goal of developing better quality indicators for higher education is to enable better decision-making on the part of prospective students, higher education officials, and policy makers to improve the quality of education that institutions offer, or to guide students to institutions offering better quality. Each of these consumers of quality information—that is, students vs. higher education officials vs. policymakers—is likely to find different sorts of information useful.
Prospective students and their families are looking for information to guide their college choices, by considering which institution will best contribute to attaining their educational goals. The relevant information for students is thus an estimate of the set of causal effects on various outcomes of each institution for students like them (i.e., with the same “type” k). This is a forward looking measure, in the sense that data on past students’ outcomes must be used to forecast the outcomes each type of student is likely to experience at each institution. “Good” quality information in this setting is information that
provides an accurate forecast (e.g., low mean-squared forecast error) of the outcomes a student can expect if they attend each institution. It is worth noting the obvious points that quality information is more valuable the more the outcomes are salient for students, and the more consistently quality is defined for all institutions being considered.
Policy makers, on the other hand, may want to use quality information to build accountability schemes that explicitly tie the receipt of public funds to institutions’ performance. Recent state efforts to develop “performance based funding (PBF)” systems are perhaps the most developed initiative of this kind, with articulated formulas linking the distribution of funds to different institutions as a function of credit accumulation, degrees awarded, grant funding received, and job placements among other outcomes. Similarly, eligibility to receive federal Title IV payments is dependent on cohort default rates for all institutions and on average debt-service payments relative to average annual earnings for “gainful employment” programs. These types of information are backward looking, in the sense that rewards (or sanctions) depend on whether an institution’s past performance met some quantifiable benchmarks. The information needs of such schemes might overlap with the quality information useful to prospective students, but the main criteria for “good” information is whether it provides incentives for institutions to improve their quality (and avoids inducing undesirable behavior changes). Moreover, while savvy consumers might be best served by having a variety of measures corresponding to different dimensions of each institutions’ quality to weigh according to their own preferences, accountability schemes generally require an explicit method of combining these measures into a single index of quality—for example, in the extreme, “eligible” or “not eligible” for Title IV participation.
From the standpoint of both prospective students and policymakers, we can enumerate several other desirable properties of quality measures. The core part of our definition of quality is that it is based on a causal effect of an institution on education outcomes. If measures of college performance mirror the predetermined characteristics of the students those colleges enroll, then that information would provide a misleading (or “biased”) forecast of expected outcomes to prospective students whose characteristics might differ. Moreover, we generally do not want to reward (sanction) institutions for selecting more (less) economically advantaged or academically prepared students who are likely to experience better (worse) outcomes. One reason is that measures that reflect such “selection” of students encourage institutions to alter the people they serve to achieve gains in measured performance, potentially undermining access goals. Just as the outcomes in high-stakes health care accountability schemes are risk-adjusted to mitigate doctors’ incentive to avoid sicker patients (i.e., to “cream-skim”), and teacher quality measures in K-12 education take into account the prior achievement levels of the students they serve, quality measures in higher education need similar kinds of adjustments in order to isolate the causal impacts of institutions on students’ outcomes.
To illustrate the issue, data from the College Scorecard show that Cornell University’s alumni (who received Title IV) have median earnings of nearly $71,000 thousand 10 years after beginning their studies, while SUNY Cortland’s former students earn about $45,000. Should a student who has been accepted to both believe his expected difference in earnings is $26,000? Almost surely not. SUNY Cortland students are much more likely to come from low-income families (eligible for Pell grants) and have much lower SAT scores, and the factors behind these disparities also contribute to their lower earnings. The raw outcome differences can thus mislead prospective students about the quality differences between schools—a more useful set of quality measures might be the predicted earnings of a student with average characteristics (e.g., family income, SAT scores, etc.) at each institution from a regression model. This would likely lead to a higher earnings measure for SUNY Cortland and a lower one for Cornell, compressing the difference.
This type of adjustment is controversial: many higher education stakeholders believe that “risk-adjustment” institutionalizes lower standards for subgroups of students likely to have lower outcomes—often low-income and minority students. This is a valid concern that should be considered in developing thoughtful accountability schemes, but it should not prevent the development of quality measures.
A second point is that quality indicators should be reliable—in the sense that they are stable from year to year. Analyses by the Council of Economic Advisers (CEA, 2015) suggest institution-level outcomes are highly reliable since most institutions have large numbers of students in the cohorts generating the data for most performance metrics. But smaller institutions or metrics covering programs within institutions can be highly variable if they are based on few students. Researchers have noted that this kind of variability can both be misleading to potential students and cause accountability schemes to focus penalties or rewards on small institutions whose outcome measures are most variable.
Information on student outcomes must balance being relevant with being timely. For example, earnings measures based on the initial years after students leave college may not be indicative of their lifetime earnings outcomes, and may be distorted by student’s decisions to enter graduate school or pursue other education programs that are likely to improve their long-term earnings. On the other hand, if earnings are measured many years in the future then they will capture institutional quality with a significant lag. If institutions and the students they serve are changing, the resulting measures may thus not provide a good forecast of prospective students’ outcomes. Moreover, for accountability purposes if an institution is not performing well we want to be able to have measures capable of detecting problems rapidly, so that resources can be targeted for improvement, or so sanctions can be applied in a timely fashion.
A final dimension to consider is whether the quality indicators provide guidance to facilitate improvement efforts. While information on student outcomes is fundamental to understanding institutional quality, value-added
measures can have a black-box character to them. Documenting inputs and processes across institutions hold the promise of pointing to specific areas that institutions might target to improve their students’ outcomes.
AN OVERVIEW OF RESEARCH ON COLLEGE QUALITY
In this section I provide a brief overview of the literature, primarily in economics, that has attempted to assess the importance of college quality in determining student outcomes. What progress has been made in this literature developing measures of college quality that have the properties described above? Unfortunately, the answer is relatively little until quite recently, with most attention from economists having been devoted to addressing the methodological challenge of isolating the causal impact of postsecondary institutions on outcomes. Differences in students’ academic preparation, family background, career interests, and differences in geographic factors like the strength of local labor markets can all lead to differences in student outcomes in and after college that may have nothing to do with institutional quality. To address these selection biases, the literature has struggled to identify settings that approximate experiments where similar groups of students end up at different institutions, allowing a comparison of their outcomes to shed light on differences in the institutions’ quality.
Early research on college quality in economics focused on estimating the effect of particular dimensions of college quality on student outcomes. Using student-level data on college attended, graduation, and measures of earnings from a survey (such as High School and Beyond, College and Beyond, the National Longitudinal Survey of Youth, or the National Education Longitudinal Study, etc.), researchers attempted to establish a correlation between proxies for college quality and the students’ outcomes. Several proxies have been examined in the literature, including freshman SAT/ACT scores, selectivity rankings (e.g., from Barron’s), information on price of attendance, average professor salaries, faculty-student ratios, and indices combining combinations of these measures.
The main methodological challenge confronted by this literature is that more affluent students and those with stronger academic backgrounds are likely to sort into more selective (or higher in other dimensions of quality) schools. Since such students are likely to have high graduation rates and labor market outcomes regardless of where they attend college, there is a tendency for more selective institutions to have better average student outcomes simply because they enroll more advantaged students. To disentangle this student “selection effect” from institutional quality effects, most studies in economics have relied on either multiple regression analysis (James, Alsalam, Conaty, and To, 1989; Loury and Garman, 1995; Brewer and Ehrenberg, 1996; Monks, 2000; Long, 2008) or matching techniques (Black and Smith, 2004) to control for differences in the types of students attending different institutions. The particulars vary depending on the information available in the data, but most studies control for some measure of student academic preparation such as student age, gender, race, high
school GPA and/or SAT or ACT scores and family income background. Using one of the richer datasets available, Long (2008) additionally controls for parents’ marital status and education levels, family income, number of siblings, a variety of neighborhood characteristics, and an index of the student’s high school quality. To the extent that students do not differ in unobservable ways that affect their outcomes conditional on the set of information included in the regression model, the estimates of college quality will be unbiased.
Studies employing versions of this research design have found evidence that attending colleges with higher student SAT scores increases students’ graduation rates but has more mixed effects on wages. The pattern of these results is mixed across data sets, measures of quality, empirical strategy, and outcome measure. Moreover, an influential pair of studies by Dale and Krueger (2002, 2011) suggests that the apparent quality effects in the analyses are driven by unobserved differences in students’ academic background across schools. Using data from College and Beyond, Dale and Krueger are able to control for students’ “choice sets”—that is, the set of institutions to which students apply and are accepted—which they argue better controls for unobserved differences in both students’ academic background and interests that might affect their future outcomes. Adding such control variables results in estimates of the effect of college quality (measured by student SAT scores) on post-college earnings that are not significantly different from zero for most students, with the exception of black and Hispanic students and students whose parents have lower education levels, for whom the effects remain positive and statistically significant.
The work above generally provides support for the notion that college quality matters, and suggests a candidate set of attributes that may be correlated with institutional quality. Black and Smith (2006) critique this literature, however, pointing out that the methodology used by these studies rarely establishes whether a particular input has a causal impact on student outcomes, or the extent to which overall institution quality affects outcomes. Since these studies tend to use only a small set of college attributes, it is unclear whether studies are measuring the causal impact of a particular college characteristic—such as the faculty student ratio—or the combined impact of other college inputs that might be correlated. And since these inputs are only noisy proxies for overall quality, estimates of the impact of quality will tend to be attenuated due to measurement error
The majority of work attempting to quantitatively measure college quality—in the causal sense used in this paper—estimates average outcomes for students at each institution, adjusted for differences in preexisting characteristics that might affect their outcomes as in the literature described above. Most of this work relies on aggregate institution-level outcomes, like graduation rates or average earnings, and adjusts those measures using aggregate institution-level student characteristics, such as median SAT scores, the fraction of students eligible for Pell grants, etc. In these studies, regression or matching techniques are used to estimate the predicted relationship between student and institution
characteristics and student outcomes, and institutional quality is measured as the difference between their actual and predicted performance. Many college rankings publications use this methodology to estimate regression adjusted graduation rates, including U.S. News and World Report, Washington Monthly, and Forbes, and more recently Money and The Economist, among other outlets, have used similar methods to estimate adjusted earnings (or “value-added”) measures for colleges.
To give a heuristic, if overly simplified, sense for how the technique works, Figure C-1 depicts the relationship between 6-year graduation rates for first-time, full-time students and the percentage of students receiving Pell grants at 4-year institutions based on IPEDS data. As might be expected, there is a strong negative correlation between the family income background of the student body and their graduation rates: for example, institutions where 80 percent of students receive Pell grants have graduation rates that are more than 35 percentage points lower on average than institutions where only 20 percent of students receive Pell grants. Since it would be unfair, and perhaps create incentives to reduce enrollment of lower-income students, to attribute graduation rate difference between these groups of institutions to differences in their quality, regression adjustments are used to “level the playing field.” That is, regression analysis is used to predict the graduation rate we would expect given the percentage of Pell recipients the institution has, and institutions are judged based on whether they exceed this “expected” level of performance. For concreteness, the figure highlights two institutions—Tulane University and University of Texas at El Paso (UTEP)—and the solid line in the Figure displays the predicted values from a regression of graduation rates on percentage Pell.8 Despite having a 37 percentage point higher graduation rate, Tulane has lower measured quality (i.e., the vertical distance from the solid regression line), since the regression suggests that its graduation rate should be even higher than UTEP’s, given how advantaged its student body is in comparison.9
In practice, researchers and other college ratings publishers adjust outcomes for a wide range of student and college characteristics beyond just the fraction of students receiving Pell grants. The appropriate set of variables to use for adjustment should include all predetermined student characteristics that affect student outcomes, such as academic ability, family income, and demographic measures. Most studies use some permutation of SAT or ACT scores, the admission ratio, or other (e.g., Barron’s) selectivity ranking; information about students’ high school (HS) or HS performance (e.g., average class rank); the percentage of students in the college receiving Pell grants or another measure of
___________________
8 The relationship is modeled as quadratic in the figure. It should be apparent from inspection that different assumptions about the functional form of the relationship can dramatically alter institutions’ adjusted performance.
9 In particular, it should be the same vertical distance above the regression line (at Pell equal to 11 percent) as UTEP.
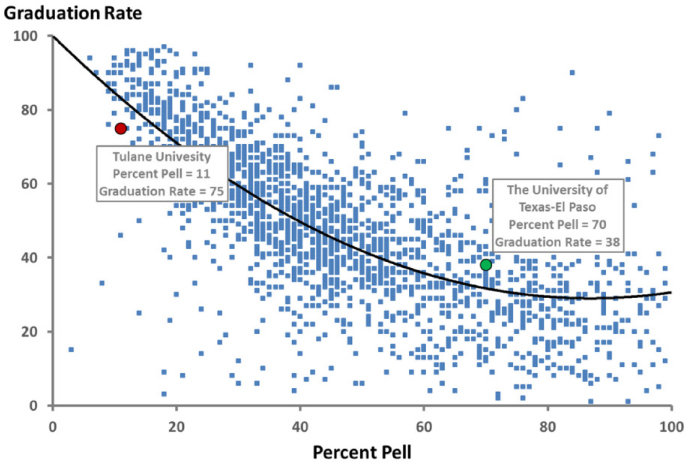
SOURCES: U.S. Department of Education. Institute of Education Sciences, National Center for Education Statistics, Integrated Postsecondary Education Data System (IPEDS) 6-year Graduation rate-bachelor's degree within 150 percent of normal time (2014) and percent of full-time first-time undergraduates receiving Pell grants (2011-2012).
financial aid receipt or family income; and demographic information such as the gender and race-ethnicity makeup, and average age of students (see for example, Bailey et al., 2005; Kelchen and Harris, 2012; Rothwell and Kulkarni, 2015). Estimates of college value-added based on these techniques yield dramatically different rankings of institutional quality when compared to raw graduation rates or average earnings.
Researchers have identified several limitations with this methodology and the ways it is commonly applied. First, many analysts additionally control for institutional factors, including the share of students enrolled online, the proportion of degrees awarded in various majors, overall enrollment, faculty salaries, and measures of education expenditures or endowment size. Arguably, however, all of these indicators represent strategies that can be manipulated by institutions in order to affect student outcomes. To the extent these factors represent key inputs into institution quality (or mechanisms through which colleges affect outcomes), then including them in the regression model will “over-adjust,” or eliminate part of the true signal about institutional quality. A related flaw is that estimates of college quality can change dramatically due to small changes in the sets of variables used for regression adjustment, or the exact way in which they enter the regression (e.g., whether the relationship between graduation is assumed to be linear or quadratic).
A more subtle yet fundamental set of concerns with this approach stems from the use of aggregate student data. As Bailey and Xu (2012) note, controlling for aggregate student characteristics such as SAT scores and family income adjust for two separate influences on student outcomes. The first is the impact that students’ academic family socioeconomic status (SES) background has on their own outcomes, and purging this part of the variation in institutional outcomes is the primary goal of regression adjustment. But aggregate student characteristics also capture the effect of the characteristics of a student’s peers on his or her outcomes, and peer effects ought to be considered part of an institution’s value-added.
A more important limitation is that it is likely that selection on the part of both students and college admissions offices leads to a correlation between institutional quality and aggregate student characteristics. To the extent this type of selection occurs, then the relationship between student characteristics such as the percentage receiving Pell grants and outcomes will reflect the impact of SES on outcomes, but also the higher quality of institutions with fewer poor students. In other words, in the presence of selection student demographics may “over control” and eliminate differences in outcomes across institutions due to quality differences. Figure C-2 provides evidence this may indeed be a serious flaw of this methodological approach using data on average earnings of students who receive Title IV aid at 4-year institutions. A regression of aggregate institution-level earnings on the fraction of Title IV students receiving Pell grants suggests that Pell students earn an average of nearly $25,000 less than non-Pell students, as shown by the slope of the regression line in the figure. But looking at the earnings outcomes of students within institutions reveals that in fact Pell students earn only $5,000 less than non-Pell students, and that both Pell and non-Pell students earn less at institutions with higher shares of Pell recipients. This is suggestive evidence that college quality measures based on regression adjustments using aggregate data may be very misleading, and in particular might overly adjust the outcomes of the highest and lowest quality schools toward the average quality school.
Both of the limitations just discussed can be addressed using individual-level data. In recent years, newly available administrative databases linking students’ background characteristics to their college attendance and progression outcomes, and to their labor market earnings has enabled new progress in measuring college quality. This newer literature estimates the value-added of colleges using methods isomorphic to those used in the teacher quality literature, relying on the relationship between student characteristics and their outcomes within (rather than across) colleges to adjust institutional outcomes.10 For example, Kurlaender et al. (2015) estimate the quality of community colleges in
___________________
10 That is, the regression model ![]() is estimated, where Yis is the outcome of student i attending school s, and Xis is a vector of student characteristics. µs are treated as fixed effects whose coefficients represent estimates of each school’s quality.
is estimated, where Yis is the outcome of student i attending school s, and Xis is a vector of student characteristics. µs are treated as fixed effects whose coefficients represent estimates of each school’s quality.
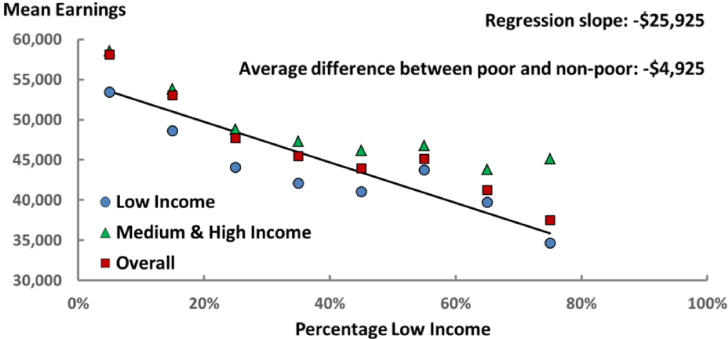
NOTE: Low income is defined as less than $30,000, and medium/high income is defined as greater than $30,000.
SOURCE: U.S. Department of Education, College Scorecard data (2011).
California in terms of their impact of several progression outcomes, controlling for demographics, parental education, and eleventh grade test scores from students’ high school transcripts.11 Similarly, Cunha and Miller (2014) use rich data on students’ academic and demographic background, as well as data on their application and acceptance history to estimate the value-added of 30 4-year institutions in the University of Texas system on graduation and earnings outcomes. Finally, the Council of Economic Advisers (2015) used student-level information from students’ FAFSA forms, including their parental education, family income, and the SAT scores of institutions to which they sent their FAFSA form to estimate regression-adjusted earnings measures for every degree-granting institution in the United States.
All of these studies find substantial differences in the ranking of institutions using regression-adjusted rather than raw average outcomes. The studies also confirm that the set of variables used to adjust outcomes can matter a great deal for measuring the relative quality of institutions. Figure C-3 below adapts data from Cunha and Miller (2014) to show the estimated difference in average earnings between a flagship (Texas A&M) and regional (University of Texas [UT], Pan-American) institution based on five different models. The first column of the figure shows that UT Pan-American alumni earn 52 percent less than students who attended Texas A&M, but subsequent columns use different
___________________
11Kurlaender et al. (2015) report results from estimating the equation in footnote 9 as a random effects model, but note their results are similar if they estimate using the fixed effects approach described in the text.
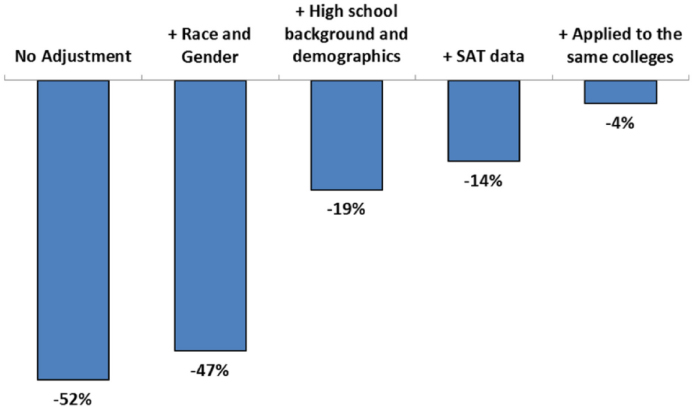
SOURCE: Adapted from Table 3 in Cunha, Jesse M. and Trey Miller (2014). “Measuring value-added in higher education: Possibilities and limitations in the use of administrative data.” Economics of Education Review 42: 64-77.
input variables to adjust this difference for the differences in the students who attend. The second column shows that when comparing students who are similar in terms of their gender and race the difference falls to 47 percent. Adding student demographics and high school and SAT test scores further reduces the difference in earnings to 14 percent. And finally, for students similar on all of the preceding variables and who applied to the same set of colleges the students who attend the regional university have only 4 percent lower earnings.
Cunha and Miller’s results highlight the importance of accounting for differences in student characteristics when measuring institution quality. A student growing up near UT Pan-American choosing whether to go to school locally or to Texas A&M might make a very different college choice if he believed his earnings would be only 4—not 52—percent higher if he attended A&M. But the results also show the frailty of these estimates, and how they can be very sensitive to the precise set of variables used for adjustment. This sensitivity begs the question of whether the results remain biased by unobserved differences in student characteristics across institutions even in the model that includes all available controls.
The gold standard for assessing causal impacts is to conduct a randomized control trial, but this is clearly infeasible in the context of measuring college quality. That said, in the past several years a handful of researchers have identified quasi-experiments that result in “as good as” random assignment of subsets of students to different institutions in a way that allows credible evaluation of their relative quality. Hoekstra (2009) was the first paper in this
literature, and exploited the fact that admission to a flagship state university in Florida depended on having SAT score above a threshold. Due to the admissions policy, the probability of enrolling at the flagship jumped by about 40 percentage points for students scoring just above the threshold relative to just below. In this setting, so long as other factors affecting outcomes do not change discontinuously for students who score just above and below the SAT threshold, the casual effect of attending the flagship university can be measured by comparing the outcomes of students scoring in a narrow window above and below the admissions cutoff. Hoekstra used this “regression-discontinuity design” to show large effects: attending the flagship increased the earnings of 28- to 33-year-old men by about 20 percent. Subsequent research by Zimmerman (2014) and Goodman, Hurwitz, and Smith (2015) found similar differences in institution quality among other schools using the same methodology.
These quasi-experimental studies are perhaps the most credible estimates available of the relative quality of institutions. They are, however, very limited in that they identify quality differences for only a handful of institutions and thus cannot hope to inform broader college choice or policy initiatives. In an ambitious recent effort, however, Hoxby (2015) uses a research design motivated by the regression-discontinuity studies to estimate the earnings value-added of all postsecondary institutions in the United States. Hoxby links individual-level SAT data from the College Board, college enrollment from the National Student Clearinghouse, and earnings data from the Internal Revenue Service. Using these data she employs two complementary research designs aimed at eliminating the effect of two types of selection from college quality estimates. First, to isolate similar students who enroll at institutions with different selectivity, she identifies students “on the bubble” of admissions at each school by finding applicants to each school whose admission probability based on their SAT score is between 40 and 60 percent.12 Among this subset of students, she argues that whether they are admitted and enroll is “random,” determined by college admissions responses to idiosyncratic aspects of students’ application file that are unlikely to be determinants of their outcomes. To the extent this assumption holds, the effect of attending the institution relative to the alternatives chosen can be estimated by comparing the outcomes of students who are in this “bubble range” for each school.
The second research design Hoxby employs is meant to address “horizontal selection,” and attempts to isolate situations where similar students might “randomly” choose among institutions with similar selectivity. To do so, she identifies every pair of colleges with very similar student SAT scores, and all students who apply to both institutions with a high probability of being admitted to each as a function of their own SAT score. Again, this allows the relative
___________________
12 Admissions are not directly observed so this is estimated by the ratio between the share of students who enroll and the maximum enrollment rate across SAT scores.
quality of the pair of institutions to be estimated by comparing the outcomes of students meeting these conditions who attend each institution.13 Each of Hoxby’s methods yields estimates of the relative quality of a pair of institutions for particular types of students (defined by their test scores). Paired comparison methods (Langville and Meyer, 2013) are used to generate a consistent quality measure on common scale for all institutions.
Hoxby’s results are preliminary and she has not yet published institution-specific estimates, but summary tables reveal large differences in quality across institutions. For example, relative to the least selective schools, schools in the top selectivity tier (defined by the SAT scores of their students) have an average value added that is more than $90,000 (i.e., causal impact on yearly earnings) higher. There is wide variation even within selectivity tiers as well: for example, among institutions with SAT math and verbal scores between the 25th and 30th percentiles, the school at the 90th percentile of the value-added distribution increases yearly earnings by roughly $9,000 more than the school at the 10th percentile of the distribution. Whether the assumptions underlying the methods Hoxby proposes survive further investigation is yet to be seen, but the data she has assembled (especially on students’ pre-test scores) are the most complete available that can support value-added estimates for nearly the full universe of postsecondary institutions.
NEXT STEPS AND CHALLENGES
As described above, only limited progress has been made in developing quality measures that have the desirable properties described above. Below, I comment on a set of next steps that seem necessary building blocks in the construction of better quality indicators and some challenges and considerations that will need to be addressed.
Determining and measuring the outcomes that matter most.
The most fundamental limitation in our knowledge about college quality is a lack of consistent information about various student outcomes for broad groups of colleges. As noted above, in surveys the reasons students give for choosing to attend college tend to cluster in three main themes—to improve their employment opportunities, to learn more about the world and subjects of interest, and personal development or to become a better person. Research has provided little guidance about what specific measures in these domains might be most salient for prospective students, but this is in part since few institution metrics have been developed to test whether students respond to that
___________________
13 A variant of this method is used to incorporate nonselective schools. Only comparison schools are based on the set of schools attended by a significant fraction of students from the past four classes at each student’s high school.
information. What types of indicators should and could be developed? An initial and partial list follows.
-
Labor market outcomes. The number one reason to attend college offered by students in surveys is often related to improving their employment outcomes. There are several aspects of individuals’ labor market outcomes that might be useful.
- Earnings. Newly available administrative data, either from tax data (generally W-2 and self-employment earnings) or from unemployment insurance data, allow earnings to be linked to individuals and the institutions they attended. Any function of earnings can be estimated in addition to simple averages, which may help allay concerns about incentivizing institutions to reduce enrollment in less lucrative programs. A variety of such earnings measures were recently released by the Department of Education in its updated College Scorecard, and growing numbers of state higher education systems are reporting the earnings outcomes of their graduates.
- Employment in a specific occupation, industry, or company. For many students, the goal of getting a “good” job may reflect a desire to attain a job in a particular occupation, industry, or company rather than (just) to get higher earnings. Unfortunately data reflecting this area are currently limited. Perhaps the most promising source of occupation data in the long-term is the (currently self-reported and hence at least somewhat unreliable) data on occupation reported on tax filings to the Internal Revenue Service. Practically speaking, pursuing this at scale would require modifications to the way this information is collected on tax forms (it is currently manually typed or hand-written into the form), but this seems technically feasible. Though falling short of measuring occupations, coarser information on types of employment is available in other data. For example, it is possible to identify the industry in which individuals work through employer identifiers on W-2 forms and unemployment insurance records, and also possible to know whether individuals work in the public sector via the tax status of their employer. Unemployment insurance data might also be used to identify the top company employers of each institution’s students, but to my knowledge this has not been done to date.14
- Graduate degree attainment. While not a direct measure of occupational attainment, many undergraduate students report attending their institution to prepare them for graduate study. For students who receive
___________________
14 LinkedIn, the online professional networking site, has computed the fraction of students in each institution working for “desirable” employers for select occupations heavily represented on their site based on the employment transitions of their users, but these measures are unlikely to be representative or even available for the majority of schools.
-
-
federal loans in their graduate studies, it is possible to observe whether they eventually obtain a graduate degree. But the fact that outcomes cannot be measured for students who might be fully funded or self-paying presents a significant challenge. An alternate source of data is the National Science Foundation’s Survey of Completed Doctorates, which allows each Ph.D. recipient to be linked to her undergraduate institution.
- Direct “productivity” estimates. For some types of postsecondary training aimed at preparing individuals for a particular occupation it may be feasible to measure the work performance of alumni, and compare this performance across institutions. This is the logic, for example, behind recent proposed regulations on teacher preparation programs, which seek to tie eligibility for some federal funding to the student test scores of teachers from the program. While data may exist in some sectors to measure raw performance (e.g., medical schools), the methodological challenges involved in estimating the value added of these programs are substantial due to selection into different types of employers.
- Other outcomes. Policymakers may put extra value on institutions that foster entrepreneurship or innovation. In principle, we can measure entrepreneurship via self-employment income in tax data. The same data can probably also be used to create finer measures of business creation, with details about the number of employees. In similar fashion, the degree to which each institution’s former students foster innovation might also be measured by linking data on patent recipients to where they attended college, as Chetty and coauthors have recently explored. Other outcomes that might be feasible to link to institutions’ former students include social welfare program participation (e.g., Food Stamps or Temporary Assistance for Needy families) to measure family-level economic distress.
-
-
Less tangible outcomes. There is broad agreement among higher education officials, policymakers, and students that the quality of a college education should not be narrowly equated with labor market success. Myriad other goals for the sector include developing a passion and aptitude for lifelong learning, producing better global citizens, and becoming a better person. Unfortunately, there have been relatively few systematic attempts to measure these outcomes at scale since they do not yield easily to quantification. Nonetheless, future research ought to address which, if any, indicators might capture some of the less tangible benefits of education. A few types of measures that might be promising as “catchall” measures of quality are:
- Subjective well-being (SWB). Many countries have recently promoted SWB measures to complement Gross Domestic Product as a yardstick to measure the performance of the economy to capture non-pecuniary aspects of well-being. Though researchers remain divided on the issue
-
-
of how appropriate such measures are for overall assessments of welfare, the measures certainly capture aspects of welfare that cannot be measured through employment outcomes. Though relatively little work has been done to date, several organizations, including PayScale and Gallup, collect information on measures related to SWB on a large scale that might provide insight to researchers.
- Student satisfaction. Many institutions conduct surveys of their students’ satisfaction or engagement, and some of these measures have been shown to correlate with higher graduation rates. In their current incarnation, generally asked while students are enrolled or as part of an exit survey, these measures are probably most useful in helping assess what institutional practices are associated with quality (i.e., the institution’s impact on outcomes). It might be more useful to ask satisfaction questions well after students exit from institutions when they can reflect on how well their education helped them attain their goals. One could imagine such a survey being administered at scale to loan recipients, for example, through Federal Student Aid.
-
- Learning outcomes. At least since the Spellings Commission, many have advocated and investigated measuring institution quality through learning value-added metrics. While there is currently no wide-scale deployment of an assessment that would allow the learning gains of large shares of students to be compared across many institutions in the United States, many efforts are under way to develop assessments in a wide variety of learning domains. As noted above, I largely ignore the body of research on such measures here, but a few points are worth making. These efforts have many advantages, such as being able to measure learning and growth in areas not likely to be reflected in labor market outcomes or other data, and the ability to provide high-frequency feedback about institutional performance with little lag due to measurement. On the other hand, researchers and policymakers should be explicit about whether the learning outcomes captured on these tests are valued per se, or because they are believed to lead to other valued outcomes. If the latter, then wherever possible direct measurement of the outcome is preferred. For example, rather than measuring learning valued because of its instrumental value in enhancing students’ employment prospects, direct measurement of employment outcomes seems preferable.15 When direct measurement is not possible, the validity of tests as proxies for the outcomes ultimately valued should be investigated. In a recent study, Melguizo, Zamarro, Velasco, and Sanchez (2015) does just this by leveraging the fact that in Colombia there is a mandatory exit exam meant to test general skills
___________________
15 Of course, linking the two sources of information together brings other benefits, such as pointing to particular competencies that are valued in the labor market to guide improvements to curricula, etc.
(based on the CLA) to compute institution value-added measures for both learning outcomes and early career earnings. Melguizo et al. show that for many programs the correlations between these measures are low, and for some programs they are negative. At a minimum, these results suggest caution in treating measures of student learning outcomes as valid quality measures without further validation. A second concern is whether it is realistic to field the necessary assessment tests at large scale both within and across institutions, given the current climate surrounding testing. Researchers should also investigate whether students will find this type of quality information to be salient when making college choice decisions, or whether the information will primarily be useful for accountability schemes or institutions seeking to improve.
Developing and validating methods to measure the causal effects of institutions and the mechanisms through which they affect outcomes.
As discussed above, researchers have yet to determine which of several methods available best measure the quality of postsecondary institutions. In recent years, however, high-quality quasi-experimental research designs have yielded credible estimates of the impact of attending particular colleges on student progression and earnings outcomes. Unfortunately, relatively few institutions have institutional features—such as test score cutoffs used in their admissions decisions—that would permit this type of evaluation of their quality. Estimates of quality from these studies may nonetheless prove useful in future research, by providing a way to validate quality estimates from other research designs with less ex ante validity. For example, with quasi-experimental quality estimates for enough institutions we could compare the quality estimates based on non-experimental methods (such as the regression-based value-added measures presented in Cunha and Miller (2014) or CEA (2015)) and evaluate which, if any, provide accurate estimates of institutions’ “true” quality. This type of work could help identify, for example, whether individual-level data is critical, and what core sets of student characteristics need to be included in regression adjustment models for them to produce accurate quality measures.16
Researchers also need to develop information about which institutional practices contribute most to quality to help inform improvement efforts. Once quality estimates exist, correlational studies can help identify candidate factors that appear to be the most important determinants of quality. Subsequent studies
___________________
16 For example, McClellan and Staiger (2000) discuss how in the history of hospital quality measures, methods once thought too coarse to sufficiently eliminate selection effects were eventually revealed to perform nearly as well as models based on much richer information when richer data became available. Similarly, in the literature on teacher value-added, several papers have suggested that non-experimental value-added estimates can provide unbiased measures of true (e.g., experimentally estimated) teacher quality (Kane and Staiger, 2008; Chetty et al., 2014).
can help distinguish whether these practices have causal impacts on student outcomes, or perhaps are simply correlated with other practices that warrant further investigation.
Are different measures appropriate for setting minimum standards of quality as opposed to an overall assessment of quality?
One of the most pressing sources of demand for quality information about postsecondary institutions is to inform public policy efforts to ration public funds away from institutions with unsatisfactory outcomes. For example, the Higher Education Act proscribes participation in Title IV financial aid programs for institutions with high default rates on federal loans, and the Gainful Employment regulations do the same for vocational training programs whose graduates have high debt-to-earnings ratios. Neither of these performance measures reflects the causal impact of institutions, but proponents of the measures have argued that an absolute minimum standard may be more appropriate. Leaving the particulars of these policies aside, it is important for researchers and the higher education sector to consider what levels of performance on various indicators should be considered unacceptable for various purposes, especially in determining eligibility for participation in various types of public aid programs. It may be that some measures of institutional performance are valuable for setting minimum standards—e.g., by reliably identifying low-quality institutions—even if they might not be suitable proxies for institution quality across the full distribution of quality.
Should summative measures of quality be constructed from various measures of particular dimensions of quality? Under what circumstances and how?
The discussion above has focused on separately estimating various dimensions of college quality, or the causal impact of institutions on various outcomes of interest. For a variety of purposes, however, summarizing this information in a single quality rating may be desirable. Many consumer-oriented ratings sites use a “star system” or some other one-dimensional rating in order to convey a summary of a variety of different indicators in a way that is simple and easy for consumers to understand and act upon. Moreover, accountability schemes such as the performance-based funding systems that many states are currently experimenting with presume a single index of quality that maps into the amount of funds that should be allocated to each university. While indices of overall quality can be formed by averaging together multiple measures of different dimensions of quality (suitably normalized, for example by expressing measures in standard deviation units relative to the mean), there is little guidance in the literature on how heavily to weight each dimension of quality.
Is there a principled way to combine measures of institutional quality to inform either college choices (for particular student types), or for accountability efforts such as performance based funding schemes?
What level of quality information is most useful for various purposes?
Finally, as noted above, it is likely that the quality of an institution varies considerably for different types of students, and for different programs within the institution. This begs the question of what level should quality information be constructed to be most useful for informing college choice or other purposes. For example, some states have begun to report outcomes data, such as average earnings, for graduates separately by program of study. On the one hand, this might provide valuable information to students to inform what major they should pursue, and might diminish concerns that institutions might drop programs with low-earning graduates to improve their measured performance. On the other hand, many students do not complete degrees in the fields they initially express interest even when they do earn a degree. It may be preferable, then, to report outcomes (or quality estimates) for students based on their stated program of interest at enrollment, or perhaps to combine estimates of the fraction of students who graduate in each program by their initial stated interests in conjunction with the outcomes of graduates. In practice this may be complicated since many institutions do not require students to declare a program of study in their first years of study.
Another dimension of the question is whether outcome or quality information should be computed separately for different types of students. Again, research has shown that different types of students (e.g., low-income vs. higher-income) can experience different impacts on their outcomes from attending the same institution, so tailoring the information might provide more accurate information to inform choices. At the same time, some observers have expressed concerns about whether presenting tailored information to students showing that their particular subgroup’s outcomes tend to be lower than average might (overly) discourage them from enrolling in college, or induce poorer performance perhaps by exacerbating anxieties about belonging or other behavioral channels. Experimentation to test how students might respond to various types of information content and presentation is needed to investigate this complex set of issues.
REFERENCES
Autor, David H. (2014). “Skills, Education, and the Rise of Earnings Inequality Among the ‘Other 99 Percent.’” Science, 23: 344 (6186), 843-851.
Bailey, Thomas and Di Xu. (2012). “Input-Adjusted Graduation Rates and College Accountability: What Is Known from Twenty Years of Research?” HCM Strategists Working Paper.
Bailey, Thomas, Juan Carlos Calcagno, Davis Jenkins, Gregory S. Kienzl, and D. Timothy Leinbach. (2005). “The effects of institutional factors on the success of community college students.” New York: Columbia University, Teachers College, Community College Research Center.
Baum, Sandy. (2014). Higher Education Earnings Premium: Value, Variation, and Trend. The Urban Institute.
Black, Dan and Jeffrey Smith. (2004). “How robust is the evidence on the effects of college quality? Evidence from matching.” Journal of Econometrics 121: 99-124.
Black, Dan and Jeffrey Smith. (2006). “Evaluating the returns to college quality with multiple proxies for quality.” Journal of Labor Economics 24(3): 701-728.
Brewer, Dominic J., and Ronald G. Ehrenberg. (1996). “Does It Pay to Attend an Elite Private College? Evidence from the Senior High School Class of 1980.” Research in Labor Economics 15:239-71.
Chetty, Raj, John N. Friedman, and Jonah E. Rockoff. (2014). “Measuring the impact of teachers II: Teacher value-added and student outcomes in adulthood.” American Economic Review 104(9): 2633-2679.
CEA (Council of Economic Advisers). (2015). “Using Federal Data to Measure and Improve the Performance of U.S. Institutions of Higher Education.” Washington, DC.
Cunha, Jesse M. and Trey Miller. (2014). “Measuring value-added in higher education: Possibilities and limitations in the use of administrative data.” Economics of Education Review 42: 64-77.
Dale, Stacy Berg and Alan B. Krueger. (2002). “Estimating the payoff to attending a more selective college: An application of selection on observables and unobservables.” Quarterly Journal of Economics 107(4): 1491-1527.
Dale, Stacy Berg and Alan B. Krueger. (2011). “Estimating the Return to College Selectivity over the Career Using Administrative Earnings Data.” NBER Working Paper No. 17159.
Goodman, Joshua, Michael Hurwitz, and Jonathan Smith. (2015). “College Access, Initial College Choice and Degree Completion.” NBER Working Paper No. 20996.
Hoekstra, Mark. (2009). “The effect of attending the flagship state university on earnings: A discontinuity-based approach.” The Review of Economics and Statistics 91(4): 717-724.
Hoxby, Caroline. (2015). “Value-Added of American Postsecondary Institutions.” Stanford University mimeo.
Institute of Medicine. (2001). Crossing the Quality Chasm: A New Health System for the 21st Century. Washington, DC: National Academies Press.
James, Estelle, Nabeel Alsalam, Joseph C Conaty, and Duc-Le To. (1989). “College quality and future earnings: Where should you send your child to college?” American Economic Review 79(2): 247-252.
Kane, Thomas J. and Douglas O. Staiger. (2008). “Estimating Impacts on Student Achievement: An Experimental Evaluation.” NBER Working Paper No. 14607.
Kelchen, Robert and Douglas N. Harris. (2012). “Can ‘Value Added’ Methods Improve the Measurement of College Performance? Empirical Analyses and Policy Implications.” HCM Strategists.
Kurlaender, Michal, Scott Carrell, and Jacob Jackson. (2015). “The Promises and Pitfalls of Measuring Community College Quality.” University of California, Davis mimeo.
Langville, Amy and Carl D. Meyer. (2013). Who’s #1? The Science of Rating and Ranking. Princeton, NJ: Princeton University Press.
Long, Mark C. (2008). “College quality and early adult outcomes.” Economics of Education Review 27(5): 588-602.
Loury, Glen and David Garman. (1995). “College selectivity and earnings.” Journal of Labor Economics 13(2): 289-308.
McClellan, Mark and Douglas Staiger. (1999). “The Quality of Health Care Providers.” NBER Working Paper 7327.
McClellan, Mark and Douglas Staiger. (2000). “Comparing the Quality of Health Care Providers,” in Alan M. Garber, ed., Frontiers in Health Policy Research, Volume 3, Cambridge, MA: MIT Press.
Melguizo, Tatiana, Gema Zamarro, Tatiana Velasco, and Fabio J. Sanchez. (2015). “How Can We Accurately Measure Whether Students Are Gaining Relevant Outcomes in Higher Education.” University of Southern California mimeo.
Monks, James. (2000). “The returns to individual and college characteristics: Evidence from the National Longitudinal Survey of Youth.” Economics of Education Review 19(3): 279-289.
Rothwell, Jonathan and Siddharth Kulkarni. (2015). “Beyond College Rankings: A Value-Added Approach to Assessing Two- and Four-Year Schools.” Brookings Metropolitan Policy Program.
Zimmerman, Seth. (2014). “The returns to college admission for academically marginal students.” Journal of Labor Economics 32(4): 711-754.


