
6.
UNCERTAINTY AND VARIABILITY IN DOSE PROJECTION
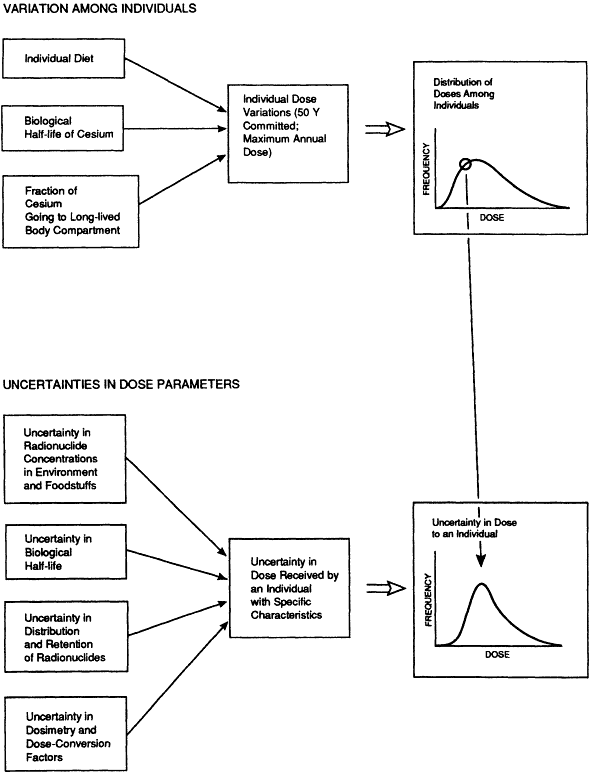
Two approaches can be used to define maximally exposed persons in risk assessments: the probabilistic approach and the scenario approach. The probabilistic approach specifies frequency distributions for quantities that are relevant to dose or risk and then uses Monte Carlo simulation to estimate the population distribution of dose or risk. This approach uses statistical distributions to define a maximally exposed person. In the Rongelap assessment, the distribution of doses to individuals is estimated from distributions of diet, biological half-life, and radionuclide concentrations. The average dose to the maximally exposed person is estimated as some high percentile (e.g., the 99th percentile) of the individual dose distribution. It is not possible to work back from the dose received by the maximally exposed person and determine the characteristics of that person. The uncertainty in the dose is a consequence of the variability in radionuclide concentrations in the environment and uncertainties in the dosimetry models and coefficients.
LLNL Probabilistic Approach
The LLNL model extends the standard probabilistic approach by dividing the uncertainty in the dose into the variability among persons and the uncertainty in the dose to a specific individual (Robison et al, 1993; Bogen and Spear, 1987). The variability among persons depends on individual diet (intake of radionuclides), the biological half-life of cesium-137, and the fraction of ingested cesium stored in the long-lived body compartment of different persons. The uncertainty in a person's estimated dose depends on variability in radionuclide concentrations in the environment and uncertainty in the dose model used and its coefficients (Fig. 10).
Two sources of data contribute to the LLNL dose assessment: characteristics of people and characteristics of the environment. The sample size used to estimate environmental characteristics is much larger than the sample size available to estimate the characteristics of the people (see Table 2-3). According to the current assessment of sources of variation in the dose assessment, the interindividual components of variation are much larger than the random environmental variation (Robison et al, 1993). The large among-individual variance and small sample sizes for individual characteristics limit the usefulness of the individual variability. Estimating the entire distribution of individual doses is mathematically sophisticated, but it depends on particular assumptions:
-
The native diet of the people returning to Rongelap has exactly the same mean and variance as were observed in the sample of 34 people on Ujelang, and the biological turnover time of cesium-137 has exactly the same mean and variance as were observed in the sample of 23 Marshallese. This assumption involves two sub-assumptions:
-
There are no systematic differences between the people in the diet or biological-turnover studies and the Rongelap people.
-
The means and variances observed in the samples are exactly the same as the true mean and variance in the population. Sample means and variances usually differ from the true population values because of random sampling from a variable population. Small samples, such as for the diet and biological-turnover data, are usually highly variable. The Monte Carlo simulation ignores the sampling variation and uses the sample estimates of mean and variance as the parameters of the true distribution.
The variance in daily cesium-137 intake among persons is highly influenced by the extreme values in the distribution of daily cesium-137 intake. In the Ujelang diet survey, the diets that have the highest daily cesium-137 intake were those whose daily intake was poorly estimated. The precision of the estimate of total cesium-137 intake, for a given diet, depends on the precision of the measurements of cesium-137 concentration in each foodstuff. The standard error of the total cesium-137 intake, given some fixed diet, can be expressed as
where W, is the intake of item i, si is the standard error of cesium-137 concentration in item i, and Stotal is the standard error of the total cesium-137 intake. Foodstuffs that are large components in the diet (i.e. have large Wi) have the largest influence on the precision of the total cesium-137 intake. If the cesium-137 concentration in those foodstuffs is poorly estimated, then the total cesium-137 intake from that diet will be poorly estimated.
Large values of cesium-137 intake are poorly estimated, but the average cesium-137 intake is relatively precisely estimated, see for example, Table 6-1. Female number 17 in the Ujelang diet survey has the highest dietary intake of cesium-137, but the approximated standard error for her intake is extremely high, 75 Bq/day, because she consumes a lot of chicken and papaya. Mean specific activities for both papaya and chicken parts are poorly estimated because the sample sizes are small. The next largest cesium-137 intake is relatively well estimated (standard error = 4.2 Bq/day, Table 6-1) because the local food components of her diet are primarily coconuts and breadfruit. The standard error of the third largest intake is relatively large because that diet includes a lot of papaya and pork. In contrast, the cesium-137 intake from the average imported-foods available diet is relatively well estimated (Table 6-1).
-
Dietary intake and biological half-life of cesium are independent. That would not be true if people with high dietary intake tended to have higher cesium biological half-lives. Body weight is correlated with high dietary intake and might be correlated with biological half-life in adults (Miltenberger et al., 1981; Leggett 1986). If body weight is positively correlated with both dietary intake and cesium biological half-life, then intake and half-life will be positively correlated, violating the assumption of independence.
Table 6-1. Estimated daily intakes and approximate standard errors for the imported-foods-available diet and the three women in the Ujelang diet study with the largest estimated cesium-137 intake
|
Diet |
Estimated Cs intake |
Approximate standard error* |
|
Imported-foods |
31 Bq/d |
2.9 Bq/d |
|
Of Female #17 |
173 Bq/d |
74. Bq/d |
|
Of Female #15 |
103 Bq/d |
4.2 Bq/d |
|
Of Female #16 |
60 Bq/d |
12. Bq/d |
|
* These standard errors are approximate. They are calculated from the Ujelang diet survey raw data and data in Robison et al, 1993, tables 20 and B-1. The calculations are underestimates of the true standard error because they assume random sampling of foodstuffs, independent estimates of cesium-137 concentrations in all foodstuffs, and no sampling error in certain foodstuffs (e.g. most seafood). |
||
-
Lognormal distributions are appropriate to describe the distribution of body weights, dietary intakes, and biological half-lives for cesium in the Rongelap population. Special concern should be given to whether the upper tail of the lognormal distribution appropriately matches extreme values in the Rongelap population. The LLNL dose assessment does test whether the data fit lognormal distributions (Robison et al., 1993). None of the tests rejects the hypothesis that the distributions are lognormal, but failing to reject does not prove that the distributions are lognormal, especially in the tails. The tests of normality or lognormality have low power, especially when the sample sizes are small (Shapiro et al., 1968). In other words, data might appear to be lognormal even if the true distribution is not lognormal. Inspection of the probability plots given in Robison et al., (1993) suggests that lognormal distributions might not be appropriate to represent the extreme tails of the true distributions. In general, the largest and smallest data points deviate the most from the predicted quantiles for lognormal distributions (e.g., see Figs. 6, 8, 10, and 11 of Robison et al., 1993). To some extent, that is expected because the variance of extreme values is larger than the variance of the median. It is not clear whether the extreme values are more deviant than would be expected.
The issue of the appropriate distribution to use in the Monte Carlo simulation is important because some sort of distributional assumption must be made to extrapolate to extreme percentiles. The sample sizes for the diet and biological half-life samples are too small to use nonparametric estimates of the extreme percentiles. The 99 percentile cannot be estimated unless there are more than 50 observations, and it is not reliably estimated unless the sample is considerably larger.
-
There is no measurement error included in any of the variance estimates. The Monte-Carlo uncertainty analysis uses the between-individual variances in dietary intake, biological turnover, and other quantities to calculate the distribution of annual doses to individuals. The Monte-Carlo analysis assumes that the observed between-individual variances estimate the true
-
variance among individuals. Under some simplifying assumptions, the observed variance among individuals() is the sum of the true inter-individual variance () and the measurement variance () (Searle et al., 1992). That is,

Hence, the observed variance estimates the true between-individual only when there is no measurement error. However, there is some measurement error associated with all data. Table 6-1 shows some of the estimated measurement errors for dietary intake. There is also a measurement variance associated with estimates of biological half-life, but we have not estimated it. If estimates of measurement error are available, e.g. from repeated sampling of individuals, then can be estimated separately from . The effects of measurement error in dietary surveys on the distribution of usual dietary intake and some approaches to correct for it are explored by Nusser et al. (1990).
Those assumptions have different effects on the distribution of doses to individuals. Accounting for sampling variation (the first sub-assumption) increases the variance in the dose distribution and so increases the probability of a large dose to an individual. The effect of correlated dietary intake and biological half-lives depends on the sign of the correlation. If they are positively correlated, the probability of extreme doses is higher; if they are negatively correlated, the probability is lower. The effect of mis-specifying the tails of some distribution depends on whether the tails of the true distribution are more or less extreme than those of a lognormal distribution. If they are more extreme, the probability of an extreme dose will be higher. Accounting for measurement error decreases the among-individual variance, which decreases the probability of an extreme dose to an individual.
The net effect of the assumptions and small sample sizes defining the characteristics of individuals is that the true distribution of doses to the Rongelap population upon resettlement might differ from the calculated distribution (Robison et al., 1993, Fig. 18). The difficulty stems from uncertainties in characterizing the variability among individuals. Using scenarios for estimating exposure and estimating the distribution of doses for specific scenarios avoids the problem of estimating the variability among individuals.
Scenario Approach
In the scenario approach, one can easily define characteristics of a maximally exposed person. For the Rongelap assessment, scenarios can be used that specify the sex, weight, and diet for any individual situation. The scenario could also include the life style, biological half-life of cesium, and fraction of cesium going to the long-lived body compartment. A scenario for the ''critical group'' that defines the maximally exposed person might specify the sex, weight, and diet of that group. Alternative scenarios should explore the impact of food consumption (kilograms/day), effects of binges (e.g., consuming a large number of coconut crabs in a short period), effects of different lifestyles (e.g., primarily harvesting and eating coconuts or primarily fishing), and the impact of KCl applied to the soil as a fertilizer. The average dose and its uncertainty are computed for that combination of characteristics.
The uncertainty in the average doses from the various scenarios might include one or all
of the relevant sources of variability in the input data: daily variation in diet, variation in radionuclide concentration in the foodstuffs, or biological half-lives, and uncertainties in the dosimetry models and coefficients. Individual variability in biological half-lives can be dealt with in one of three ways: adding a specification of biological half-life to the description of the scenario, fixing the cesium biological half-life at 110 d (the ICRP average adult value), or incorporating variability in the biological half-life in the uncertainty in the dose. If the latter approach is taken the database on biological half-lives in the Rongelap (or Marshallese) population must be expanded.
The scenario approach to risk assessment is often used. Because the risk is computed for a person with specific characteristics, it is possible to identify the characteristics associated with high dose and decide whether any person is likely to possess those characteristics.
Conclusions
-
The reliability of the probabilistic approach for estimating uncertainty in the dose to returning Rongelap people is limited by the sparseness of information on variability among individuals.
-
A scenario approach might be more effective because it can identify events that contribute to high doses. A suite of relevant scenarios should be developed in collaboration with the Marshallese.


