
4
City Profiles
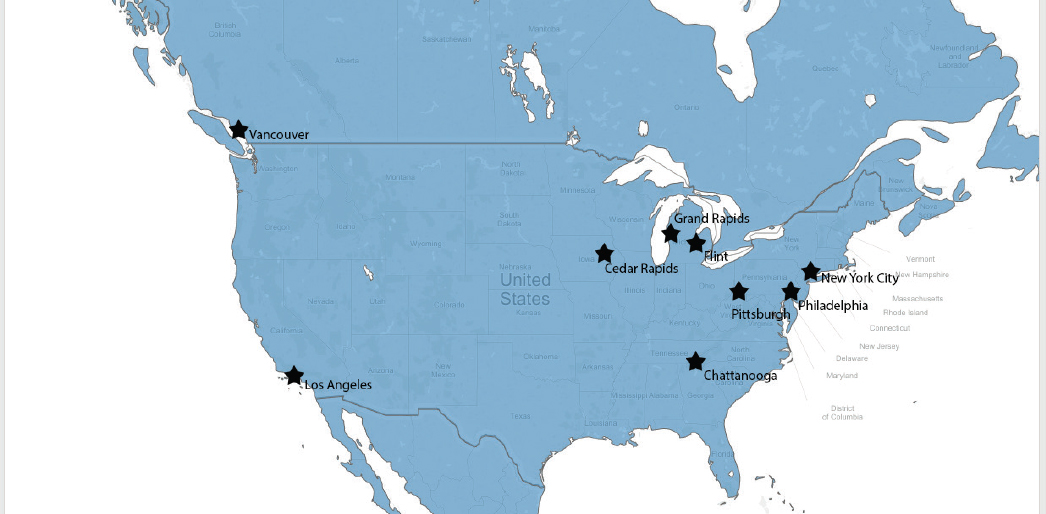
As described in Chapter 1, the committee was tasked with examining examples from metropolitan regions to understand how and if sustainability practices could contribute to the development, growth, and regeneration of major metropolitan regions in the United States. As part of its evidence-gathering process, the committee organized a series of public data-gathering meetings in two metropolitan regions, Los Angeles, California, and Chattanooga, Tennessee, to examine issues relating to urban sustainability. Los Angeles and Chattanooga were selected for the committee’s public data-gathering meetings due to their varying urban characteristics including size, geography, and contextual sustainability challenges such as water supply, air pollution, and energy. The additional seven city profiles, including New York City, New York; Vancouver, British Columbia; Philadelphia, Pennsylvania; Pittsburgh, Pennsylvania; Grand Rapids, Michigan; Cedar Rapids, Iowa; and Flint, Michigan, were selected to reflect the diversity of U.S. urban contexts along dimensions of city size and density, geographic location, primary industries, and the key challenges to sustainability (Figure 4-1). Topics under consideration included energy, natural resource management, climate adaptation, economic development, hazard mitigation, public health, social equity, and land-use considerations. The committee was responsible for developing the agenda for each meeting in consultation with regional stakeholders in an effort to ensure that the presentations reflected place-based knowledge and approaches to sustainability.
The city profiles are designed to serve as “guideposts”—highlighting, for specific urban contexts, opportunities and challenges that illustrate the committee’s urban sustainability “roadmap.” Each profile begins with a description of the urban area, including relevant metrics drawn from Chapter 2 and specific sustainability challenges, and then outlines noteworthy sustainability efforts the city undertook along with other significant issues discovered during the committee’s research, largely guided by the urban sustainability principles outlined in Chapter 3. The city descriptions end with a series of summary observations and recommendations based on that city and a table that links the city’s specific urban contexts back to each step in the aforementioned urban sustainability “roadmap” (see Figures S-1 and 3-1). For example, each table provides illustrative examples of steps drawn from real-world examples, including the first phase (adopting principles, identifying opportunities and constraints, and prioritizing co-net benefits), the second phase (engaging partnerships, establishing goals, developing strategies, identifying data gaps, and implementation), and the third phase (assessing impacts from local to global scales, securing public buy-in, and feedback row) (see Tables 4-2, 4-4, 4-6, 4-8, 4-10, 4-12, 4-14, 4-16, and 4-18). The set of urban sustainability indicators and metrics in Chapter 2 provide much of the empirical evidence that form the basis of the city profiles, and in many instances indicators are included in local climate, energy, and water plans. Moreover,
the profiles are structured to highlight specific urban contexts, opportunities, and challenges that can be linked to the four guiding urban sustainability principles, as described in Chapter 3. For example, many of the city’s sustainability challenges directly reflect Principle 1—the planet has biophysical limits—as well as Principle 3—urban inequality undermines sustainability efforts. Principles 2—human and natural systems are tightly intertwined and come together in cities—and 4—cities are highly interconnected—are inherently illustrated throughout many of the city’s major sustainability efforts, other significant sustainability activities, and the summary observations which conclude each profile. Thus the profiles in structure and content connect with the Chapter 5 findings and recommendations.
LOS ANGELES
The Los Angeles metropolitan region, both at the city and county levels, faces a number of sustainability challenges, the most prominent of which pertain to water quality and supply, a severe drought, poor air quality, and urban sprawl. The city has confronted these obstacles by developing an aggressive results-based sustainability plan, called the Sustainable City pLAn, that combines specific targets and outcomes pertaining to the environment, the economy, and equity with multistakeholder engagement across institutions and departments, as well as innovative new science-based technologies and solutions. The city also developed an action plan for climate change, embodied in Green LA and its corresponding implementation program Climate LA, which is a “living” document, which is continually updated and modified. Moreover, throughout the Los Angeles metropolitan region, cities such as Santa Monica and Long Beach have taken unique approaches to sustainability strategies based on their specific urban contexts (City of Los Angeles, 2007, 2008; Garcetti, 2015a).
Overall, a combination of regulation and policy instruments has stimulated progress in areas such as water conservation and air quality, with legislation and directives being passed at both the local and state levels, while technological innovations in renewable energy, energy storage, and vehicle electrification have positively impacted
sustainability-driven change in transportation and energy. However, ongoing issues relating to poverty and homelessness—Los Angeles County has the highest rate of homelessness in the nation, and poverty levels remain 2 percent above the national average—demonstrate the importance of integrating social issues into sustainability decision making.
BACKGROUND
Building upon its Spanish colonial past, modern Los Angeles, California, began with rapid industrial growth and development in the 1880s and the advent of streetcars and railroads, the surge in real estate markets, and the efflorescence of Hollywood, resulting in rapid population growth that rose from barely 100,000 in 1900 to surpassing 1 million by 1920 (California State Data Center, 2011; City of Los Angeles, 2007). Almost 100 years and 3 million additional inhabitants later, the city of Los Angeles is part of a sprawling urban metropolis, a hub of global trade, and an iconic epicenter of global entertainment (City of Los Angeles, 2007; Heimann et al., 2009). Table 4-1 presents an overview of some of the key characteristics for the city, including environmental, economic, and social indicators, providing a glimpse into Los Angeles’ sustainability performance as compared to the national average.
Geography
According to the 2010 U.S. Census, the city of Los Angeles has a population of approximately 3,800,000 people, making it the largest city in California and the second largest city in the United States behind New York (U.S. Census Bureau, 2015b). The majority of the population lives in Central Los Angeles, in the neighborhoods of Koreatown and Westlake (Data Desk, 2015). Known as the cultural hub of the Pacific Rim, the city has a diverse, multiethnic population, with foreign-born individuals composing 38.3 percent of the city population (LATCB, 2015). The largest ethnicity represented is Hispanic or Latino, at 48.5 percent, followed by Caucasian at 28.7
TABLE 4-1 Key Characteristics for Los Angeles
| Indicator | Los Angeles | United States |
|---|---|---|
| ENV Average Annual Precipitation (inches/year) | 18.7 | 40.8 |
| ENV Existing Tree Canopy (% of land cover) | 21% | 25% |
| ENV Roadway Fatalities (per 100 million annual vehicle miles traveled) | 0.9 | 1.1 |
| ENV Particulate Matter 2.5 (ppm) | 8.1 | 10.2 |
| ENV Residential Carbon Footprint (metric tons of CO2 per capita from residential energy consumption) | 1.6 | 3.4 |
| ECON Financial Health | AA- | AA+ |
| ECON Average Residential Electricity Rate (cents/kWh) | 13.0 | 11.9 |
| SOCIAL Black or African American | 9.2% | 13.2% |
| SOCIAL Hispanic or Latino | 48.4% | 17.4% |
| SOCIAL Asian | 14.8% | 5.4% |
| SOCIAL Home Ownership (2009-2013) | 46.9% | 64.9% |
| SOCIAL High School Graduate (25 or older, 2009-2013) | 77% | 86% |
| SOCIAL Below Poverty Level | 17.8% | 15.4% |
| SOCIAL Violent Crimes (per 100,000 people) | 474 | 191 |
NOTE: ENV, ECON, and SOCIAL refer to the three dimensions of sustainability: environmental, economic, and social, respectively. SOURCE: Appendix B.
percent, Asian 11.3 percent, African American 9.6 percent, American Indian and Alaska Native 0.7 percent, and Native Hawaiian and Other Pacific Islander 0.1 percent (U.S. Census Bureau, 2015b).
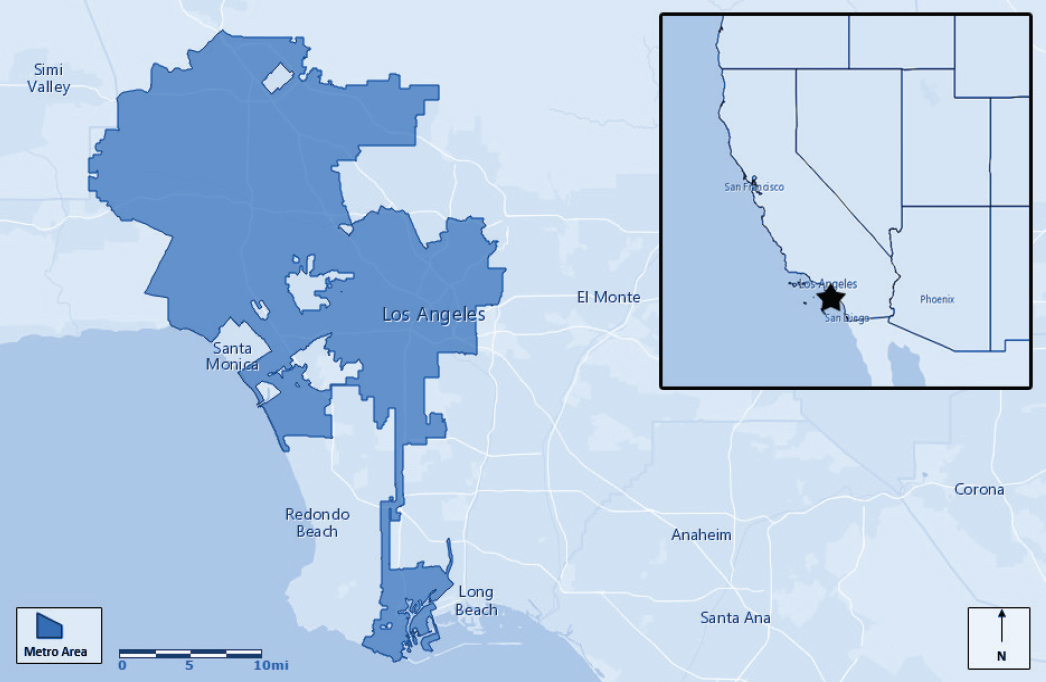
The Los Angeles metropolitan area is defined by the U.S. Census Bureau as the Los Angeles-Long Beach-Anaheim, CA Metropolitan Statistical Area, comprising both Los Angeles and Orange counties. Figure 4-2 shows the administrative boundaries of the Los Angeles metropolitan area (U.S. Census Bureau, 2013). The county of Los Angeles has a population of 10 million spread out across 4,058 square miles, 469 of which comprise the city of Los Angeles proper, encompassing a widely diverse geographic area. The Los Angeles metropolitan area sits in a basin created by the San Gabriel Mountain range in the east, the Santa Monica Mountains in the north, and bounded by 75 miles of Pacific Ocean coastline in the south and west. The Los Angeles, Rio Hondo, San Gabriel, and Santa Clara are the prominent local rivers, and the majority of their flow occurs only during rain events (LATCB, 2015; U.S. Census Bureau, 2015b).
Well known for its moderate weather, the climate of the area is categorized as Mediterranean under the modified Köppen classification system—typified by dry summers and cool winters, pronounced variability in rainfall, and relatively modest transitions in temperature. Its most conspicuous weather feature is a marine layer produced from the eastern Pacific high-pressure area that moderates temperatures during the summer months (Morris, n.d.).
Environmental Issues
Two interconnected environmental issues long synonymous with the metropolitan area of Los Angeles are water supply and air pollution. The history of water in the Los Angeles metropolitan region has shaped the character
of the area and, more recently, its sustainability efforts. Los Angeles regularly operates at a water deficit. The lack of available water, which the city has largely offset using water imorts through an aqueduct system, has been a challenge for the city since its early development. Los Angeles exhausted its local sources of water from the Los Angeles River and its tributary groundwater basin by 1900, and this prompted William Mulholland, chief engineer of the new Los Angeles Department of Water and Power, to design and orchestrate a water import system for the city via the construction of the Owens Valley Aqueduct, completed in 1913. However, continued population and urban growth demanded more water resources, resulting in new diversion works in the Owens River Valley and extension of the aqueduct further north into the Mono Basin. The city’s diversions prompted disputes with Owens Valley residents, as well as diminishment and degradation of the Mono Basin lake and ecosystem, to such a degree that the California Supreme Court decreed that the public trust doctrine establish a fundamental limit on the exercise of water rights (Hanak and Lund, 2011). In 1970, a second aqueduct was built to augment aqueduct flow from the Owens Valley. Given this tumultuous history of water resources in the region and facing continued pressures on water supply, the city of Los Angeles began implementing conservation measures, such as water metering and water reclamation programs, by the 1970s (LADWP, 2015b).
Currently, the Los Angeles Department of Water and Power (LADWP) supplies water to the City of Los Angeles from the Los Angeles Aqueduct, recycled water, local groundwater, and purchased imported water from the Metropolitan Water District of Southern California. This tangibly demonstrates the concept of city footprints which extend beyond municipal boundaries (Gold et al., 2015b). In recent decades, LADWP has made large efforts toward increased water independence by cultivating local resources such as groundwater, recycled water, and stormwater. These efforts, however, are hindered due to industrial contamination of a large share of the groundwater basins in the Los Angeles area, thereby preventing further development of local groundwater resources (Hughes et al., 2013; Morris, n.d.). Recently, the prolonged and unprecedented drought in California has placed additional pressure on Los Angeles’ water supply and water governance. Some have argued that the current drought may be the new normal condition given that the paleo record shows the region has more often experienced dry conditions than the relatively wet conditions of the past century (Ingram and Malamud-Roam, 2013).
Los Angeles has also struggled with air pollution and smog since its rapid industrialization in the late 19th and early 20th centuries due to oil refining, manufacturing, trucks, automobiles, and the combination of these pollutants with the city’s geographic location in a basin. In Southern California, levels of ozone (O3), particulate matter less than 10 microns in diameter (PM10), and nitrogen dioxide (NO2) have long been among the highest in the United States, and carbon dioxide (CO2) emissions resulting from activities by all sectors within the city of Los Angeles are estimated at 51.6 million metric tons (City of Los Angeles, 2007, 2008). Again, Los Angeles provides an illustration of the importance of considering urban footprints as extending beyond city boundaries. For example, particulate matter 2.5 (ppm) emissions for the city of Los Angeles appear to be lower than the national average; however, this is due to the downwind impacts of pollutants originating in the city. Thus, air quality issues in Los Angeles are best considered at the basin scale rather than only at the city or county level (Gold et al., 2015a). Air pollution is exacerbated due to Los Angeles’ characteristic marine layer, which traps particulates and gases in a layer near the ground. Air pollution and smog were first recognized as issues of concern in 1943, though the attribution of primary cause to automobiles did not occur until a few years later. Over the next decade, the Los Angeles metropolitan region led the way in attempting to ameliorate these issues by establishing a Bureau of Smoke Control in the city in 1945, and an Air Pollution Control District in the county in 1947. Through a combination of policy directives, regulations, and innovative programs at the city, county, and state levels, air quality in the Los Angeles metro region has improved, though it remains a significant challenge to sustainability efforts (CARB, 2015; LAWeekly, 2005).
In addition to water and air issues, the climate, geography, and geology of the Los Angeles metropolitan area render the city vulnerable to various environmental risks and resulting disasters. The region has a history of winter storms producing incredible rates of rainfall and resulting flooding and mudslides. The 24-hour record rainfall for California, 26.12 inches, occurred just north of downtown Los Angeles in 1943 in the San Gabriel Mountains foothills. These significant rainfall events are often due to sea surface temperature anomalies in the Pacific Ocean, commonly known as the El Niño/La Niña effects, which have historically produced heavy rainfall in Southern California. Other environmental hazards include the large incidence of wildfires that are especially destructive
along the region’s extensive wildland-urban interface. Major earthquakes produced by the large fault network in Southern California have had an occasional but significant negative impact on the region’s economy and health, particularly among less-resilient populations (Doocy et al., 2013).
The social and economic impacts of these environmental hazards are not evenly distributed. Although all are exposed to hazards, such as earthquakes, wildfires, and floods, in the Los Angeles region, as well as in other regions of the country, socially and underprivileged populations are often concentrated in areas where environmental vulnerabilities are most severe. Epstein et al. (2014) noted that in Los Angeles, vulnerability is very irregularly distributed across society. For example, the 1994 Northridge Earthquake destroyed over 49,000 housing units and the Red Cross was housing up to 7,000 per night during the crisis. As a result of this earthquake, housing and housing-related issues became a significant challenge, especially related to affordable housing and vulnerable populations. This continues to be a significant challenge for the region (Epstein et al., 2014).
Economic Issues
In Los Angeles County, leisure and hospitality are the leading industries, with the motion picture and entertainment industry generating approximately $120 billion annually (LATCB, 2015). In the city of Los Angeles, the education, professional, leisure, and retail sectors constitute the largest share of the local economic drivers, with 61 percent of jobs in 2013 (Southern California Association of Governments, 2015). In terms of economic well-being, per capita income in 2013 in the city averaged $27,829, on par with that of the county, while median household income in the city totaled $49,497, with the state average being $60,094 and the national average $51,939 (U.S. Census Bureau, 2015b).
As an integral component of the economy of California—the eighth largest in the world—the Los Angeles metropolitan area is a center of global trade and entertainment. Combined, the Port of Los Angeles and the Port of Long Beach are a gateway to more than 43 percent of all goods entering the United States, with $426 billion handled through the Los Angeles Customs District in 2014. LADWP is the largest municipal utility in the United States, and LAX airport, along with LA Ontario International Airport and Van Nuys Airport, served over 80 million passengers worldwide in 2014 (City of Los Angeles, 2007; LATCB, 2015).
Social and Cultural Issues
Poverty remains a significant issue in Los Angeles. In the city of Los Angeles, 22 percent of the population lives below the poverty level, compared to 17.8 percent in Los Angeles County, 15.9 percent in the state of California, and 14.5 percent nationally (U.S. Census Bureau, 2015b). A large portion of this percentage is due to housing-induced poverty, housing constituting the single largest expenditure of households throughout the nation (McConnell, 2012). The city contains approximately 1,300,000 housing units for close to 4,000,000 people (U.S. Census Bureau, 2015b). In addition, in spite of featuring the largest health and social services system available to the homeless in the United States, Los Angeles County continues to have the highest concentration of homeless individuals in the nation (Garcetti, 2015a; Guerrero et al., 2014). In September 2015, Mayor Eric Garcetti announced a homelessness crisis in the city of Los Angeles, along with a comprehensive strategy to tackle the situation that includes $100 million in annual city funding—the latest 2015 estimates place 25,686 homeless in the city of Los Angeles and 44,359 in the county (Garcetti, 2015b). A census of the homeless in Los Angeles County released in May 2015 found that the number of people bedding down in tents, cars, and makeshift encampments had grown to nearly double the number from 2 years earlier (Holland, 2015).
In terms of education, the Los Angeles Unified School District is the largest public school district in California and the second largest in the nation, following New York. The latest data for the 2014-2015 school year placed student enrollment at 899,190 throughout the entire district, as compared to 985,695 (2014 data) in New York City. In LA County, 74.5 percent of the population have obtained a high school diploma (86 percent in both New York City and the United States, according to 2013 data), while only 31.1 percent (58.9 percent in New York and 28.8 percent nationally, according to 2013 data) have a bachelor’s degree or higher, despite the prevalence of higher education institutions in the area. Los Angeles has 113 accredited colleges and universities (LATCB, 2015;
Los Angeles Unified School District, 2015; NYC Department of Education, 2015; U.S. Census Bureau, 2015a). In higher education, the University of California system has made important strides related to economic diversity, as gauged by the percentage of students enrolled who receive Pell Grants, or grants provided to undergraduates with family incomes of less than $20,000, with 28 percent of students at the University of California, Los Angeles (UCLA) receiving Pell Grants (Leonhardt, 2015).
MAJOR SUSTAINABILITY EFFORTS
The Los Angeles metropolitan region, as described above using both city and county examples, faces several key sustainability challenges, including water quality and supply issues, a severe drought, poor air quality, urban sprawl, poverty, high housing costs, and severe natural hazards. These challenges are compounded by projections of significant population growth, with the Los Angeles metropolitan area expecting a population increase of more than 500,000 by 2035 (Garcetti, 2015a). Some select challenges and related initiatives are described below. Many of these were described in a recent review of the state of the environment in Los Angeles, conducted by UCLA, that developed the county’s first environmental report card using indicators on water, air, ecosystem health, waste, energy and greenhouse gases, and environmental quality of life (Gold et al., 2015c). In 2015, the mayor of Los Angeles also released LA’s Sustainable City pLAn, an outcome-based plan for the city that provides specific targets for meeting sustainability goals related to air, energy, water, transportation, and urban ecosystems (Garcetti, 2015a). In terms of the Los Angeles metropolitan area, some cities have taken unique overall approaches to sustainability efforts: for example, Santa Monica’s sustainability “Bill of Rights” and Long Beach’s initiative of a climate-resilient city (see Box 4-1).
Water
The Los Angeles metropolitan area’s water supply system is vulnerable, particularly to climate change; warmer and wetter winters mean less snow pack and the current system relies on snow pack, not winter rain. A significant portion of the city’s water comes from the Sacramento-San Joaquin River Delta, which is susceptible to earthquakes (levee failure) and ecosystem stresses, and the San Fernando Valley aquifers have a legacy of contaminates from industry pollution. Restrictions on water withdrawals from Mono Lake and dust emission controls from the Owens Lake bed have reduced water from those sources. Future water sources will likely be more diverse and drawn from local groundwater, stormwater capture, conservation efforts, and water recycling.1
The area is currently experiencing extreme drought conditions for a fourth year, which has resulted in an emergency declaration by Governor Jerry Brown and the passage of numerous drought-response measures, including requirements for statewide water conservation and increased water use reporting. Governor Brown called for immediate, voluntary 20 percent reductions. The Water Conservation Act of 2009 set a goal of reducing per capita urban water use by 10 percent by December 31, 2015, and by 20 percent by December 31, 2020, while the Water Action Plan, released in 2013, provides specific measures for improving water supply and quality in the state (Gold et al., 2015c). In addition, Proposition 1 was also passed, which provided essential resources for local water supply through water recycling, groundwater cleanup, and stormwater capture.
The UCLA environmental report card has provided an assessment of the county’s water quality and quantity. The following are several highlights:
- “Currently, approximately 58% of the water used in LA County is sourced from outside the region.
- Between 2000 and 2013, per capita water demand dropped by roughly 16%; however, there have not been gains in these areas in the last few years and use increased from approximately 155 gallons per capita per day [GPCD] in 2010 to 160 GPCD in 2013.
- Based on the publicly available sources of data, nearly everyone in the Los Angeles area was provided with clean water in 2012.
- Contamination of groundwater wells is prevalent countywide. The principal contaminants include solvents, nitrates, benzene, MTBE and perchlorate” (Gold et al., 2015c, p. 4).
LADWP manages the Los Angeles water system, which is the largest municipal water system in the United States, providing power and water to over 4 million people per day. The LADWP provides over 494 million gallons of water delivered per day or 553,900 acre-feet per year.2
Several initiatives are under way including distributing stormwater capture from large dams and centralized storage ponds to cisterns, rain gardens, and rain barrels; using purple pipe for nonpotable reused water; taxing stormwater in Santa Monica; increased investment in groundwater pollution remediation; and moving water storage to underground tanks rather than open reservoirs, among others.3
Los Angeles Mayor Garcetti issued Executive Directive 5, which calls for a 20 percent water use reduction from 2014 consumption levels (131 GPCD as of June 2014) by January 2017 and a 50 percent reduction in purchased imported water (89 percent in 2013) by 2024 and creates an integrated water strategy (Garcetti, 2015a).4 In addition, the recently released Los Angeles Sustainable City pLAn includes several near-term goals (by 2017) for the city related to water, including the following:
- “Secure additional funding for San Fernando Groundwater Basin clean up
- Establish Water Cabinet to implement key aspects of local water policy
- Expand recycled water production by at least 6 million gallons per day by 2017 (MGD)
___________________
1 Sutley, N. 2015. Comments by Nancy Sutley of the Los Angeles Department of Water and Power to the National Academies of Sciences, Engineering, and Medicine’s Committee on Urban Sustainability: Pathways and Opportunities. Los Angeles, April 29.
2 Sutley, N. 2015.
3 Sutley, N. 2015.
4 Sutley, N. 2015
- Replace 95 miles of water pipe infrastructure
- Reduce number of annual sewer spills to less than 12.”
In addition, the entire region has initiated aggressive lawn replacement programs with rebates of up to $3.75 per square foot in the city (Garcetti, 2015a, p. 20).
Air Pollution
Since its industrialization in the 19th and 20th centuries, Los Angeles has struggled with issues of air quality, pollution, and smog. According to the American Lung Association 2014 State of the Air report, Los Angeles County ranks among the top five polluted areas in the United States for ozone and PM2.5 (particulate matter with diameter equal to or less than 2.5 microns), while the U.S. Environmental Protection Agency (EPA) has categorized the Los Angeles metropolitan region as having the worst quality of any other region in the country (Garcetti, 2015a; Gold et al., 2015a).
While the Los Angeles region has relatively poor air quality today, the city has made large improvements since the mid-20th century. Los Angeles County was the first county in California to establish an Air Pollution Control District, as well as one of the first to standardize “Visible Emissions Programs” throughout the country (CARB, 2015). The Los Angeles basin has made significant improvements in improving air quality for national ambient air standards and air toxics: reducing the number of smog days from over 200 in the 1980s to less than 50 in 2005, reducing diesel particulate matter in the Port of Los Angeles by 80 percent since 2005, and enacting several laws and regulations by the California Air Resources Board (CARB). Despite these improvements, air pollution and toxic emissions remain a substantial sustainability challenge—the metropolitan area continues to be in nonattainment (air pollutants exceeding federal standards) for ozone and particulate matter, as well as at continuing risk regarding diesel particulates, despite significant emissions reductions. In general, 90 percent of the air pollutants in 2012 were attributed to mobile source emissions, with the outstanding 10 percent from stationary sources such as large industrial factories and refineries (Gold et al., 2015a).
To address this critical issue of air pollution, the City of Los Angeles has set a number of goals, outlined in the 2015 Sustainable City pLAn, which largely focuses on technological fixes, i.e., transitioning to low- or zero-emissions transportation sources, as well as low- to zero-emissions commercial goods movement. The city intends to install 1,000 new publicly available electric vehicle charging stations by 2017, to have zero nonattainment days by 2025, to have electric or zero-emissions vehicles constitute 25 percent of light-duty passenger vehicles in use by 2035, and to have 25 percent of all commercial goods movement employ zero-emissions technology, also by 2035. In addition, the city will require 85 percent of its fleet, 100 percent of city refuse collection trucks and street sweepers, and 100 percent of Metropolitan Transportation Authority buses be powered by alternative fuels, such as compressed natural gas (Los Angeles County Metropolitan Transportation Authority, 2007). The Port of Los Angeles is also in the process of fully implementing the San Pedro Bay Ports Clean Air Action Plan, while Los Angeles World Airports has been focusing on a comprehensive strategy to green Los Angeles metro area airports, including use of alternative fuels and evaluation methods for aircraft-related greenhouse gas (GHG) emission reduction (City of Los Angeles, 2007). Furthermore, the city is addressing air quality through a literal greening of the city. The 2007 initiative to plant 1 million trees in Los Angeles has since been combined with LADWP’s Trees for a Green LA to make one unified tree planting program for the city, called City Plants, with a focus on low-canopy areas versus tree numbers. Moreover, 35 new parks have been added to the city since 2010 (City of Los Angeles, 2007; Garcetti, 2015a; McPherson et al., 2011).
Transportation
Wachs (2015) noted that “transportation policy and planning is intimately related to sustainability in two primary ways. First, travel is an essential activity in urban areas to support economic, social, and cultural activity, but all modes of travel require the use of energy and because vehicular transportation relies on fossil fuel energy it contributes to environmental pollution and greenhouse gas emissions. Many strategies for achieving
sustainability in other dimensions worsen traffic congestion and increase emissions.” California, including the city of Los Angeles, is making important strides to address significant transportation challenges related to sprawl and auto dependency, particularly related to vehicles, fuels, and mobility.
As mentioned previously, the metropolitan area has two of the largest ports in the United States and transports nearly half of the containers from Asia to the United States. It is an international travel hub with five commercial airports and has dozens of major freeways. In addition, the Los Angeles County Metropolitan Transportation Authority is the third largest transit agency in the country. Growth in travel is expected to substantially increase, though with limited growth potential in capital expansion of transportation networks (Wachs, 2015). The infrastructure and financial support for the region’s transportation system also faces challenges; the infrastructure is badly in need of repair and modernization and the revenue needed to support the system is in decline, as it relies on user fees which have not been raised. Measured progress in reforming transportation systems has occurred through technological changes and controls. These include smog controls on vehicles, trains, ships, and planes, as well as vehicle electrification (Sperling, 2015). HOT (High Occupancy/Toll) lanes, open to multiple-occupant vehicles without charge and single-occupant vehicles for a toll, are also a promising option, according to Wachs.
California policies have been able to influence the national discussion on these issues, including requirements related to GHG light-duty vehicle standards, requirements for trucks, and a state action plan for zero-emission vehicles (described below). California policies have also increased investments in and sales of plug-in electric vehicles and low-carbon biofuels, thereby stimulating innovations in new low-carbon technologies (Sperling and Eggert, 2014). Other impacts include state regulation such as Assembly Bill 32, the Global Warming Solutions Act of 2006, which mandated the state to reduce its GHG emissions to 1990 levels by 2020. In addition, the Sustainable Communities and Climate Protection Act of 2008 addressed the following:
- Land-use growth pattern that accommodates the region’s future employment and housing needs and that protects sensitive habitat and resource areas;
- A transportation network that consists of public transit, highways, local streets, bikeways, and walkways;
- Transportation Demand Management measures that reduce or eliminate peak-period demand on the transportation network, such as carpooling, telecommuting, vanpooling, and other innovative programs such as “parking pay-out” (employers offer the cash value of a parking subsidy to any employee who does not drive to work in the form of a transit, vanpool, or carpool/walk/bike subsidy); and
- Transportation System Management measures that maximize the efficiency of the transportation network, such as signal timing, freeway ramp metering, and bottleneck relief/auxiliary lane projects (Wachs, 2015).
The Los Angeles metropolitan area and the state in general have embraced transit-oriented development, rail and express bus improvements, and smart growth. This is evidenced by the $40 billion being invested in rail, rapid bus, and other improvements, expanding the current rail system by 26 miles in the city alone (Garcetti, 2015a). The Los Angeles Sustainabile City pLAn includes several long- and short-term targets related to transportation as well as some general strategies. The latter include
- Improving pedestrian and bicycle infrastructure and other sustainable transport, emphasizing connections to mass transit;
- Expanding high-quality transit options across the city;
- Leveraging zoning, planning, and community vibrancy to move Angelenos closer to work and transit; and
- Securing new funds for mobility projects.
Overall, the California policy model which comprises a comprehensive mix of rules, incentives, and market instruments provides an illustrative example of progress made within the transport sector (Sperling and Eggert, 2014).
OTHER SIGNIFICANT ACTIVITIES
California has been a leader in renewable portfolio standards and greenhouse gas reduction, as well as building energy efficiency standards. CARB’s enforceable cap and trade regime requires that the state lower its GHG emission levels 25 percent by 2020. California additionally has a 33 percent renewable portfolio standard requirement. However, the city is still one of the largest electricity importers in the state, while Los Angeles County still generates 99.1 million metric tons of CO2, approximately 21.7 percent of California’s 2009 total GHG emissions. This is largely due to automobile and truck fossil fuel consumption. The county’s GHG emissions are largely comprised of building energy, 39.2 percent; on-road transportation, 33.5 percent; and stationary sources, 19.7 percent (Gold et al., 2015a). The last available data for the city itself placed GHG emissions for the city of Los Angeles at 51.6 million metric tons of CO2 in 2004.
To transform Los Angeles into a more sustainable and efficient metropolis, the city’s living Climate LA Program document and Sustainable City pLAn both outline a number of goals regarding renewable energy, green buildings, and energy efficiency for the city. Currently, the LADWP’s energy resources consist of 20 percent renewables (mostly wind at 13 percent), 21 percent natural gas, 10 percent nuclear, 4 percent hydroelectric, 33 percent coal, and 12 percent other or unspecified sources (LADWP, 2015a).
LADWP has established its own renewable portfolio standard goal of 35 percent renewable energy by 2020. To meet this renewable energy goal, LADWP has focused on developing new renewable energy projects in Southern California and their associated transmission lines. The department has been developing a number of resources, such as wind in the Tehachapi Pass area north of the city and geothermal in Salton Sea to the east. LADWP is also aiming to reduce the use of coal-fired power plants, with the goal of divesting completely from coal power by 2025 (City of Los Angeles, 2007; Garcetti, 2015a). Los Angeles already has the most installed capacity of megawatts of solar power in the United States and upwards of 1,500 megawatts (MW) of energy storage provided by LADWP’s Castaic Pumped-Storage Plant. Moreover, the city’s sustainability plan includes goals of 1,800 MW of solar power by 2035 and 1,750 MW of energy storage by 2025, with concrete targets in funding the Solar Incentive Program, expanding the Feed-in-Tariff program, energy grid modernization plans, energy storage pilot technology, and solar installations on new and existing city projects (such as the Los Angeles Convention Center). Overall, the city is pursuing ambitious goals of a 45 percent reduction of GHG emissions from 1990 baselines levels by 2025, 60 percent by 2035, and 80 percent by 2050 (Garcetti, 2015a). In addition, local mitigation through “cool roofs” is another element in the region’s concept of energy sustainability as a science-driven solution; in December 2013, Los Angeles became the first major city to require every new and refurbished home to have a “cool roof,” with a goal of installing 10,000 by 2017 and reducing the heat island effect by 3 degrees by 2035 (Climate Resolve, 2013).5
The city hosts the largest municipal green-building program (requiring Leadership in Energy & Environmental Design [LEED] Silver or better) and has the most EPA-rated Energy Star certified buildings in the United States, with LADWP’s energy efficiency program being one of the most aggressive in the state. The city has set goals to reduce the energy use per square foot below the 2013 baseline for all building types by at least 14 percent by 2025 and 30 percent by 2035, and to use energy efficiency for 15 percent of all of LA’s projected electricity deliverables needs by 2020 (Garcetti, 2015a). Los Angeles endeavors to reduce energy consumption in all city departments, perform energy-efficient retrofits on city buildings, and implement energy-efficient strategies and technologies on wastewater equipment and drinking water treatment and distribution facilities (City of Los Angeles, 2008).
SUMMARY OBSERVATIONS
Despite facing a number of sustainability challenges, the Los Angeles metropolitan region has introduced several innovative initiatives related to energy and transportation, while the current drought has forced changes to water consumption and related behavior. These challenges have driven the city to develop an aggressive results-based sustainability plan, with specific targets and outcomes, that relies on fruitful collaborations across municipal departments and institutions (rather than top-down approaches) and the proliferation of innovative new science
___________________
5 Parfrey, J. 2015. Comments by Jonathan Parfrey of Climate Resolve to the National Academies of Sciences, Engineering, and Medicine’s Committee on Urban Sustainability: Pathways and Opportunities. Los Angeles, CA: Climate Resolve.
and technologies. The city of Santa Monica has taken an even more comprehensive approach to sustainability, by, for example, developing a Sustainability Bill of Rights and a stormwater tax, demonstrating a mentality that is unafraid to implement divergent, innovative ideas and to fail.6 Progress toward the realization of quantitative actionable goals is illustrated in such initiatives such as City Plants—the result of combining LADWP’s Trees for a Green LA Program and the city’s former tree planting program Million Trees LA—which focuses on expanding and maintaining LA’s green canopy, and is enshrined in the urban ecosystem topic area of Los Angeles’ Sustainable City pLAn (“expand number of parks and open spaces for Angelenos”); as well as the Great Streets initiative—a partnership with the Mayor’s Office, City Council, and a team of various stakeholders to develop community partnerships and receive targeted city services to activate streets as public spaces—which is also identified in the pLAn as part of the livable neighborhoods topic area (“implement improvements on 15 commercial corridors/Great Streets”), of which the first 15 “great streets” have already been identified, and resources for the second round of “great streets” is being currently sought after (Garcetti, 2015a; Great Streets, 2016; McPherson et al., 2011).
More broadly, the state is often able to drive national changes related to sustainability issues, including transportation and climate change. For example, Sperling and Eggert (2014, p. 88) note that “California has been a leader in advancing policy solutions to environmental and energy challenges since the 1960s. Many of those policy innovations have spread worldwide. Beginning with statutes passed by the California legislature starting in 2002 and continuing through today, California is adopting a comprehensive set of policies, regulations, and incentives to reduce greenhouse gas emissions, with particular emphasis on those associated with transportation, vehicles, fuels, and mobility.”
Nevertheless, other lessons learned from the Los Angeles case include those sustainability challenges that are still lacking in innovative solutions. Though the region has begun to take strides in addressing social sustainability issues, such as the recent programs initiated by the United Way of Los Angeles in addressing homelessness by implementing a three-part systems approach uniquely focusing on providing services to individuals, income inequality and other social issues have not yet been integrated fully into sustainability decision making.7,8
Taken as whole, Los Angeles has made significant progress (see Figure 4-3) toward some of the most prominent sustainability challenges, largely through a combination of regulation, technological advancement, cross-cutting collaboration, and aggressive policy changes.9 Despite the continued obstacles and thus far unaddressed gaps that remain, LA provides important lessons regarding the importance of partnerships, connectivity, and multiscale processes and, moreover, provides an innovative example of where mixing these approaches can supply multiple benefits.
___________________
6 Gold, M. 2015. Comments by Mark Gold of the UCLA Institute of the Environment and Sustainability to the National Academies of Sciences, Engineering, and Medicine’s Committee on Urban Sustainability: Pathways and Opportunities. Los Angeles: UCLA Institute of Environment and Sustainability.
7 Gold, M. 2015.
8 Margiotta, C. 2015. Comments by Christine Margiotta of the United Way of Greater Los Angeles to the National Academies of Sciences, Engineering, and Medicine’s Committee on Urban Sustainability: Pathways and Opportunities. Los Angeles: United Way of Greater Los Angeles.
9 Gold, M. 2015.
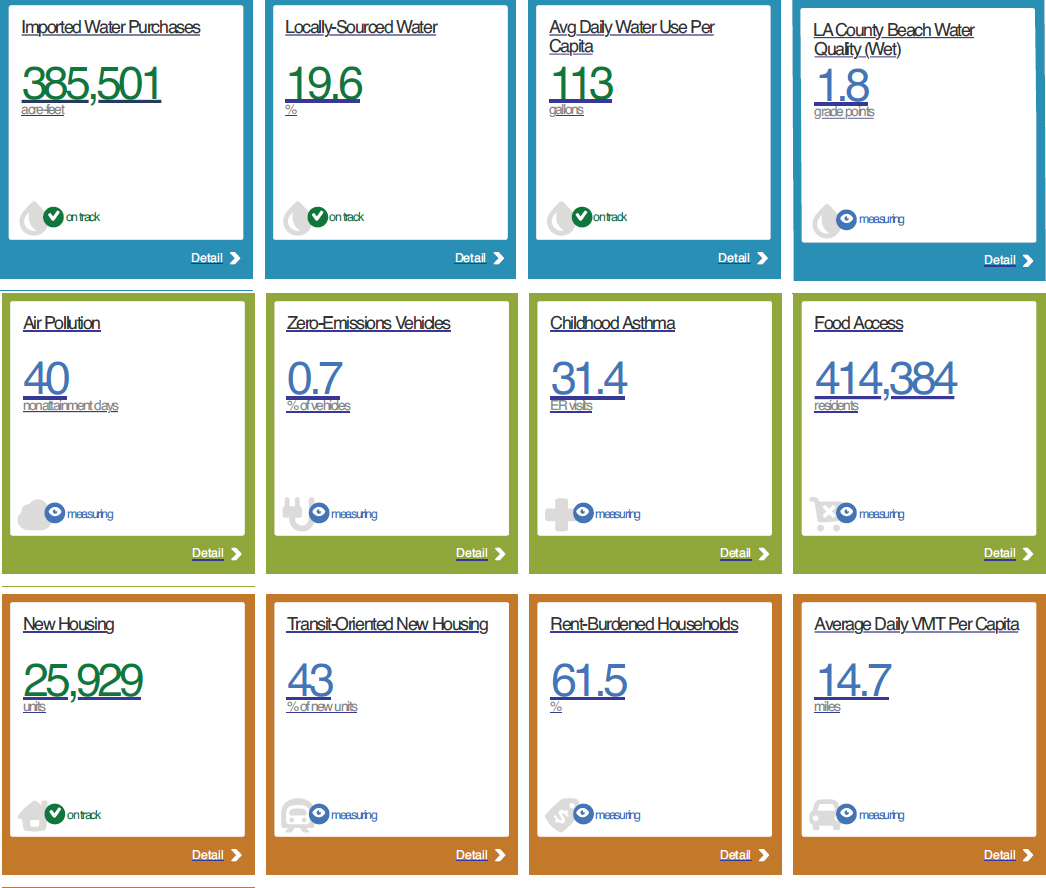
TABLE 4-2 Example Highlighting Actions for Los Angeles that Illustrate Steps in Urban Sustainability Roadmap (see Chapter 3, Figure 3-1)
| City | Los Angeles |
|---|---|
| Adopt Principles | P1, P2, P3, P4 |
| Opportunities and Constraints | Opportunities: Water supply; air pollution Constraints: Poverty, vulnerability to environmental risks and disasters: floods, earthquakes, wildfires. |
| Prioritize Co-net Benefits | Water supply; air pollution; poverty; housing affordability; ability to decarbonize; inequality and the capability and planning for climate change. |
| Partnerships | City Plants, Adopt the pLAn, LA 2030, LA Better Buildings Challenge. |
| Goals | LA Sustainable City pLAn vision set around 14 topic areas: local water, local solar power, energy-efficient buildings, carbon & climate leadership, waste & landfills, housing & development, mobility & transit, prosperity & green jobs, preparedness & resiliency, air quality, environmental justice, urban ecosystem, livable neighborhoods, and lead by example. |
| Strategies | LA Sustainable City pLAn, Green LA and corresponding implementation plan: Climate LA; LADWP established its own renewable portfolio standard; Santa Monica’s sustainability “bill of rights”; Long Beach’s Climate Resilient City initiative. |
| Data Gaps | Distinguishing between city, county, metropolitan-area-level data. |
| Implementation | Groundwater, recycled water and stormwater program – 1970. Bureau of Smoke Control in the city in 1945. Air Pollution Control District in the county in 1947. Water metering and water reclamation programs – resourced by Proposition 1 – Water Action Plan, 2013; LADWP established its only renewable portfolio standard. |
| Local to Global | Regulation by the California Air Resources Board – reduce diesel particulate matter Assembly Bill 32, Global Warming Solutions Act of 2006. |
| Public Buy-in | Voluntary 20% reductions in water consumption, lawn replacement programs. |
| Feedback | Performance tracking for LA Sustainable City pLAn, UCLA Environment Report Card, investment in rail, rapid bus, and pedestrian and bicycle infrastructure. |
NEW YORK CITY
As the city of New York navigated the opening decades of the 21st century, major forces, both exogenous and endogenous, have shaped and reshaped New York’s approach to economic, social, and environmental dimensions of urban sustainability. High on the list of exogenous forces that occurred in the early part of the 21st century was Superstorm Sandy, which affected many dimensions of everyday life and the societal responses at many levels (neighborhood, borough, citywide, state led, and federal) and from many quarters (including the private, public, and independent sectors and collaborations among those sectors). High on the list of endogenous forces is the decision by the administration of Mayor Bill de Blasio to redefine urban sustainability as the development of policies and projects that generate “growth, equity, sustainability and resilience” as articulated in the administration’s 2015 One New York: The Plan for a Strong and Just City (henceforth referred to as OneNYC) initiative and the initiative’s explanatory document, the 300-plus-page roadmap in OneNYC.
Throughout its many initiatives, New York City is intensifying its reliance on 21st-century science and technology, including informatics and big data. Climate change on the Eastern Seaboard, including the New York metropolitan region, and the need to address climate hazards, vulnerabilities, and risks in a sustained and thorough manner led New York’s local government to institutionalize and mandate the periodic collection and analysis of scientific data on climate-related issues. Superstorm Sandy and its aftermath reacquainted New Yorkers with the negative consequences of a long-standing structural arrangement within New York City and its region: the tendency
toward the division of power and responsibility for critical, lifeline infrastructure networks in the public sector, in part a result of the scale and complexity of the city’s infrastructure and its financial base. Public and private infrastructure entities within the city and the region have acknowledged this issue; in many of these cases, entities have formed working groups to map vulnerabilities and interdependences related to the status quo for managing over the course of a natural or human-made event through recovery.
As New York City pursues the four-dimensional sustainability agenda embodied in the OneNYC blueprint (Box 4-2), it may present both strengths and challenges. To manage the distribution of responsibility and power, the art of intergovernmental collaboration and partnership, along with public-private partnerships, will need to be operationalized and optimized if New York City is to achieve its urban sustainability goals within the timeframes articulated on Earth Day 2015.
BACKGROUND
The sustainability of the City of New York encompasses numerous dimensions—social, economic, and environmental (including climate related)—and their interrelationships. Those dimensions have been shaped by the city’s scale, location, and diversity of its population and economic base. Given the city’s unique characteristics, it often tests the limit of sustainability goals. Due to New York City’s role as a test bed for many socioeconomic innovations in the 19th and 20th centuries, its 21st-century approaches may turn out to be scalable and suitable for adaption in other cities and metropolitan regions.
Geography
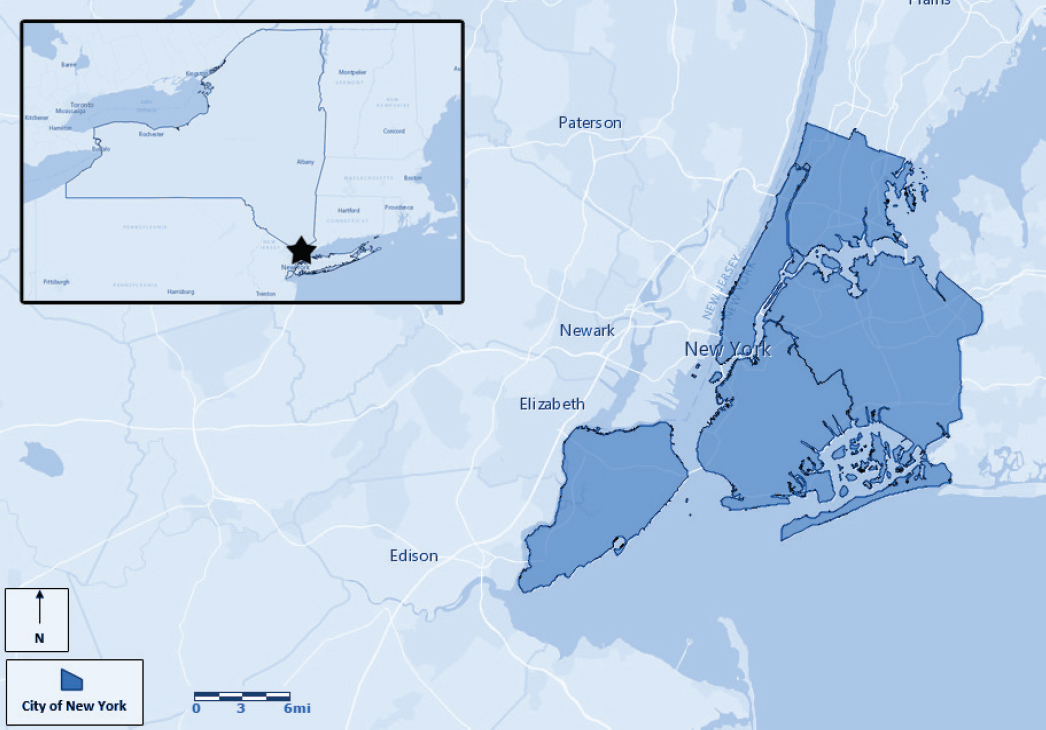
New York City’s geography and topography set the stage for both sustainability challenges and opportunities (Figure 4-4). Though often overlooked and underappreciated, most of New York City is part of an archipelago; the only part of the city that is not on an island is the borough of the Bronx, the city’s only segment on the mainland of the Lower 48. New York City is comprised of five boroughs (officially designated as counties) surrounded by waterways, totaling more than 500 miles of coastline. The boroughs are connected by numerous bridges and tunnels, estimated at more than 2,000, owned and operated by multiple entities.10 This network of infrastructure
___________________
10 This number of bridges in New York City is often cited; for example, J. Ganley. 2008. New York City’s Bridges: Construction and Maintenance, New York, NY: New York Public Library; New World Encyclopedia. New York. Online. Available at http://www.newworldencyclopedia.org/entry/New_York. Accessed April 12, 2016.
enhances circulation but adds complexity to the movement of goods and people in and around the city. A natural harbor has supported the city and its region, which ranks among the top ports in the United States in terms of total calls and other measures of port activity such as tonnage and value (PANYNJ, 2015a,b); it reached a record volume of activity in mid-2015 (Whelan, 2015). New York City’s vast coastline has long been a contested space, resulting in competition and disputes between and among social groups, economic interests, and political jurisdictions; ownership of the coastline continues to be balkanized. The de Blasio administration’s OneNYC plan and the previous administration’s PlaNYC, other city waterfront plans, and other entities in the private and nonprofit sectors have proposed strategies and projects to deal with coastline and waterfront issues.
Social Context and Demography
Population, population change, and population density are important inputs for building indicators of urban sustainability. New York City and the greater New York metropolitan region have the highest population and population density in the United States (Powell, 2014). The sustainability challenge confronting the city is marshaling the regional resources required to match the needs of such a large, diverse, dense, and changing population. New York City’s 2014 population is estimated to be 8,491,079, the largest of any other U.S. city (Cohen et al., 2015; U.S. Census Bureau, 2014a). According to U.S. Census Bureau data, the city’s population has been increasing since
1980 and that trend is projected to continue (NYC Office of the Mayor, 2015a). New York City is at the core of a world-city region defined in a number of ways.11 The city’s population is about one-third of the population of the combined statistical area and a larger portion of the metropolitan statistical area.12 In addition to the resident population, the city accommodates a large, constant flow of commuters and visitors, both foreign and domestic. Between 2010 and 2014, the U.S. Census reported a rate of change for the city’s resident population of 3.9 percent, compared with 1.9 percent for New York State and 3.3 percent for the United States (U.S. Census Bureau, 2015b).
New York City also ranked highest in population density among large urban places, with 27,781.2 people per square mile reported in 2013 (Cohen et al., 2015). This is many times higher than New York State’s population density of 411.2 persons per square mile (2010) and the U.S. density of 87.4 (2010) (U.S. Census Bureau, 2015b).13 Within New York City, however, population density and changes in density are not uniform, and between 1970 and 2010, for example, population density declined in many lower-income neighborhoods, which has been attributed to population losses in the latter part of the 20th century, while density increased in middle-income and upper-income areas (NYU Furman Center, 2015).
The 2010 American Community Survey (ACS)14 of race and ethnicity characteristics from 2009-2013 indicated that New York City was 46.5 percent white, 27.3 percent black or African American, 13.9 percent Asian, 2.4 percent American Indian and Alaska Native, and 0.3 percent Native Hawaiian and Other Pacific Islander. Hispanics or Latinos comprised about 28.6 percent during this same period; 15.1 percent were categorized as members of some other race or group (Powell, 2014). Blacks and Latinos constitute a larger share of the overall New York City population when compared to their share of population in New York State or in the United States as a whole (U.S. Census Bureau, 2015b). The change in the racial and ethnic makeup of the city has been noteworthy, for example, with the share of some minority groups (Asian and Hispanic). The percent of elderly (those over 65 years) is also increasing, according to the U.S. Census.
Poverty alleviation and job creation are critical cornerstones of the OneNYC plan (NYC Office of the Mayor, 2015a). Poverty takes its toll, degrading access to education, safety, health care, and jobs (Kneebone, 2014). Chetty et al. (2015) linked long-term, subpar social outcomes to living in a high-poverty neighborhood as opposed to better social outcomes for those who lived in a lower-poverty neighborhood. New York City was one of the five cities they studied. Poverty is measured in many ways, such as percentage of the population below the federal poverty line or by income (NRC, 1995). The ACS average for the population living below the poverty line in New York City from 2009 to 2013 is 20.3 percent, though it varies for different population groups (Powell, 2014). By comparison, the poverty rates for New York State and the United States are 15.3 and 15.4 percent, respectively. In OneNYC, City Hall identifies three levels of poverty: 23.6 percent near poverty, 15.8 percent in poverty, and 5.7 percent in extreme poverty; according to the plan, together these three categories total 45.1 percent of the city’s residents. People who fall into these three groups are unevenly distributed across New York City boroughs and 59 community districts (NYC Office of the Mayor, 2015b). The NYU Furman Center (2013) notes that over time “[t]he percentages of both high- and low-income households in New York City have grown as the share of middle-income households has shrunk.”
Lowrey (2014) identified a positive relationship between poverty and rich-poor disparities and found that the New York City metropolitan area ranked among the top few U.S. cities with such disparities. A Brookings Institution study in 2014 identified the movement of the poor from cities to suburbs, a trend in many large metropolitan areas, including the New York City region. The study found that for the New York City metropolitan area suburbs,
___________________
11 The 31-county metropolitan area is defined in various ways: as a 31-county, tristate metropolitan region (Yaro and Hiss, 1996, p. 20) and alternatively as the NY-NJ-PA Metropolitan Statistical Area and the Combined Statistical Areas (that encompass portions of Connecticut as well) and Metropolitan Divisions. See Executive Office of the President, 2013, p. 16. According to one definition, there are 15 counties in New Jersey, 12 in New York, and 4 in Pennsylvania (A. Strauss-Wieder, Inc., February 2014, p. 4).
12 The U.S. Census Bureau defines New York, New Jersey, and counties in northeastern Pennsylvania as a metropolitan statistical area and a combined statistical area that includes portions of Connecticut that had a population of about 23 million in 2010, which is also the area with the highest population in the United States.
13 The U.S. and New York State density figures are overall indicators of density, not specific to urban areas.
14 The percentages cited in the text differ slightly from those cited in ACS Appendix Table 2 of indicators and in Table 4-3 above for NYC due to the method of aggregating the time period.
TABLE 4-3 Key Characteristics for New York City
| Indicator | New York City | United States |
|---|---|---|
| ENV Average Annual Precipitation (inches/year) | 46.2 | 40.8 |
| ENV Existing Tree Canopy (% of land cover) | 21% | 25% |
| ENV Roadway Fatalities (per 100 million annual vehicle miles traveled) | 0.9 | 1.1 |
| ENV Particulate Matter 2.5 (ppm) | 10.8 | 10.2 |
| ENV Residential Carbon Footprint (metric tons of CO2 per capita from residential energy consumption) | 1.8 | 3.4 |
| ECON Financial Health | AA | AA+ |
| ECON Average Residential Electricity Rate (cents/kWh) | 23.2 | 11.9 |
| SOCIAL Black or African American | 28.1% | 13.2% |
| SOCIAL Hispanic or Latino | 29.0% | 17.4% |
| SOCIAL Asian | 14.4% | 5.4% |
| SOCIAL Home Ownership (2009-2013) | 32.8% | 64.9% |
|
SOCIAL High School Graduate |
79% | 86% |
| SOCIAL Below Poverty Level | 20.4% | 15.4% |
| SOCIAL Violent Crimes (per 100,000 people) | 628 | 191 |
NOTE: ENV, ECON, and SOCIAL refer to the three dimensions of sustainability: environmental, economic, and social, respectively. SOURCE: Appendix B.
the poor population increased by 21 percent between the 2000 and 2008-2012 time periods compared with a decline of 3 percent in the poor population in the urban portion of the region (Kneebone, 2014). (See Table 4-3 for key characteristics of New York City.)
There is generally a deficit of public transportation services in areas that surround urban areas, which can compromise the ability of the poor to access jobs (Zimmerman, 2012). In addition, in New York City, Zimmerman et al. (2014) found that one tendency was that for areas with a higher percentage of the population below the poverty line in a census tract in which a subway station was located, fewer buses were likely to stop within a tenth-of-a-mile radius around those stations, thereby potentially compromising multimodal connections.
Housing and Housing Affordability
Poverty also shows relationships to housing affordability. New York City’s housing across all demographic groups is affected by policy, programs, land-use plans, and market forces. The city’s housing stock has experienced pricing boom and bust periods, yet shows an overall net increase: “New York City housing prices experienced two periods of rapid increase—1980-1989 and 1996-2006—and two periods of decline—1974-1980 and 1989-1996. Fortunately, both booms were substantial, and both busts, although difficult, were relatively small. Overall, prices increased by 250 percent from 1974 to 2006” (NYU Furman Center, 2008, p. 9). Though high-end housing has been achieving record prices, affordable housing and rental units are still a major public policy priority. The de Blasio administration intends to address this gap by planning to create 200,000 affordable units over 10 years (NYC Office of the Mayor, 2015a). The goal of the city’s housing plan is to generate construction and permanent jobs at an estimated cost of $41.4 billion over the same period (NYC Housing and Economic Development, 2015).
Through mid-2015, the city was apparently ahead of its target. However, the allocation of these units has raised potential segregation issues (Davis and Appelbaum, 2015; Ramey and Kusisto, 2015).
The share of rental versus owner-occupied housing is higher in New York City than in other cities, and the New York City Department of City Planning notes that “approximately two-thirds of dwellings in New York are renter-occupied, over twice the national average” (NYC DCP, n.d.). New York City and New York State have recently renewed legislation that will protect rent-stabilized apartment units. An affordability measure for rental housing is the rent-to-income ratio. New York City renter incomes did not rise as fast as rents between 2005 and 2012, and in 2012 about one-half of the renter population was paying almost one-third of its incomes for rent, which is considered “rent burdened” (NYC Housing and Economic Development, 2015).
Environmental Issues
Many dimensions of the built environment and associated land use in New York City have a significant impact on New York City’s capacity to pursue and achieve environmental sustainability, including building in a manner that will not compromise ecologically sensitive areas and areas particularly vulnerable to adverse environmental conditions associated, for example, with extreme weather events and climate change. Many of those areas, either ecologically sensitive or vulnerable to climate-related risks, are candidates for economic development projects and social sustainability projects. New York’s density generally supports a land-use pattern that is associated with lower per capita car ownership and lower vehicle miles traveled than in other U.S. cities; in turn, this set of conditions contributes to lower direct sources of locally generated GHG emissions enabled by extensive use of mass transit (buses, subways, and regional rail) (U.S. Census Bureau, 2015a). From a social sustainability perspective, the nature of land use is such that the distance between residences and workplaces necessitates a commute averaging almost 45 minutes in New York City (U.S. Census Bureau, 2014d). The OneNYC plan notes the variability in access to jobs via public transit and notes that low-income populations have longer commute times via public transit (NYC Office of the Mayor, 2015a).
The built environment is estimated to account for the largest source of New York City’s carbon emissions—more than 70 percent (City of New York, 2014, p. 24), which probably reflects direct emissions. Addressing emissions from the built environment is among the challenges elevated in the OneNYC roadmap, which divided its pursuit of policies, projects, and goals into “growth, equity, sustainability and resilience” (NYC Office of the Mayor, 2015a).
Environmental conditions are often summarized as global carbon or environmental footprints or overall rankings of a number of different climate-related dimensions, as described in Chapter 2. The Economist Intelligence Unit (2011), the Global Footprint Network, and others have conducted environmental and climate-related assessments of New York City. The city’s environmental conditions have been characterized by the quality of its air and water with health implications and environmentally sensitive areas, such as wetlands. Climate change is addressed in a separate section.
In general, the city’s environmental conditions have improved in terms of meeting or making incremental progress toward achieving federal standards for clean air and clear water, described below. Like elsewhere in the United States and the rest of the developed urbanized world, reducing GHG emissions and other factors associated with it remains a major challenge. Reducing GHG emissions from the built environment, the city’s largest source of locally generated emissions, is fundamental to managing climate change and building resilience for extreme weather events. Land-use decisions over decades, many of which were incremental, resulted in construction on and extension of low-lying areas that have since been vulnerable to water inundation from more intensive storms, sea-level rise (SLR) and storm surge, and especially the interaction of SLR, storm surge, and tidal cycles. In addition, numerous accidents involving privately held lifeline infrastructure have disrupted and damaged New York City, including the citywide 2003 Northeast–Canada electric power blackout and those preceding it. The hard, direct economic impact of the September 11, 2001, terrorist attack on the World Trade Center is now well understood. The attack cost the city over $30 billion (Bram et al., 2002); it took years for the city to recover from that damage. The collateral effects and costs of September 11, 2001, are not as well understood. Many of the services
rebounded while many residents and workers continue to grapple with the lingering social, emotional, and health effects of the attack.
Each of these circumstances had different origins, exposures, recovery times, and short-term and long-term approaches to resolution. In order to address these issues in the context of sustainability, the city has engaged in numerous planning and legislative processes. These included citywide broadly based efforts, the latest of which are covered, for example, in PlaNYC and OneNYC (NYC, 2007, 2011, 2013; NYC Office of the Mayor, 2015a).
The government of New York City exercises direct control over a small share of the built environment through ownership or use for governmental purposes as well as regulation over other sectors. Mazria (2015) offered a guide to proposed changes in the New York City Energy Conservation Code to support energy efficiency and renewable energy in order to catalyze a reduction of GHG emissions from the built environment that is largely controlled by the private sector and nonprofit or civic sector.
Initiatives also appear in the sustainability strategies for specific sectors. In transportation, the following sustainability actions have been undertaken: the addition of many more miles of bike lanes, the creation of a bike share system, and the implementation of sustainable measures in its mass transit and other transportation systems, including the rollout of the Metropolitan Transportation Authority (MTA) Select Bus Service (the MTA’s move into a form of Bus Rapid Transit in Manhattan and other boroughs). In water, New York City’s water supply system has benefited from the utilization of an ecosystem-services-based remote water sourcing strategy. The system consists of four water supplies: the Catskill/Delaware supply, the Croton supply, the city’s original upstate supply, and a groundwater supply system in southeastern Queens. Through a combination of land acquisition, land management, and partnership programs, New York City’s Department of Environmental Protection (NYC DEP) has demonstrated extensive efforts to protect the city’s watersheds, particularly through the use of land stewardship approaches in the Catskills (NYC DEP, 2013a).
Wetlands in New York City have declined as they have in many other places in the country. New York City estimates the loss at 85 percent for coastal wetlands and 90 percent for freshwater wetlands (City of New York, 2012b, p. 3). Governance of wetland resources is comprised of public and private ownership and the wide variety of management structures that exist for it (NYC, 2012). Federal and state regulatory efforts are addressing the decline through a number of regulatory and planning programs. The city is surrounded by more than 500 miles of coastline, owned, operated, and maintained by numerous jurisdictions. The New York City Department of Parks and Recreation maintains about 150 miles of coastal parkland, or about 30 percent of the city’s coastline (NYC, 2014b). The NYC waterfront plan routinely addresses the waterfront and its uses. The Hudson River Estuary, New York Harbor, Jamaica Bay, Long Island Sound, and East River, and various smaller areas, such as the Bronx River and Gowanus, are other important environmentally sensitive areas, all with separate planning efforts and public, private, and nonprofit jurisdictions and mechanisms in place to improve or maintain their quality (EPA, 2012a). Water quality citywide is reflected in 1,546 waterways characterized as “impaired” under section 303(d) of the Clean Water Act (EPA, 2012b). There are numerous indicators of water quality. Dissolved oxygen is one of the major indicators, with higher values signifying better water quality and the ability to sustain aquatic ecosystems. The 2014 report by the city indicated that dissolved oxygen levels have improved over the decades and are now reported as averaging 6.0 mg/l, above the highest standard, which is 5.0 mg/l.15 Concentrations of bacteria have been reported as improving and are below the standards (NYC DEP, 2012).
Economic Issues
Over the centuries, the city has survived a series of financial catastrophes, including the mid-1970s brush with bankruptcy, economic losses sustained from the September 11, 2001, terrorist attack on the World Trade Center, and national recession, including the Great Recession following the collapse of Lehman Brothers during 2008. The city’s economic and financial strength is reflected in a series of indicators, including its bond ratings,
___________________
15 Dissolved oxygen standards vary from waterway to waterway and depend on the designated usage of a given waterway. For “bathing and other recreational uses,” which is among the highest use with more stringent water quality standards, the city indicates that the dissolved oxygen standard is 5.0 mg/l.
SOURCE: NYC Office of the Mayor, 2015a. Permission granted from U.S. Census Bureau. LEHD Origin-Destination Employment Statistics, v. 7. Geography: Neighborhood Tabulation Area.
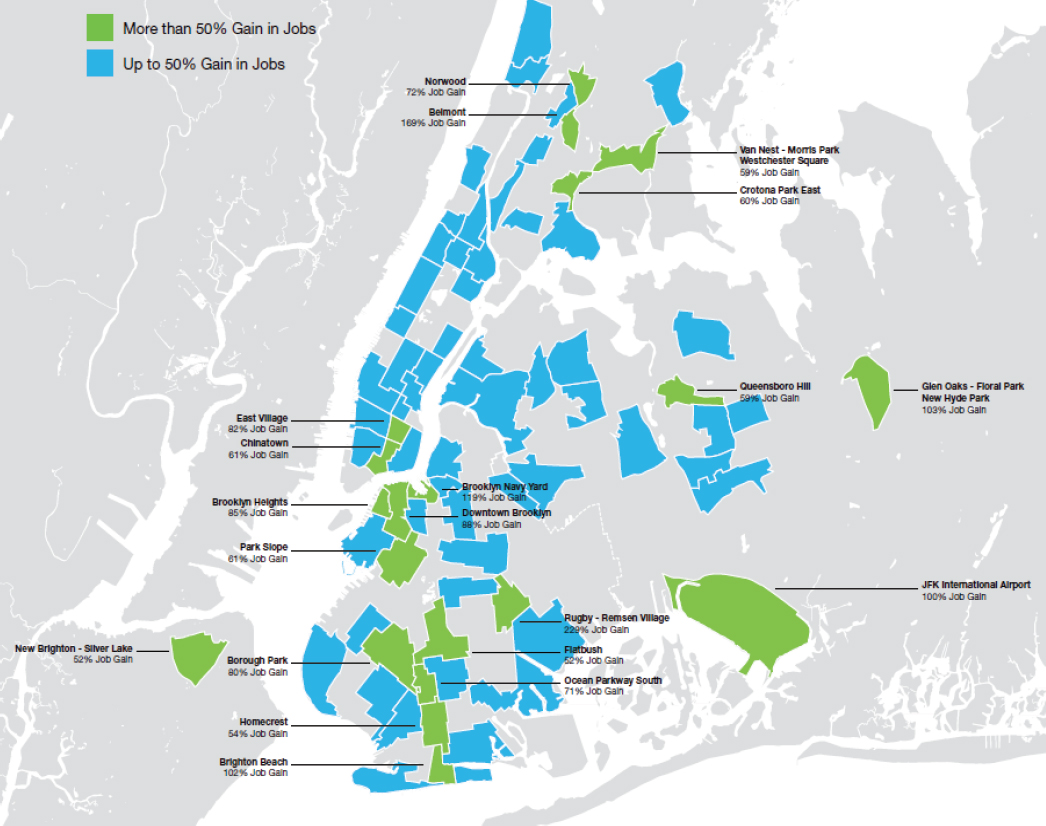
gross city product, workforce characteristics, and income levels. As a result of the mid-1970s fiscal crisis, the city embarked upon a strategy of diversification of lending sources through the New York State Municipal Assistance Corporation. By 2015 the city reported that Moody’s rated New York City general obligation (GO) bonds at Aa2, and Standard & Poor’s (S&P) and Fitch rated GO bonds AA, the third highest S&P rating, levels it has maintained for a number of years (NYC, 2015b). The gross domestic product (GDP) and gross city product (GCP) of New York, measures of economic performance, continue to increase (NYC Comptroller, 2014). Median income levels continue to rise. However, those in poverty and those caught up in intergenerational poverty continue to constitute a large share of the city’s population (Figure 4-5). This reflects a longstanding socioeconomic problem within the city including the factors associated with poverty, such as availability of jobs and education, racial and ethnicity conflicts, health problems, health outcomes, and quality of life. Social and economic strife resulting in riots and labor strikes also affected the stability of the city.
The distribution of economic establishments in New York City is identified in the U.S. Census. According to Bram and Orr (2015), the New York City economy continues to maintain its robustness with New York City job growth exceeding that of the United States since 2007.
The U.S. Census reports that the distribution of the workforce 16 years old or older in the New York Core Based Statistical Area (CBSA) indicates that the top three sectors are (1) education; (2) information and technology, finance, insurance, and real estate; and (3) professional services. Together they account for over one-half of the employment (Executive Office of the President, 2000; U.S. Census Bureau, 2014a).
A few sectors exemplify patterns and trends in the economy, namely the Finance, Insurance, and Real Estate (F.I.R.E.) and Technology sectors. The F.I.R.E. sector and professional services in terms of salaries, wages, and contributions to the City’s GDP/GCP are key to New York City’s economic base, a shift from over a century ago when the economic base was largely manufacturing. Technology sectors have had a unique history in New York City. Bram and Ploezke (2015) found employment increased between 2007 and 2014 in the technology sectors, while acknowledging the challenges in defining that sector. New initiatives in the technology arena in New York City include the emerging Cornell University technology center on Roosevelt Island and the Center for Urban Science and Progress at New York University, which both received startup grants from the Bloomberg administration. This example shows how stakeholders can better integrate science, technology, and research into catalyzing and supporting sustainability initiatives.
The city’s goods movement sector is among the largest in the United States, which is reflected in marine, air, and ground transportation, and some of these sectors produce flows across city boundaries that contribute to its sustainability. In the marine sector, the size and capacity of marine ports are measured as number of containers and twenty-foot equivalent units (TEUs), calls, tonnage (as metric tons), value of cargo or market share, and other measurements. The Port Authority of New York and New Jersey (PANYNJ) is considered the largest on the East Coast and third largest after Los Angeles and Long Beach in the United States in terms of TEUs handled (PANYNJ, 2015a,b). PANYNJ reported that in 2014, metric tons of all cargo increased 2.7 percent, value increased 2.5 percent, and containers increased 5.6 percent over 2013 levels (PANYNJ, 2015b). Strauss-Wieder’s model estimated that PANYNJ supported the following in terms of job generation and related economic support: “165,350 direct jobs, 296,060 total jobs in the Region, over $18.3 billion in personal income, nearly $28.9 billion in business income, and more than $6.1 billion in federal, state and local tax revenues, with local and state tax revenues of over $2.05 billion and federal tax revenues of nearly $4.07 billion” (A. Strauss-Wieder, Inc., 2014, p. 2). Of this bistate total, A. Strauss-Wieder noted that the port supports in New York City alone “17,040 direct jobs, 34,830 total jobs in the City, nearly $3.3 billion in personal income, almost $7.6 billion in business income, and over $1 billion in federal, state and local tax revenues, with local and state tax revenues of almost $414 million and federal tax revenues of over $640 million” (A. Strauss-Wieder, Inc., 2014). The city’s economy—via investments by PANYNJ, a public benefit corporation controlled by the governors of those two states—benefits from dredging programs that deepen the channels for larger cargo vessels, which helps the bistate port remain competitive with other major ports.
In summary, the city’s economy by a number of measures related to business outcomes and employment has shown mixed trends. The government has addressed financial issues in part by diversifying its sources of funds, which higher bond ratings now reflect.
Public Health Issues
Human health is measured using numerous indicators: years of potential life lost, death rates, injuries, and incident and mortality rates for specific diseases for different population sectors, for example, by age (children and the elderly), income, gender, race, and ethnicity. The overall premature age-adjusted mortality per 100,000 for the five counties of New York City indicate that the Bronx has the highest premature age-adjusted mortality per 100,000, followed by Richmond (Staten Island), Kings (Brooklyn), Queens, and New York (Manhattan) (RWJF and University of Wisconsin Population Health Institute, 2015). Other indicators have been provided by the city’s Community Health Profiles issued in 2015. The New York City Community Health Profile reports show that the infant mortality rate per 1,000 live births citywide is 4.7, obesity citywide is 24 percent, flu vaccination rates are
40 percent, and perception of health status is 78 percent citywide indicating excellent, very good, or good (NYC Department of Health and Mental Hygiene, 2015).
In general, relationships between income and availability, access, and affordability of health care are critical concerns in urban areas. The NYCHealth health goals were supported by meeting clean air goals set in the PlaNYC 2007 plan, and improvements in asthma, cardiovascular disease, and death rates have been attributed in part to declines in PM2.5, commonly known as soot (NYC Health, 2013a).
The National Ambient Air Quality Standards (NAAQS) are the benchmarks for ambient urban air quality; however, almost 200 hazardous air pollutants are also major benchmarks (EPA, 2014c). The New York State Department of the Environment identified 17 air quality monitoring sites in NYC for all parameters (NYS DEC, 2015). Ozone areas designated as attainment or nonattainment with respect to NAAQS are defined by the EPA. Transportation-related air quality issues in New York City and counties to the north and west are addressed in conformity regulations under the Clean Air Act and dealt with as part of the New York Metropolitan Transportation Council reviews. The Air Quality Index values for New York City for 2012 indicate a maximum (out of 500) of 150 and a median of 55 on a scale of 0 (the best) to 500 (the worst) (EPA, 2015a).
Attainment with NAAQS is an important measure of air quality. As of October 1, 2015, EPA listed the five NYC counties of the CBSA as being in nonattainment for the 8-hour ozone standard (of 2008), and New York County was listed in moderate nonattainment for PM10 (EPA, 2008). The micrograms per cubic meter of PM2.5 ranged from 10.7 to 10.9 depending on the county within NYC (RWJF and University of Wisconsin Population Health Institute, 2015).
Linkages between air quality and health are continually made. New York City as of the first part of the 21st century has been considered a nonattainment area for ozone and had been a nonattainment area for PM2.5, though it is now in compliance with PM2.5 (NYS DEC, 2014). The NYC Health Department attributes ozone pollution largely to traffic density, and traffic is also a key source of PM2.5 (NYC Health, 2013b). NYC-reported results of its street-level monitoring program, the New York City Community Air Survey, found over the period from 2008 through 2013 increases in three pollutants—fine particles (PM2.5), sulfur dioxide (SO2), and nickel (Ni)—where building concentrations were high, and therefore the Clean Heat program was introduced to eliminate residual oil for heating (NYC, 2013).16 Traffic is another source of NAAQS pollutants, particularly particulate matter. Zimmerman and Restrepo portrayed the potential for exposure to particulate matter and other traffic-related air pollutants in the South Bronx, New York, in terms of the proximity of schools to roadways (Zimmerman and Restrepo, 2004-2009).
Asthma has been potentially viewed as linked to air quality, and New York City ranks high relative to the rest of New York State in terms of indicators such as prevalence rates, emergency department visits, and hospital discharge rates: “Geographic differences continue to be seen. Adults who live in New York City had higher current asthma prevalence in 2011, and also had higher age-adjusted asthma emergency department visit, hospital discharge, and mortality rates for 2009-2011 when compared to residents in the rest of the State” (NYS Department of Health, 2013, p. 2). At the county level, asthma emergency department visit and hospital discharge rates varied across New York State for 2009-2011, with the highest rates in the Bronx, and for the Bronx specifically, the age-adjusted emergency department visit rate was 231.4 per 10,000 residents, the hospital discharge rate was 63.3, and the death rate was 43.5 per million—all the highest in the state (NYS Department of Health, 2013). The NYC Community Health Profile data report child asthma hospitalization rates per 10,000 children, and the average citywide is 36, ranging from 72 in the Bronx to 15 in Staten Island (NYC Department of Health and Mental Hygiene, 2015).
Climate and Weather Risks
Locally generated GHG emissions are targeted to be 80 percent lower by 2050 than in 2005 (80x50), and the city has already reported a 19 percent drop in those emissions, which it indicates is “nearly two-thirds of the
___________________
16 The U.S. Energy Information Administration defines residual fuel oil as “heavier oils, known as No. 5 and No. 6 fuel oils, that remain after the distillate fuel oils and lighter hydrocarbons are distilled away in refinery operations.”
way toward an intermediary goal of reducing GHG emissions 30 percent by 2030”; that in turn is attributed to the increased use of natural gas (NYC, 2015a). New York City conducts a buildings emissions inventory every year to ascertain its performance.
Extremes of temperature and precipitation and storm frequencies occur in New York City. From 1971 to 2000, “New York City averaged 18 days per year with maximum temperatures at or above 90°F, 0.4 days per year at or above 100°F, and two heat waves per year” (Horton et al., 2015, p. 25). For low-temperature extremes: “From 1971 to 2000, Central Park averaged 71 days per year with minimum temperatures at or below 32°F” (Horton et al., 2015, p. 25). Precipitation extremes measured as “the number of occurrences per year of precipitation at or above 1, 2, and 4 inches per day for New York City (at the weather station in Central Park) since 1900” indicate that historically “between 1971 and 2000, New York City averaged 13 days per year with 1 inch or more of rain, 3 days per year with 2 inches or more of rain, and 0.3 days per year with 4 inches or more of rain. As with extreme temperatures, year-to-year variations in extreme precipitation events are large. There has been a small but not statistically significant trend toward more extreme precipitation events in New York City since 1900” (Horton et al., 2015, p. 25).
The National Oceanic and Atmospheric Administration storm events database lists 656 extreme weather events of all types in the five boroughs alone between 2005 and June 1, 2015, resulting in 123 deaths. The New York City Hazard Mitigation Plan provides a count of just coastal storms from 1785 to 2012: There were 26 storms listed and 10 of these (38.5 percent) occurred since 1990 (NYC, 2014b, 2015a). Specific extremes are noteworthy, namely Hurricane Irene and Superstorm Sandy. In addition to hurricanes, flash flooding episodes occurred most recently in the first decade of the 21st century, disabling infrastructure. An August 2007 rainstorm that occurred during the morning rush hour shut down many subway lines and stations, and disrupted service for parts of the Long Island Rail Road and Metro-North Railroad. Major snowstorms, most notably the December 26, 2010, “snowmaggedon,” had similar impacts. The frequency and persistence of these events are important to incorporate into any sustainability strategy for the city, and the OneNYC plan emphasizes that.
The Mayor’s Management Report (2014) outlined a set of accomplishments designed to address the consequences of Superstorm Sandy (NYC, 2014a). New York City is investing $3.7 billion in physical coastal protection planning, including coastal dunes, berms, trapbags, sand nourishment, green infrastructure, bluebelt projects, the creation of resilience standards for key assets, applications for Federal Emergency Management Agency support, reconstruction and rebuilding, environmental monitoring, legislation, and grants and loans for rebuilding.
New York City’s reported achievements, as measured against its sustainability goals, are in energy efficiency, energy-use analyses, promotion of alternative energy sources, GHG emissions reductions (19 percent between 2005 and 2012), changes in the Air Pollution Control Code for air quality improvements, solid waste reduction, and other cleanup efforts (NYC, 2014a).
Infrastructure
New York City continues to see an increase in the demand, use, and consumption of its infrastructure services, new levels of demand that often seem to exceed capacity and resources. The extent of use of infrastructure facilities and the extent and condition of infrastructure are key metrics. The Center for an Urban Future (2014) identified persistent infrastructure conditions such as age and breakdowns that affect lifeline infrastructure’s capacity to meet rising demands.
Ownership, operation, and jurisdiction over New York City’s streets, roads, bridges, and mass transit are balkanized. The City of New York manages almost half (789) of the bridges that connect its boroughs and the city to adjacent regions (NYC Department of Transportation, n.d.). Trans-Hudson bridges and tunnels are owned and operated by PANYNJ, a bistate public benefit corporation that is under the jurisdiction of the governors of those two states. Nine other crossings (two tunnels and seven bridges) are owned and operated by the MTA, a New York State–run public benefit corporation.
Commuting characteristics show that public transit dominates, and has the highest number of passenger trips and passenger miles of travel by public transit, about six times the trips in the second ranking city, Los Angeles (APTA, 2015, Appendix B). Box 4-3 depicts some selected highlights of transit activity throughout the metropolitan
area. For example, 58.7 percent of worker trips use public transportation (DOT, 2015). New York City accounts for 81 percent of the New York-New Jersey-Connecticut region’s unlinked passenger trips and 55 percent of the passenger miles (computed from APTA, 2015, Appendix B), reflecting the density of travel and corresponding density of transit mileage for those trips. Mass transit use continues to increase, and it achieved record levels in 2015 (MTA, 2015). The MTA has developed and implemented a number of sustainability initiatives, including energy and water conservation and renewable energy projects (MTA, 2009). Walk score calculations for NYC indicate 88, 81, and 65 out of a maximum of 100 for walking, transit, and biking modes, respectively (Walk Score, 2015a).
The New York State Independent System Operator (ISO) reported that electric power usage in New York City has been declining slightly since 2010 (around 1 percent per year). ISO reports that over three-quarters of the generation capacity of the city relies on “dual fuel” or the gas and oil (with some units being able to switch between the two) (NYS ISO, 2015). An overall reliability index, the System Average Interruption Duration Index, for New York City’s Con Edison service area is 19 minutes per customer per year (EIA, 2015a; Interstate Power and Light Company, 2012; NYS DPS, 2014). Resiliency measures have been identified for weather and climate
protection initiated in part by Superstorm Sandy (Consolidated Edison and Orange and Rockland Utilities, 2013). New York City is targeting the building sector in its energy reduction strategies because annual building inventories continue to show the dominance of that sector for energy consumption and carbon emissions from energy (NYC, 2014a). To promote renewable energy, a number of financial incentives exist for solar panel installations, such as property tax credits and New York State’s sales tax exemptions and rebates. In addition, New York City and Con Edison are partnering to designate “Solar Empowerment Zones.” New York City ranked seventh among the 57 cities that Environment America identified for “cumulative solar PV Capacity (MW),” but with a rank of 41 for per capita levels (DOE, n.d.; Environment America Research & Policy Center, 2015).
The U.S. Geological Survey reports water consumption as 75 domestic gallons per capita per day for each of New York City’s counties (USGS, 2010). The city’s water supply, some of which is drawn from as far as 125 miles to the north, continues to provide reliable water in terms of quality and quantity, and in terms of NYC DEP jurisdiction, did so before, during, and after Superstorm Sandy. Once the supply leaves the city’s jurisdiction and reaches private property, however, supplies can become compromised by loss of power required to pump the water, which happened in high-rise apartment buildings as Superstorm Sandy moved through the city and region (Zimmerman et al., 2015).
The City of New York relies upon structural and nonstructural approaches to reduce water pollution from both sanitary sewers and runoff over land surfaces. As part of the recovery from Superstorm Sandy, the NYC DEP identified where vulnerabilities were in relation to each wastewater treatment plant and its components (NYC DEP, 2013b).
For solid waste management, the OneNYC initiative focused on ending the disposal of solid waste at landfills, and forecasts that the city could reach its zero solid waste goal by 2030. In mid-2015, the city announced requiring the diversion of food wastes from large-scale facilities amounting to about 50,000 tons per year (NYC, 2015c). The Mayor’s Management Report indicated that they were “continuing to work with the Department of Sanitation on the Food Waste Challenge to divert organic waste from landfills, which reduced waste by 2,500 tons in the last six months” (NYC, 2014a).
Institutional Efforts
As illustrated in Box 4-2, New York City has implemented a number of integrated initiatives aimed at furthering sustainability efforts for the metropolitan region. Other notable institutional efforts include a governance structure involving 59 community boards that are required to review and approve plans that affect neighborhoods within the boundaries of each community board; review processes for capital programs, for example, for transportation through the New York Metropolitan Transportation Council; zoning ordinance changes, e.g., Zone Green, to accommodate green infrastructure; and construction and energy codes incorporated into numerous sustainability initiatives, as well as citywide and areawide plans and programs, such as the Regional Plan Association fourth regional plan, along with ongoing studies of the distribution of inequities in the region (NYC, 2012; RPA, 2015a,b).
MAJOR SUSTAINABILITY EFFORTS: A SUMMARY
Three key sustainability efforts for New York City are (1) the ability to decarbonize or reduce carbon emissions from infrastructure and other components of the built environment as a means of mitigation and adaptation with respect to climate change, (2) inequality, and (3) infrastructure needs and interdependencies.
Decarbonization and Climate Change
New York City faces continual challenges in meeting its resource needs and the targets it has set for renewable energy resources, waste management, and GHG emission reductions. These are especially formidable challenges given the scale of the city and the vulnerabilities it faces. In response to these needs, the city regularly inventories its emissions particularly from what it has identified as the key emission sector—buildings. It participates in LEED and other programs for emissions reduction. The projections for climate change and their ramifications, for
example, for extreme heat, precipitation and downpours, storms, and sea-level rise have been identified toward the end of the 21st century by the NPCC and others. These projections yield considerable escalations in all of the consequences and the vulnerability of the built environment and the social and economic systems that they support. These analytical efforts, as well as a commitment to reduce emissions, have led to a very large and diversified program for adaptation in New York City.
Inequality
Of particular importance is the ability to address existing and projected needs of the poorest segments of society. Though the city’s economy continues to grow and the environment and public health are generally improving, poverty and housing needs and pockets of health issues continue to affect major segments of the city’s residents and neighborhoods, according to the OneNYC plan. To address this need, the city has undertaken an affordable housing program and programs to support the workforce.
Infrastructure Needs and Interdependencies
A continually eroding infrastructure base to which funding gaps contribute cannot meet the needs of its current and anticipated users equitably. The agencies that control the infrastructure stock within the city’s borders make interim and often short-term adjustments to this situation given funding constraints. Exacerbating the situation is the control by both public and private entities beyond the city’s and the region’s borders of these physical systems, and they often have competing interests. This is magnified in many ways by the interconnections among infrastructures and between city services and the region from which it draws resources and gives back services. In severe weather conditions and other natural hazards, these interconnections often magnify the adverse consequences. They need to be understood and acted upon. The organizations within the city and the region have acknowledged these issues, and in many cases have formed working groups among the responsible organizations to target these problems.
TABLE 4-4 Example Highlighting Actions for New York City that Illustrate Steps in Urban Sustainability Roadmap (see Chapter 3, Figure 3-1)
| City | New York City |
|---|---|
| Adopt Principles | P1, P2, P3, P4 |
| Opportunities and Constraints | Opportunities: Affordable housing to address widening income gap and persistent pockets of poverty; vulnerability to climate change with major programs under way for adaptability and mitigation. Constraints: Infrastructure investments are a major constraint to bringing services to or maintaining services at sustainable levels. |
| Prioritize Co-net Benefits | Density: transport, CO2, access to jobs; linkages between air quality and health. |
| Partnerships | Community Boards/Districts Public-sector partnerships within a number of different venues, e.g., the NYC Mayor’s Office of Recovery and Resiliency and New York City Panel on Climate Change task forces. Emergence hubs of innovation where academics, corporations, and government collaborate, e.g., Cornell and NYU centers of innovation and others. |
| Goals |
The goals of the OneNYC Plan (pp. 5-6):
|
| City | New York City |
|---|---|
| Strategies | Jobs Affordable housing Reaching climate change goals by emphasizing building-sector emissions and emphasizing adaptation and mitigation planning and implementation. Generally reaching environmental goals, e.g., water and air in conformance with federally approved state and city regulations. Increased tree canopy through the planting of a million trees. |
| Data Gaps | Citywide resource usage and emission inventories. Partitioning of resources and emissions between NYC, the region, and elsewhere. |
| Implementation | Green Zoning Numerous environmental laws (see text). Sustainability goals (http://www.nyc.gov/sustainability). Adaptation and mitigation planning and implementation and funding to approach these efforts. Plan to create 200,000 units of affordable housing units over 10 years. Financial incentives for solar panel installations, such as property tax credits and New York States sales tax exemptions and rebates. As of April 2015, more than 949,000 trees have been planted as part of the Million Trees Initiative. |
| Local to Global | Federal standards for clean air and water, implemented by state and local government. |
| Public Buy-in | Public opinion polls conducted over time to ascertain public opinion about the city’s environment and various issues within that context that reflect public buy-in at a broad level. These surveys tend to show variable results over time and often depend on what issue is the focus of the poll. The NYC community board/district review process and review processes of other entities are mechanisms for public buy-in. |
| Feedback | GHG: Energy efficiency in buildings and “flood resilience text amendment”; Equity: affordable housing. |
VANCOUVER
A coastal seaport city located on the west coast of Canada, Vancouver is the eighth largest city in Canada and the second largest city on the U.S.-Canadian border. With a population of 600,000 in a region of 2.3 million, Vancouver has diversified its economy away from the resource extraction of its early days and transitioned to using its natural resources as quality-of-life amenities to attract residents and businesses (Statistics Canada, 2011).
BACKGROUND
Vancouver, unlike other British Columbia (BC) municipalities, is incorporated under a charter, the Vancouver Charter (Province of British Columbia, 1953). This legislation, passed in 1953, grants the city more and different powers than other BC municipalities. These powers have allowed Vancouver to make policies and introduce practices that have uniquely placed the city ahead of many other cities in Canada, the United States, and globally in terms of sustainability.
Vancouver is bounded by ocean and rivers on three sides and is located close to sprawling temperate rainforest and mountains (Figure 4-6). Vancouver’s natural resources made it a natural settling place for the Coast Salish First Nations around 2000 BCE and for European and Asian immigrants starting in the 1800s (Musqueam: A Living Culture, 2011). European settlers focused on extracting those resources—first with the aggressive harvesting of
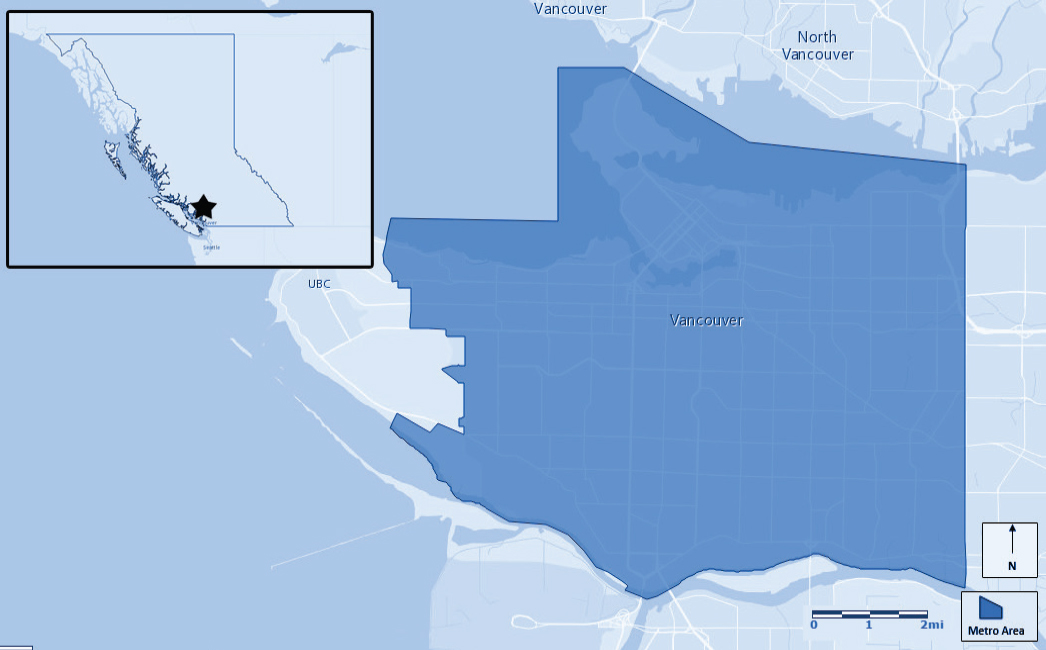
fish and timber, and then in the mid-1800s with the extraction of minerals. Vancouver was also a supply post for teams bound north to stake their claim during the Klondike Gold Rush.
A particularly destructive period in the area’s history spanned from 1850 to 1950. Old-growth forests were quickly harvested to build the city of Vancouver, which was incorporated in 1886. That same year, a clearing fire, set to prepare land for development, swept out of control and burned the city down. The city was rebuilt and Vancouver’s waterfront became home to heavy industry that, in turn, resulted in contamination of the soil and water.
The midpoint of the 20th century proved to be a turning point for the city as a shift in public consciousness and environmental awareness prompted residents to see Vancouver’s natural surroundings not as a resource to be exploited, but as an asset to be protected. With the advent of accessible airplane travel, tourism became a more popular activity globally, and Vancouver’s access to nature made it a popular destination for those interested in outdoor activities such as backpacking, skiing, rock climbing, and kayaking. These activities also became popular pastimes for Vancouver’s residents. As the value of nature activities to the city increased, local wild spaces were protected as parks, and extractive industries moved elsewhere.
By the end of the 20th century, tourism, the information economy, and trade had replaced extractive industries as the city’s primary economic drivers (Vancouver Economic Commission, 2010). Globalization, inexpensive shipping, and Vancouver’s fortunate proximity to Asia made it possible for the city’s port to thrive. Commodities from afar flowed through this strategic location. Global events, such as the World Exposition in 1986 and the Winter Olympic Games in 2010, facilitated the restoration and development of formerly contaminated sites. The city became a magnet for highly skilled workers who settled, started, and grew knowledge-based businesses, and skied and sailed on weekends.
TABLE 4-5 Key Characteristics for Vancouver
| Indicator | Vancouver | United States |
| ENV Average Annual Precipitation (inches/year) | 46.8 | 40.8 |
| ENV Existing Tree Canopy (% of land cover) | 18% | 25% |
| ENV Roadway Fatalities (per 100 million annual vehicle miles traveled) | 0.7 | 1.1 |
| ENV Particulate Matter 2.5 (ppm) | 6.6 | 10.2 |
| ENV Residential Carbon Footprint (metric tons of CO2 per capita from residential energy consumption) | 0.8 | 3.4 |
| ECON Financial Health | AA+ | AA+ |
| ECON Average Residential Electricity Rate (cents/kWh) | 7.8 | 11.9 |
| SOCIAL Black or African American | 1% | 13.2% |
| SOCIAL Hispanic or Latino | 1.6% | 17.4% |
| SOCIAL Asian | 41% | 5.4% |
| SOCIAL Home Ownership (2009-2013) | 48.5% | 64.9% |
| SOCIAL High School Graduate (25 or older, 2009-2013) | 92% | 86% |
| SOCIAL Below Poverty Level | 15.4% | |
| SOCIAL Violent Crimes (per 100,000 people) | 191 | |
NOTE: ENV, ECON, and SOCIAL refer to the three dimensions of sustainability: environmental, economic, and social, respectively. SOURCE: Appendix B.
Ironically, Vancouver’s popularity both as a place to visit and as a place to live is what threatened its future sustainability. In the early 2000s, pressure from population growth brought forests down in the neighboring north-shore mountains for housing developments. Urban sprawl in the eastern suburbs (the only direction in which sprawl could travel due to geographical constraints) created increased congestion on arterial roads and an increased need for public transit. Densification became the only practical solution to meet the demand for growth in the urban core. Land and housing scarcity drove housing prices up, making the city unaffordable for young families. The urban tree canopy thinned as blocks of single-family homes were replaced with towers (City of Vancouver, 2014b). At the turn of the 21st century, Vancouver stood at a crossroads of two opposite futures: foster systemic change to ensure that the city grows while protecting the natural beauty that makes it a desirable world-class destination or become a victim of its own success and let growth continue unchecked, destroying the natural beauty that was once its draw.
MAJOR SUSTAINABILITY EFFORTS
Vancouver residents chose a green future. In 2009, Mayor Gregor Robertson was elected on a platform to make Vancouver the “greenest city in the world.” Upon taking office, he assembled a team of experts to set goals and targets for Vancouver to achieve this bold objective by 2020. During 2010 and the first half of 2011, over 35,000 members of the public were engaged to develop strategies to achieve these targets (City of Vancouver, 2011). These formed the basis of the Greenest City 2020 Action Plan, which was adopted by Vancouver’s City Council in July 2011. It includes a series of goals and targets to be achieved by 2020 (see Box 4-4).
This clear, ambitious, measurable plan has changed the way the city government operates, spawned hundreds of aligned initiatives both inside and outside of the city organization, and changed the face of Vancouver. The
Greenest City Action Plan provides the top-level strategy, under which a host of enabling strategies, policies, programs, and regulations have been and are being developed. Of particular note are the following.
Climate Leadership
Approved by the City Council in 2012, Vancouver’s Neighborhood Energy Strategy is the city’s blueprint to create a network of low-carbon district energy systems to heat buildings in high-density neighborhoods across Vancouver. Supporting city regulation requires developers within identified zones throughout the city to connect buildings to district energy systems as they come online. The area served by Vancouver’s flagship Neighbourhood Energy Utility currently produces 56 percent fewer GHG emissions than a typical neighborhood (City of Vancouver, 2015b). The overall goal of the Greenest City Action Plan is to eliminate dependence on fossil fuels. The plan sets a target to reduce community-based GHG emissions by 33 percent from 2007 levels.
Green Buildings
In Canada, cities have only those authorities expressly granted to them by the province in which they are situated (Government of Canada, 1867). For historical reasons, Vancouver is the only municipality in the province of British Columbia that has its own Municipal Charter and its own building code and therefore has regulative authority beyond those of all other cities in the province (Province of the British of Columbia, 1953). The City of Vancouver regularly updates its building code to increase energy efficiency standards. As a result, today a home built in Vancouver uses 50 percent less energy than those built elsewhere in the province (City of Vancouver, 2014a). The Action Plan strives to have all existing buildings reduce energy use and GHG emissions by 20 percent over 2007 levels and requires all buildings constructed after 2020 to be carbon neutral in operations.
Green Transportation
Approved by the Vancouver Council in 2012, Vancouver’s Transportation 2040 Plan is a roadmap for meeting the Action Plan’s Green Transportation goal to make walking, cycling, and public transit residents’ preferred modes of transport. The 2040 plan prioritizes action based on transportation mode. From highest to lowest priority: walking is followed by cycling, then transit, taxis and shared vehicles, and finally the private car (City of Vancouver, 2012). New infrastructure investment is prioritized based on this hierarchy. As part of this effort, the city has created a network of over 275 kilometers (km) of bike routes throughout the city, including a continuous 28-km path along the waterfront (City of Vancouver, 2015a). Designed for all ages and abilities, these lanes are supporting thousands of trips daily and contributing to an important outcome: Today, half of all trips in the city are made by foot, bike, or transit (City of Vancouver, 2015a).
Zero Waste
The Action Plan calls for Vancouver to reduce waste to landfill by 50 percent. One way to encourage waste reduction is through Extended Producer Responsibility (EPR) programs, which make the producer of a product responsible for taking that product back at the end of its useful life and recycling it. This, in turn, supports a shift in the way producers design products toward reducing the amount of materials used in production and packaging and increasing the ease of diverting these materials from the landfill. Significant environmental and economic benefits have been realized from early EPR programs such as these measured by the Province of BC in 2007 (Gardner Pinfold Consulting, 2008): An annual reduction of 267,000 metric tonnes of carbon dioxide equivalent (MTCO2e), 5.3 million gigajoules in annual energy savings, and 2,100 additional full-time equivalent positions. Because of this, British Columbia continues to roll out EPR regulation for an increasing number of consumer products, most recently in 2014, for paper and packaging. The city of Vancouver is responsible for residential garbage collection, so it works closely with the province and producers to design EPR programs and ensure their efficacy.
Access to Nature
Passed in 2014, the Urban Forest Strategy Framework established the goal of increasing Vancouver’s canopy cover (a measure of the area of the city covered by trees) from 18 to 22 percent by 2055 (City of Vancouver, 2015a). Tree cover provides essential cooling, shade protection, and air quality improvement for city residents, increasing both physical and mental well-being. Vancouver is working toward the Action Plan’s goal to increase residents’ enjoyment of and access to green spaces. In addition to increasing the tree canopy, work is being done to create an environment in which all Vancouver residents live within a 5-minute walk of a park, greenway, or other green space.
Clean Water, Clean Air, and Local Food
The Action Plan strives for Vancouver to be a leader in drinking water quality, air quality, and urban food systems. It wants to meet or exceed the most stringent quality standards and guidelines for water and air quality. In terms of water use, it aims to reduce per capita water consumption by 33 percent from 2006 levels. It plans to increase the number of local food growing, processing, and distribution facilities by at least 50 percent over 2010 levels (City of Vancouver, 2015a).
Green Economy and Ecological Footprint
Building on its reputation as a city specializing in green businesses, the Action Plan calls for Vancouver to double the number of green jobs over 2010 levels and double the number of companies actively engaged in greening their operations over 2011 levels. For the city at large, it seeks to reduce Vancouver’s ecological footprint by 33 percent over 2006 levels (City of Vancouver, 2015a).
OTHER SIGNIFICANT ACTIVITIES
Given its limited jurisdiction, Vancouver knew it could not achieve its 2020 targets on its own; therefore, city staff focused on forming and strengthening partnerships with the private sector, other levels of government, the nonprofit sector, academia, and the public to jointly deliver on their environmental mandate. An external steering committee was formed with representation across all sectors. A $2 million Greenest City Fund was established to provide funding for grassroots efforts to green Vancouver. A “CityStudio” was created in partnership with Vancouver’s six postsecondary academic institutions to incubate and test out bright ideas in the academic setting. Students of these institutions can spend a semester at the Studio receiving course credit while working on projects to help build the Greenest City. In total, over 10,000 people are playing an active role in working toward Greenest City goals (City of Vancouver, 2015a).
Vancouver’s success at achieving Greenest City outcomes and firmly placing itself on the path to true environmental sustainability can be attributed to several key success factors, some of which are recommended best practices for other cities. They are described below.
Socioeconomic Stability
Vancouver had the good fortune to receive an influx of federal investment to build infrastructure for the 2010 Winter Olympic Games during the last global economic downturn. According to a report by PricewaterhouseCoopers, “the midpoint for the range of real GDP impacts from 2003 to March 31, 2010 is estimated to be $2.3 billion dollars” (PricewaterhouseCoopers, 2010). This investment peaked in 2008, the same time at which the global economy reached the bottom of its lowest drop since the 1930s (PricewaterhouseCoopers, 2010). This provided Vancouver with a long period of socioeconomic stability, relative to other parts of North America, for the duration of the delivery of the Greenest City Action Plan.
Strong Public and Political Support
The home of Greenpeace and David Suzuki, Vancouver has a long history of strong public support for sustainability. In fact, the support is so strong that Vancouver citizens elected Mayor Robertson based on his campaign platform that focused on making Vancouver the Greenest City in the world, and have reelected him twice, based in part on the results achieved on this agenda.
Stable Funding
That same strong public support made it possible for the provincial government to pass a carbon tax in 2007 (Box 4-5). Carbon is taxed at a rate equivalent to $30 per metric ton by increasing the cost of GHG emissions generating fuels by a relative equivalent amount (British Columbia Ministry of Finance, 2012). Municipalities get the carbon tax they pay refunded to them on the condition that the funding is used to support sustainability programs. This provides a stable source of funding that is protected from competing internal priorities. Grant funding from utility demand-side management programs also contributes capital. On an annual basis, one-third to one-half of the city of Vancouver’s Sustainability Department budget comes from outside sources, primarily provincial (City of Vancouver, 2015c).
Organizational Capacity and Good Governance
Stable funding creates the organizational capacity needed to implement the mayor’s bold vision. The city has a properly resourced Sustainability Group that provides strategic oversight, technical expertise, and project delivery capacity to accountable owners across the organization, who are, in turn, responsible for delivering on plan objectives. A 2015 survey conducted by the Urban Sustainability Directors Network (USDN) concluded that, of the 12 other member municipalities with a population size similar to Vancouver (500,000 to 750,000), 72 percent had smaller sustainability budgets and 60 percent had fewer Sustainability Department staff than the City of Vancouver.
Strong Cross-sectoral Partnerships
Partnerships with the other levels of government, energy utilities, academia, not-for-profit organizations, and business help to mobilize resources and get results on the ground. For example, in 2010 the City of Vancouver partnered with the University of British Columbia to offer the Greenest City Scholars Program, which enables graduate students to work on sustainability projects with the city in support of the Greenest City Action Plan goals. The 80 projects completed to date have accelerated the implementation of the plan and several scholars have been hired by the city into full-time positions upon graduation.
Sharing of Knowledge Resources and Intellectual Property
The sharing of knowledge and intellectual property between cities and with academia is key to accelerating the rate of change. Vancouver’s deputy city manager co-founded USDN, a North American member-based organization
150 cities strong—cities who share best practices and learnings toward advancing municipal sustainability. Since its inception in 2008, USDN has placed $6 million in collaborative municipal innovation projects and has disseminated this knowledge to other municipalities to encourage replication. Examples of USDN innovation products can be found on the USDN website: http://usdn.org/public/page/56/Innovation-Products.
Active Performance Management
Finally, active performance management ensures that progress toward the goals and targets is measured, tracked, and rewarded. Key sustainability metrics are embedded in the city’s Corporate Scorecard. Key initiatives are embedded in the City of Vancouver’s Corporate Business Plan (City of Vancouver, 2015d).
Vancouver’s Greenest City story provides useful lessons to other municipalities, both at the micro level (through its successful delivery) and at the macro level. Vancouver’s local success has given its politicians a license to operate, and advocate, internationally. Vancouver Mayor Gregor Robertson had an audience with the Pope at the Vatican in July 2015, met with senior climate change staff at the White House in Washington in October 2015, and attended the United Nations Framework on Climate Change Conference of Parties (COP 21) in Paris in December 2015. Vancouver’s political leaders are supporting a growing movement of subnational governments globally who are changing the definition of successful urban development.
However, there is a caveat to Vancouver’s success. The current municipal council and staff have made a lot of progress toward the Greenest City 2020 goals in a short period of time, but this has resulted in fatigue among residents about the amount and rate of change that they have been asked to absorb in pursuit of the sustainability goals. Traffic patterns have been changed when street lanes have been reallocated for bikes and when traffic-calming measures have been implemented to make neighborhoods more walkable. The frequency of garbage collection has been reduced from weekly to biweekly to support the introduction of weekly food scraps collection, changing residents’ waste disposal habits. Ordinances have been passed that restrict the ease with which residents can cut down mature trees on their property. While each individual change was made to support residents’ desire to live in a more sustainable city, the collective impact of all of these initiatives requires a significant amount of behavior change from residents and this has proved to be difficult for some. During the last municipal election, the mayor made a formal apology, acknowledging that some voters had become alienated by the city’s ambitious pursuit of its green agenda. He was elected for a third term based, in part, on the commitment he made when making the apology to listen more carefully to residents’ concerns about planned changes (Hutchinson, 2014; Lee, 2014). Other cities can learn from Vancouver’s experience by carefully monitoring residents’ response to change (both while planning and implementing green initiatives) and by course-correcting as needed.
SUMMARY OBSERVATIONS
The 15 targets described in Box 4-4 are measured and reported on annually. At the midpoint in the delivery of the plan, positive progress has been made in all areas, most notably the following:
- Citywide GHG emissions are down 7 percent over 2007 levels;
- Waste to landfill or incinerator is down 18 percent over 2008 levels;
- Water consumption per capita is down 16 percent over 2006 levels;
- Half of all trips in Vancouver are made by foot, bike, or transit;
- Vehicle kilometers traveled per resident is down 21 percent over 2007 levels;
- 37,000 new trees have been planted since 2010;
- Local food production, processing, and distribution capacity has increased by 36 percent since 2010;
- Zero water and air quality exceedences occurred over the past year; and
- Green jobs are up 19 percent over 2010 levels (City of Vancouver, 2015a).
Furthermore, the initiative has attracted significant international attention and accolades. The Economist Intelligence Unit placed Vancouver among the top five “greenest cities” in its Green Cities Index (The Economist,
TABLE 4-6 Example Highlighting Actions for Vancouver that Illustrate Steps in Urban Sustainability Roadmap (see Chapter 3, Figure 3-1).
| City | Vancouver | |
|---|---|---|
| Adopt Principles | P1, P2, P3, P4 | |
| Opportunities and Constraints | To make Vancouver the “greenest city in the world.” | |
| Prioritize Co-net Benefits | Prioritizes actions that can also advance the city’s Social Sustainability and Green Economy strategies. | |
| Partnerships | City staff focused on forming and strengthening partnerships with the private sector, other levels of government, the nonprofit sector, academia, and the public. An external steering committee was formed with representation across all sectors. The Sustainability Group provides strategic oversight, technical expertise, and project delivery capacity to accountable owners across the organization. | |
| Goals | 10 goal areas and 15 measurable targets. | |
| Strategies | Greenest City 2020 Action Plan, approved in 2011. Passed a motion to be a city that runs completely on renewable energy by 2050. | |
| Data Gaps | Active performance management ensures that progress toward the goals and targets is measured, tracked, and rewarded. | |
| Implementation | 125 related projects implemented by the city since 2011. Hundreds more in progress led by the city and the community. | |
| Local to Global | Mayor worked with former New York Mayor Michael Bloomberg and other municipal leaders to create the Compact of Mayors, the world’s largest coalition of city leaders addressing climate change. | |
| Public Buy-in | During 2010 and the first half of 2011, over 35,000 members of the public were engaged to develop strategies. | |
| Feedback | Active performance management ensures that progress toward the goals and targets is measured, tracked, and rewarded. | |
2011). It has also ranked Vancouver in the top three of its annual “Global Liveability Ranking” every year since 2010 (The Economist, 2015). Vancouver was named the greenest city in the world by the World Wildlife Fund in 2013 and National Champion in 2015 (World Wildlife Fund, 2015). The city was invited to join the C40, an elite international group of the most environmentally progressive cities, and to join the Carbon Neutral Cities Alliance (a cohort of 17 international cities with the most aggressive environmental goals).
Though much has been accomplished, the City of Vancouver recognizes that there is much work still to do, both to reach its 2020 goals and to be a truly sustainable city. In March 2015, the Vancouver Council upped the ante, unanimously passing a motion to be a city that runs completely on renewable energy by 2050. At the time of publication of this report, this Renewable City Strategy was under development.
PHILADELPHIA
Philadelphia is a city of U.S. firsts—the first capital, first public school, first public library, first university, first hospital, first paved turnpike, and first public parks (Richardson, 1982). Unfortunately, Philadelphia has had a series of major unwanted firsts. It is estimated to have experienced the largest population loss of any U.S. city over 1 million from 1950 to 2000 and the highest level of vacant properties of any U.S. city in 2000 (Bonham and Smith, 2008; Nasser, 2011). Philadelphia is also estimated to be the most economically segregated major city in the United States with many health and safety issues (Florida and Mellander, 2015). Many of the sustainability
trends in Philadelphia, however, are headed in the right direction and the city appears to be in the midst of an emerging recovery.
BACKGROUND
Philadelphia is, in many ways, a prototype U.S. city. William Penn’s efficient and orderly grid design of Philadelphia was a departure from European cities of his time and is still easily seen in today’s Philadelphia and many other U.S. cities (Figure 4-7). In 1700, Philadelphia and New Orleans were the two key, urban commercial centers in the American colonies. Philadelphia’s commercial dominance would later be overshadowed by Baltimore and New York as a result of several factors, including its more restricted waterways and greater distances to Atlantic shipping routes. Lesser waterways and commercial competition with these other cities would prompt Philadelphia to build the first paved turnpike in America, west to the fertile farmlands of Central Pennsylvania (Richardson, 1982).
Philadelphia had the near-unique advantage over all other early U.S. seaport cities, except Baltimore, of being on a fall line and thus able to use its internal streams as a natural source of water energy. This propelled the city into the industrial revolution as a key innovator and center of technology. The nation’s leading expert on hydraulic engineering in the early 1800s was a Philadelphian who created a new water distribution system that included iron pipes and fire hydrants. This system was subsequently emulated by dozens of other U.S. and European cities.
Despite these auspicious accomplishments, the latter half of the 20th century was a difficult time for Philadelphia, which began to experience other, decidedly unwanted firsts. Driven by suburbanization, crime, and education
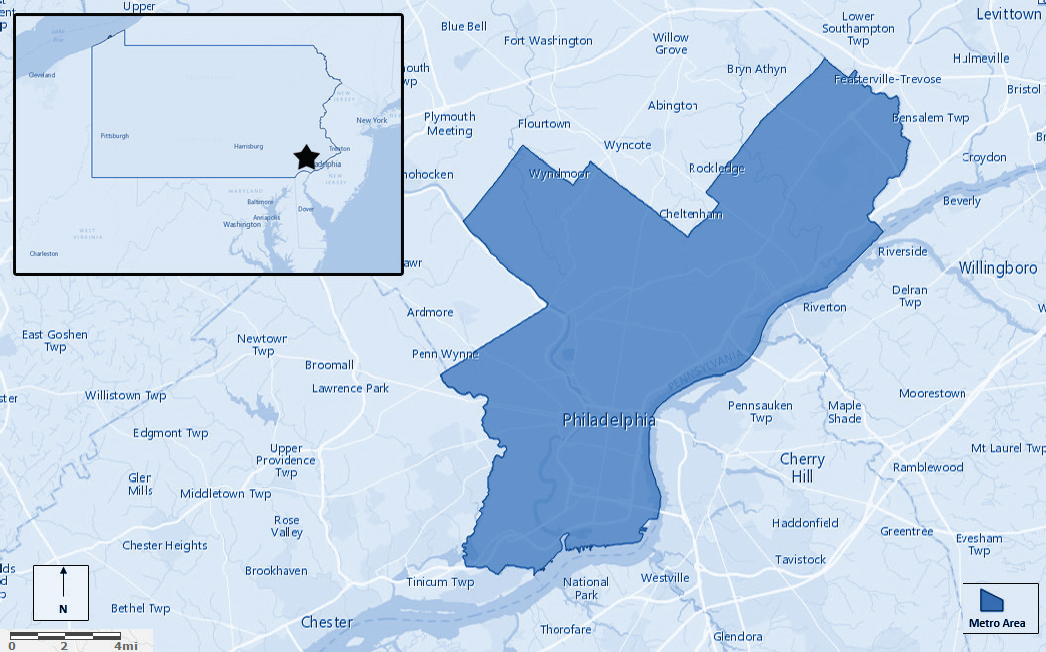
system challenges, Philadelphia saw its population drop from over 2 million in 1950 to a little over 1.5 million in 2000, a loss of some 550,000 people. This 50-year, −26.8 percent loss of Philadelphia’s urban population from 1950 to 2000 was the largest of any major U.S. city over 1 million people (Detroit’s population fell to under 1 million) and in stark contrast to the +60 percent growth rate that the city experienced from 1900 to 1950. By 2000, Philadelphia had the highest level of vacant properties of any major U.S. city (Bonham and Smith, 2008). Although these were national trends, Philadelphia’s story was more pronounced than other cities. Philadelphia’s subsequent sustainability challenges—air quality, energy inefficiency, social inequity, poor health, and sluggish economy—are in many ways tied to this population loss and the accompanying disinvestment in its urban structures on a citywide scale (see Table 4-7).
The past decade has nonetheless been a time of urban revitalization and growth for Philadelphia. Fourteen of the 15 largest U.S. cities in 2000 lost population or slowed in growth by 2010. Philadelphia, on the other hand, was the only city in this list of 15 that did not, reversing over a half century of population loss (Nasser, 2011). Today, Philadelphia is a city of almost 70 unique and diverse neighborhoods and the fourth most walkable city in the nation (Panaritis, 2015; University of Pennsylvania, 2015). In a remarkable turnaround, the Center City District of Philadelphia has become the second-most densely populated downtown area in the United States, after Midtown Manhattan (Center City Philadelphia, 2015; Nasser, 2011).
Philadelphia City and Philadelphia County are coterminous and encompass 135 square miles of land bordered by the Delaware River to the east and bisected by the Schuylkill River in the west (Figure 4-7). Much of today’s Philadelphia is commercial or industrial, a large and growing portion is residential, and some 16 square miles are parkland, including 63 neighborhood and regional parks.
TABLE 4-7 Key Characteristics for Philadelphia
| Indicator | Philadelphia | United States |
|---|---|---|
| ENV Average Annual Precipitation (inches/year) | 41.5 | 40.8 |
| ENV Existing Tree Canopy (% of land cover) | 20% | 25% |
| ENV Roadway Fatalities (per 100 million annual vehicle miles traveled) | 1.2 | 1.1 |
| ENV Particulate Matter 2.5 (ppm) | 11.6 | 10.2 |
| ENV Residential Carbon Footprint (metric tons of CO2 per capita from residential energy consumption) | 1.8 | 3.4 |
| ECON Financial Health | A+ | AA+ |
| ECON Average Residential Electricity Rate (cents/kWh) | 12.9 | 11.9 |
| SOCIAL Black or African American | 44.1% | 13.2% |
| SOCIAL Hispanic or Latino | 13.6% | 17.4% |
| SOCIAL Asian | 7.2% | 5.4% |
| SOCIAL Home Ownership (2009-2013) | 53.3% | 64.9% |
| SOCIAL High School Graduate (25 or older, 2009-2013) | 81% | 86% |
| SOCIAL Below Poverty Level | 26.5% | 15.4% |
| SOCIAL Violent Crimes (per 100,000 people) | 1,190 | 191 |
NOTE: ENV, ECON, and SOCIAL refer to the three dimensions of sustainability: environmental, economic, and social, respectively. SOURCE: Appendix B.
MAJOR SUSTAINABILITY EFFORTS
In 2008, a new mayoral administration set five basic goals to make Philadelphia a “place of choice” for people to live and stay, and one of the safest cities in the United States, with improved education and health for its residents. Most noteworthy, the new mayor’s goals also prominently included making Philadelphia “the greenest and most sustainable city in America” (Philadelphia Managing Director’s Office, 2015). What followed was a highly ambitious citywide sustainability plan in five parts: environment, energy, equity, economy, and engagement. Five goals and 15 measurable targets were intended to be met by sometime in 2015 (NRC, 2013). By extension, numerous private local entities, perhaps because they were proximal or connected to city government in some way, also launched their own, related sustainability activities. In 2014, two-thirds of Philadelphia voters cast ballots to make the Mayor’s Office of Sustainability a permanent part of city government. Since its inception, the Mayor’s Office of Sustainability has always played the role of convener for city agencies, private institutions, and advocates (Office of the Mayor, 2015).17
Climate and Environment
For the foreseeable future, the Philadelphia Mayor’s Office of Sustainability will primarily focus on the impact of climate change on energy, water, and agricultural, nonrenewable, and ecosystem services. The office is currently producing the city’s first-ever climate adaptation report, which will focus on what efforts local government can undertake (or is already undertaking) to ensure that the city will continue to provide services and maintain assets as the climate changes. An example of this work in action is a set of experiments that the Philadelphia Department of Parks and Recreation is running in the Haddington Woods neighborhood of the city to understand forest restoration practices appropriate for the weather Philadelphia is expected to experience in the 21st century. Last year the Office of Sustainability published Useful Climate Science for Philadelphia, a document that provides local projections for the city as the climate changes (Office of the Mayor, 2015). As part of the process of compiling this report, climate scientists from around the region were convened to review early drafts for accuracy and to identify next steps for research. Philadelphia is also closely exploring further roles city government can play in reducing citywide GHG emissions, whether through improved energy efficiency or transition to clean energy sources.18
The 2015 Philadelphia sustainability plan has had other innovative activities in terms of the environment. Although it is unclear if this was directly due to its sustainability plan, the city has improved its air quality in moving toward the attainment of federal standards with a 70 percent reduction in unhealthy air quality index days (from 20 such days in 2008 to 6 such days in 2014). It has also exceeded its initial target by diverting 73 percent of its solid waste from landfills, and residential recycling rates have more tripled in the past 7 years with the advent of single-stream recycling. However, even though the city set a target 20 percent reduction in GHG emissions, it only managed to achieve a 1 percent citywide reduction from 1990 to 2012 (Office of the Mayor, 2015).
The Philadelphia Water Department has become a nationally recognized innovator in stormwater management (NRC, 2013). In 2007, the EPA signed a statement of intent supporting and encouraging the municipal use of Green Stormwater Infrastructure (GSI) to meet federal regulatory standards under the Clean Water Act. Based on this, Philadelphia began to plan for and implement GSI citywide. This GSI approach allowed stormwater to percolate through the soil wherever possible in the city, using installations of infrastructure such as basins, street bumpouts, tree trenches, pervious pavements, wetlands, planters, green roofs, swales, and rain gardens. The co-benefits of these GSI installations were numerous. Over the past 5 years, almost 600 acres of land have been greened to manage stormwater and meet federal standards, and over 120,000 new trees have been planted citywide. These newly greened spaces and tree canopy have provided park and recreation co-benefits, shade, and heat reduction and have been shown to even reduce certain crimes (Kondo et al., 2015; Office of the Mayor, 2015) (see Figure 4-8). EPA is also actively exploring tradeoffs among social, environmental, and economic objectives. In 2014, the agency provided about $5 million in grants to five universities to support research to examine the financial and social costs and benefits associated with green infrastructure as a stormwater and wet weather pollution management
___________________
17 Freeh, R. 2015. Personal communication. Mayor’s Office of Sustainability, City of Philadelphia. August 3.
18 Freeh, R. 2015. Personal communication. Mayor’s Office of Sustainability, City of Philadelphia. August 3.
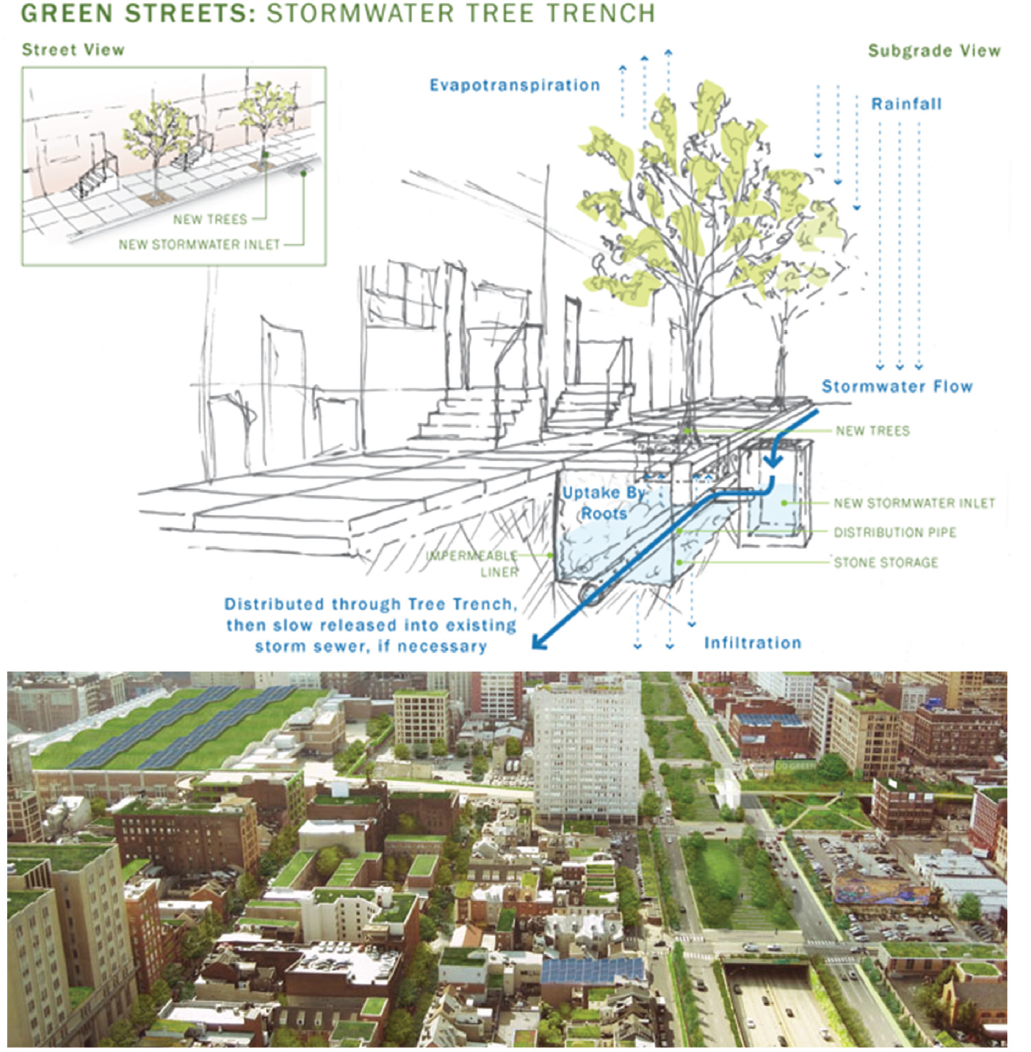
tool, including an adaptive management process to evaluate tradeoffs among different benefits (EPA, 2014b). This suggests that understanding how to manage tradeoffs in specific situations requires research.
Philadelphia has also undertaken numerous innovative initiatives for the reuse of abandoned land, which was held by both the city’s municipal government itself and private owners. By 2010, a public-private partnership between the Philadelphia Office of Housing and Community Development and the Pennsylvania Horticultural
Society had successfully acquired and greened some 5,000 vacant lots representing over 200 acres of land in Philadelphia. This greening itself was a simple, inexpensive, and highly reproducible process that has promoted sustainability, maintenance, and positive community uses for years to come on the greened lots. An evaluation of this vacant lot greening program showed that residents welcomed the program in their neighborhoods (which were often the city’s poorest and most challenged) and that health and safety problems such as stress, sedentary behavior, and gun violence were significantly reduced after the lots were greened (Branas et al., 2011; Garvin et al., 2012; South et al., 2015). These simple vacant lot greenings also had a positive effect on retail sales, as they provided visible proof of clean and safe environments that shoppers need in order to want to go to and mingle in commercial corridors (Econsult Corporation, 2009). The Mayor’s Office of Sustainability also staffs the Food Policy Advisory Council, which brings together restaurant owners, farmers, local food advocates, and residents to work together to improve the local production and accessibility of healthful and sustainably grown food (Office of the Mayor, 2015) (see Figure 4-8).19
Energy and Housing
There are some ways that Philadelphia epitomizes urban sustainability just by way the city is laid out. Similar to the fact that its existing transit network and street grid lend themselves to forms of transportation other than personalized cars, so, too, do Philadelphia rowhouses trump detached homes from an energy sustainability standpoint. To further supplement this innate advantage in the area of energy, Philadelphia has retrofitted over 16,000 homes with insulation, air sealing, and cool roofs. The city has also purchased and generated 15 percent of the electricity it uses from alternative energy sources, including national wind renewable energy credits, a new biogas co-generation plant, and roof photovoltaic panels. These activities may be what has led an independent evaluation to conclude that, from 2001 to 2010, Philadelphia had the most improved building carbon footprint of the 100 largest cities in the United States (see Figure 4-9).
The Consortium for Building Energy Innovation at the Philadelphia Navy Yard is a U.S. Department of Energy entity, administered in partnership with Pennsylvania State University, that has produced a plethora of research highlighting technologies and best practices that can lead to substantial building energy savings in Philadelphia and other cities. These have included more efficient controls for heating, ventilation, and air conditioning systems; Internet-connected accessible thermostats and software; various building contractor regulatory strategies; and strategic energy retrofits. Despite these successes, however, citywide building energy consumption increased by 19 percent from 2006 to 2014 in Philadelphia, well outside of the reduction targets set by the city (Office of the Mayor, 2015).
Philadelphia has also pursued a number of standout and innovative housing policies over the past decade. Decades of growing housing abandonment and blight have taken their toll—Philadelphians cite these decaying urban structures, which they are forced to see each day on their way to work and school, as among the most detrimental factors to their health, safety, and quality of life (Garvin et al., 2012; South et al., 2015). One innovative Philadelphia program in response to this is the 2011 Doors and Windows ordinance that required property owners of abandoned buildings to remove plywood and other nonfunctional coverings, clean their façades, and install working doors and windows in all structural openings or face significant fines. Within a year of such repairs, the area around the remediated buildings saw as much as a 39 percent drop in crime, including serious crimes such as gun violence and assaults (Kondo et al., 2015). But despite the success of abandoned building development, residents are also wary of overdevelopment and gentrification. They remain concerned that wealthier newcomers to the city, while necessary for its revitalization, may ultimately erode working- and lower-middle-class residents’ economic abilities to remain in neighborhoods where they have lived for generations. In response, one innovative Philadelphia ordinance passed in 2013 has seen some success in this regard by limiting property tax increases for longtime residents. The ultimate intent of this ordinance is preventing unwanted displacement of residents, although its effects have yet to be fully evaluated (Williams, 2014).
___________________
19 Freeh, R. 2015. Personal communication. Mayor’s Office of Sustainability, City of Philadelphia. August 3.
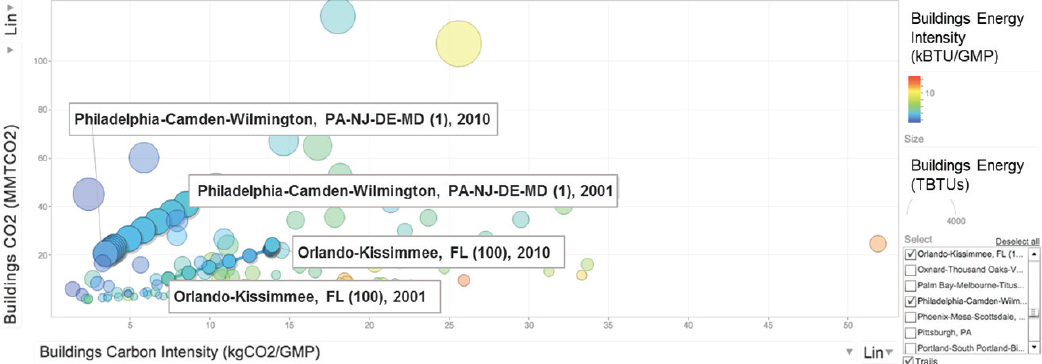
Economy, Health, and Safety
The economic assets that perhaps have had the biggest impact on sustainability in the Philadelphia region are its universities, colleges, and medical centers.20 The city is home to over 450,000 college students (only New York City and Chicago have more) (Florida, 2012). Philadelphia’s University City District was founded in 1997 via a partnership between anchor educational and medical institutions, such as those at the University of Pennsylvania and Drexel University. University City District has subsequently created a world-class, vibrant urban living experience through major investments in public space development, public maintenance, and public safety by connecting entrepreneurs and residents to economic opportunity and to numerous destination events (University City District Press, 2014). Of the 27 regional real estate submarkets in the Philadelphia area, the University City District has the highest office occupancy rate, a total of 96 percent. In 2014, 82 percent of all office construction in the entire Philadelphia region was happening within the University City District, on just 0.02 percent of the region’s office market land mass. Over a 5-year period, 10 million square feet of real estate projects have been developed in Philadelphia’s University City District—a $4.5 billion total investment supporting 73,000 jobs and $1 billion of research and development. The intensity and speed of economic activity created by Philadelphia’s “eds and meds” is among the very highest in the nation (Bergheiser, 2014).
Historically, Philadelphia’s academic institutions have not always acted as champions of their surrounding neighborhoods or their city (Puckett and Lloyd, 2015; Saffron, 2015). More recently though, the research and capacity building that Philadelphia’s universities, colleges, and medical centers have provided to its residents, and the business ventures and spinoffs that are emerging from these anchor institutions, are making Philadelphia a center for sustainable innovations and industries (Office of the Mayor, 2014). Perhaps the biggest contribution of Philadelphia’s medical centers to local health and sustainability is not their provision of medical care (which can be immensely inefficient with a minimal return on investment), but the jobs and urban revitalization they provide (Emanuel and Pearson, 2012; Schroeder, 2007). Moreover, clean, safe, and sustainable environments matter for shoppers, and not coincidentally, University City District’s work on and patrol of commercial corridors have contributed to a boom in new stores and shopping activity (Econsult Corporation, 2009).
It is no surprise that the Philadelphia Mayor’s Office of Sustainability sees scientists and its local university partners as an essential part of ensuring that the city better understands the impact of its sustainability policies, as
___________________
20 Freeh, R. 2015. Personal communication. Mayor’s Office of Sustainability, City of Philadelphia. August 3.
well as the efforts that are needed to appropriately expand these policies or, alternatively, retool or abandon policies that are not shown to have positive, sustainable impacts. The city has directly connected to scientists via local institutions such as the University of Pennsylvania Institute for Urban Research, from which multiple university faculty have been directly involved in or led activities in several of the city’s sustainability efforts, and Drexel University, whose faculty have led the creation of a framework to understand how Philadelphia could reduce its citywide GHG emissions 80 percent by 2050, an emerging best practice target for cities around the world.
In terms of health and sustainability, Philadelphia has had many successes. Based on the U.S. Centers for Disease Control and Prevention’s health impact pyramid and “making the healthy choice the easy choice” concepts, Philadelphia’s Get Healthy Philly campaign was launched in 2010 and has evolved into an innovative and successful exemplar for other U.S. cities (Frieden, 2010). This campaign has brought together public health and city planning sectors, synergistically focusing them on environmental initiatives to change contextual circumstances and situations that have traditionally fostered poor health for many Philadelphians. These initiatives have included changing the policy environment by increasing local tobacco taxes, expanding smoke-free places, focusing on unhealthy tobacco advertising (Philadelphia has far outpaced other cities in tobacco ads in public spaces), and improving walkability and bikeability through infrastructure improvements (Hillier et al., 2009). Since 2007, key health improvements have included an 18 percent reduction in smoking among adults and a 30 percent reduction in smoking among youth, translating into over 60,000 fewer smokers in the city. In addition, a 6.3 percent reduction in childhood obesity and improvements in childhood asthma hospitalization rates were also recorded. However, it is unclear if the Get Healthy Philly campaign and its accompanying policies have directly led to these changes (Buehler, 2014; Philadelphia Department of Public Health, 2015a; Robbins et al., 2015).
Unfortunately, the benefits of rapid prosperity in many parts of Philadelphia have not been uniformly experienced by all its residents. In 2015, Philadelphia was the most economically segregated major city in the United States (Florida and Mellander, 2015). The Philadelphia School District spent less per pupil in 2015 than almost any other major U.S. city (Graham, 2015). Moreover, despite modest reductions in some metrics over the past 5 years, Philadelphia continues to have the highest rates and prevalence estimates of any major U.S. city in terms of a host of health problems—premature death, child mortality, smoking, obesity, hypertension, diabetes, infant mortality, and low birth weight (Philadelphia Department of Public Health, 2015b). Nearly 30 percent of adults were obese in 2015, an increase from 21 percent in 2000 (Public Health Management Corporation, 2015). And although crime in Philadelphia fell by over 23 percent in the prior decade (over 2 percent per year on average), in 2013, Philadelphia was found to be the least safe major city in the country, a statistic driven to some extent by violent crime but also by traffic crash deaths (City-Data.com, 2015; Florida and Mellander, 2015; Philadelphia Department of Public Health, 2015b).
Although the City of Philadelphia is thoroughly capitalizing on its economic assets, numerous barriers continue to hinder sustainable growth for the city and the Philadelphia region. These barriers include educational and environmental policy shortfalls at higher levels of government (Thompson, 2016), and the layering on of additional burdens, over and above state and federal requirements, that create additional, home-grown barriers to development and growth.
OTHER SIGNIFICANT ACTIVITIES
Transportation
Part of the reason cities are attractive for millennials, one of the fastest-growing populations in Philadelphia, is that locations that do not require cars speak to a sustainability ethos that young people want to live (Blumenberg et al., 2012; Delbosc and Currie, 2012; Myers et al., 2013; U.S. PIRG Education Fund & Frontier Group, 2012). Conversely, for generations past, the iconic ethos had to do with cars, whether getting one’s first car or going for a drive on the open road. Philadelphia, with its multimodal transportation system and tight street grid, has particularly benefited from this shift in preference. The city has a large and varied public transportation network, the Southeastern Pennsylvania Transportation Authority (SEPTA), with buses, trains, rapid transit, trolleys, and trackless trolleys throughout the city as well as surrounding Pennsylvania counties. Further connections with southern
New Jersey exist via trains, buses, and ferries operated by private firms and the Delaware River Port Authority Transit Corporation. Despite rapid growth and reurbanization in Philadelphia’s city center, the city remains well connected to its outlying neighborhoods and suburbs via public transportation, extensive roadways, and political alliances. Philadelphia is also a corporate home to Amtrak, the nation’s passenger train system, and sees over 4 million passengers coming through its main station each year (Center City Philadelphia, 2015).
The city has been a lead adopter of select, innovative transportation initiatives such as promotion of “complete streets” programs, increased availability of walking and bicycling paths throughout the city, and better management of public transit programs and highways (NRC, 2013). The complete streets initiative has prompted local transportation entities in Philadelphia (Streets Department, SEPTA, Bicycle Coalition) to change their thinking and policies on community roads with a clear focus on safe access for all users—pedestrians, bicyclists, motorists, and public transit riders of all ages and abilities (Smart Growth America, 2015). A series of new bicycle lanes and walking corridors subsequently emerged. From 2005 to 2013, Philadelphia exceeded its target by reducing vehicle miles traveled by 12 percent and steadily growing the percentage of its residents that commuted by bike, foot, or transit. Moreover, the city is considering adoption of a Vision Zero approach to road safety and committing to the elimination of road deaths within the coming decades (Office of the Mayor, 2015).
SUMMARY OBSERVATIONS
In 2015, the Mayor’s Office of Sustainability reported that “long-term sustainability work had just begun and that looking forward, the city will have to go well beyond low-hanging fruit and increasingly take actions that drive large-scale impacts” (Office of the Mayor, 2015). Perhaps this realistic, yet undeterred sense of optimism and desire for action are Philadelphia’s greatest asset as it moves toward a more sustainable future. With that in mind, multiple ongoing major sustainability exemplars and challenges are evident.
Philadelphia is a prime example of a city that has overtly pursued and scientifically documented sustainability co-benefits and the triple-bottom line. Municipal leaders and nonprofit agencies have maximized their use of and connection to local scientific and university resources in testing whether they have actually achieved triple-bottom-line outcomes in select sustainability programs while considering tradeoffs among social, environmental, and economic objectives. Many of the city’s greening initiatives (Table 4-8) have been scientifically evaluated and shown to be co-benefits affecting the city’s triple-bottom-line sustainability goals. These initiatives have been shown to improve the city’s environment in terms of stormwater recapture, its economy in terms of improved housing values, its social structures in terms of lower crimes, and its health outcomes in terms of reduced residential stress and sedentary behavior (Branas et al., 2011; Heckert and Mennis, 2012; Kondo et al., 2015; South et al., 2015).
Despite some very noteworthy progress, Philadelphia remains the most economically segregated major city in the United States and continues to have some of the lowest health and safety indicators of any major U.S. city, as measured by multiple citywide metrics and cross-city comparisons. Disparities in socioeconomic status, education, health, and safety are major challenges to the city’s sustainability and directly undermine the overarching goal of making Philadelphia a “place of choice” for people to live and stay. These have been enormous, decades-long challenges, although the city is now poised to tackle them in various ways in achieving its overall sustainability goals. Philadelphia should take pride in the programs it has pioneered in this regard—especially its programs to reduce blight via vacant lot greening and abandoned housing remediation—and actively seek to export these to other cities as models of action toward making a city a place of choice for people to live and stay (Philadelphia Inquirer, 2013).
Philadelphia has had a few sustainability successes in the areas of energy and environment. However, the latest numbers show that citywide building energy consumption has significantly increased in stark contrast to reduction targets set by the city. In addition, Philadelphia remains far below its own GHG emission target, and it is scarcely on a path to reduce its citywide GHG emissions 80 percent by 2050, the suggested target for cities globally. The City of Philadelphia’s consumption of energy may be tempered by the fact that the larger Philadelphia metro area may consume less over time as the overall region becomes more centralized in a more efficient city nucleus. Future energy targets could be reworked to focus as much on the Philadelphia metropolitan region itself
TABLE 4-8 Example Highlighting Actions for Philadelphia that Illustrate Steps in Urban Sustainability Roadmap (see Chapter 3, Figure 3-1).
| City | Philadelphia |
|---|---|
| Adopt Principles | P1, P2, P3, P4 |
| Opportunities and Constraints | Opportunities: An inherently compact street grid has contributed greatly to the city’s walkability and renaissance, with a large reduction in unhealthy air days as well as tens of thousands fewer smokers and obese children. Energy inefficiency, economic segregation, and a severely underresourced school district continue to pose challenges. Constraints: There are many areas in which the city would like to have larger impact but is hindered by state and national policies. |
| Prioritize Co-net Benefits | Philadelphia has overtly pursued and scientifically documented sustainability co-benefits and the triple-bottom line. Municipal leaders and nonprofit agencies have maximized their use of and connection to local scientific and university resources in testing whether they have actually achieved triple-bottom-line outcomes in select sustainability programs. Many of the city’s greening initiatives have been scientifically evaluated and shown to be co-benefits affecting the city’s triple-bottom-line sustainability goals. |
| Partnerships | Philadelphia’s Center City District has spurred a population influx reportedly making it the second-most densely populated U.S. downtown. The University City District, and maximal leveraging of local “eds and meds” institutional partnerships, has connected entrepreneurs and residents to economic opportunity. Multimodal and metropolitan management via SEPTA regional transit authority. |
| Goals | A realistic, yet undeterred sense of optimism and a desire for action are Philadelphia’s greatest asset as it moves toward a more sustainable future. Although the Mayor’s Office of Sustainability has been voted into perpetuity, it will be important for the next mayor to pick up the baton in terms of further casting the overall vision of sustainability for the city and providing leadership to ensure that the targets and the “how” of meeting these targets are realized. |
| Strategies | The Philadelphia Mayor’s Office of Sustainability Greenworks Plans lays out important targets and over 100 separate initiatives in meeting these targets. However, the initiatives themselves may benefit from more explicit, quantitative goal setting if they are to fully contribute to meeting the broader set of 15 targets. Important, complementary plans, such as Green2015 (by PennPraxis and the Philadelphia Parks Department), have also been launched and outline specific goals as to how certain targets can be met “on the ground” through planning, implementation, and collaborative efforts. Other important strategies include a new biogas co-generation plant, newly insulated homes, and a pioneering abandoned housing remediation program. |
| Data Gaps | The city has made impressive strides in terms of large, distributed data systems that include some of the nation’s first municipal GIS products both for use by city employees and publicly available. However, gaps in connecting a large variety of databases still exist, especially databases that contain traditionally disconnected information; e.g., housing and land use data are not centrally connected with public safety and public health data. |
| Implementation | Philadelphia has retrofitted over 16,000 homes with insulation, air sealing, and cool roofs. The city has also purchased and generated 15% of the electricity it uses from alternative energy sources. |
| Local to Global | Via university-government partnerships (both city government and federal agencies like the local U.S. Forest Service), Philadelphia has produced some of the nation’s first clear evidence of triple-bottom-line successes. These sorts of studies have served as models for other cities, both in the United States and around the world, essentially positioning Philadelphia as an exporter of generalizable scientific methods and knowledge related to urban sustainability. |
| Public Buy-in | Numerous public forums are held on urban sustainability and the city’s investment in this is a mayoral priority. This is expected to continue as the new mayor takes office in 2016. |
| Feedback | — |
as they do on the City of Philadelphia alone, perhaps more consistently including per capita measures to better capture relative efficiencies.
The Philadelphia Mayor’s Office of Sustainability Greenworks Plans lays out important targets and over 100 separate initiatives in meeting these targets. However, the initiatives themselves may benefit from more explicit, quantitative goal setting if they are to fully contribute to meeting the broader set of 15 targets. Important, complementary plans, such as Green2015 (by PennPraxis at the University of Pennsylvania and the Philadelphia Parks Department), have also been launched and outline specific goals as to how certain targets, such as adding 500 acres of new publicly accessible green space to the city by 2015, can be met “on the ground” through planning, implementation, and collaborative efforts among myriad partners, including neighbors, businesses, nonprofits, developers, and the city (PennPraxis, 2015). Although the Mayor’s Office of Sustainability has been voted into perpetuity, it will be important for the next mayor to pick up the baton in terms of further casting the overall vision of sustainability for the city and providing the leadership to make sure that the targets and the “how” of meeting these targets happen in city government.
PITTSBURGH
Pittsburgh’s success as an industrial center in the 19th century has created a legacy of sustainability issues to be addressed in the 21st century. Diversification of its economy, a shift to cleaner energy sources, and successful public-private partnerships have helped Pittsburgh improve the metrics of several sustainability indicators like air pollution and water quality, but the city needs to continue its efforts to reach its sustainability goals.
BACKGROUND
The Pittsburgh region has a remarkable history of industrial and socioeconomic change over time. Pittsburgh is located in western Pennsylvania at the confluence of the Allegheny and Monongahela Rivers that combine to form the Ohio River. The metropolitan area around Pittsburgh comprises six counties in Pennsylvania, while the broader region (the “Tri-state Region”) includes counties in Ohio and West Virginia. Allegheny County is the central county and includes the city of Pittsburgh (Figure 4-10). Allegheny County’s population peaked in the 1970s at 1.6 million and was 1.2 million in 2010 (Hoesly et al., 2012). The city of Pittsburgh in 2010 had 20 percent of the population of Allegheny County and 13 percent of the land area. Pittsburgh does not have the authority to unilaterally expand its boundaries; surrounding the city is a series of independent municipalities that resist incorporation into the central city.
Pittsburgh is in the humid continental climate zone with four distinct seasons. Average annual precipitation is 38 inches. The precipitation and rivers provide ample water resources for the region. From the middle of the 19th century to the middle of the 20th century, Pittsburgh was known as the Steel City, serving as the headquarters of the Carnegie Steel Company and, subsequently, the U.S. Steel Corporation (Tugwell et al., 1999). The steel industry took advantage of local coal and iron ore shipped in through the Great Lakes and railway connections. Immigration from Ireland, Eastern Europe, and the South occurred throughout this period with employment opportunities in the steel and service industries. During the 1970s, the regional steel industry went into a severe decline, with considerable steel production relocating overseas. More than 125,000 manufacturing jobs were lost in the Pittsburgh region in the 1970s (Tugwell et al., 1999).
In the early 20th century, Pittsburgh experienced severe environmental and health problems. In 1907, 622 people died of typhoid fever due to contaminated water. The riverfront was dominated by industrial plants and freight facilities for barge and rail shipping. Sewer systems were generally unavailable. Worker living conditions were termed “deplorable” (Tugwell et al., 1999).
Figure 4-11 shows estimates of the carbon dioxide emissions and energy consumption for various economic sectors in total and per capita for Allegheny County in the 20th century. Both overall and per capita carbon dioxide emissions peaked around 1980, but energy use per capita has continued to increase from 1930 onward. The emissions of carbon dioxide from industrial sources peaked in 1950 and have declined subsequently due to changes in fuel sources and shifts in the types of regional industries. In particular, coal has been generally replaced by natural
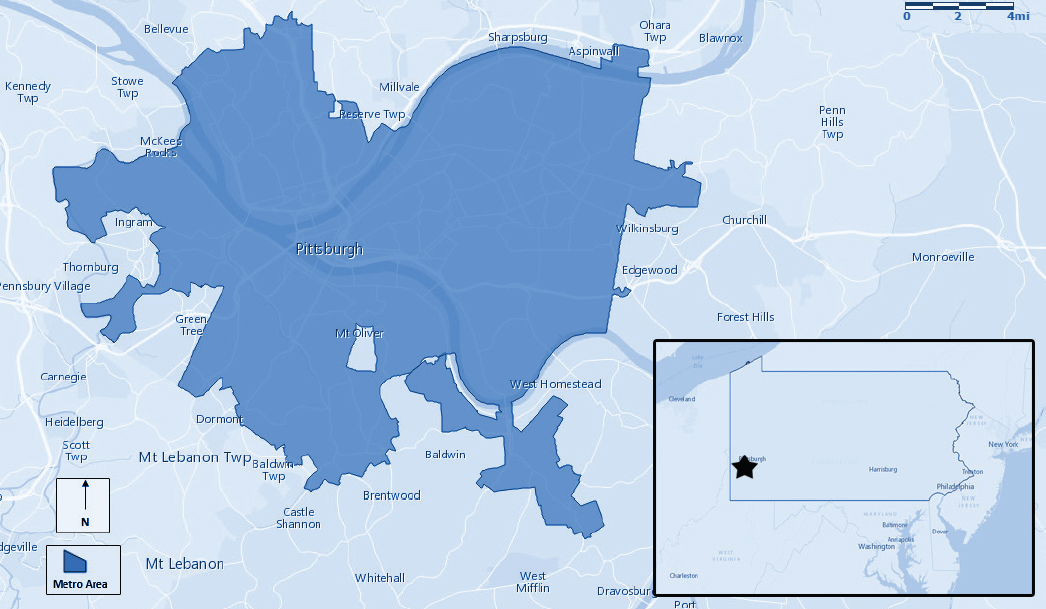
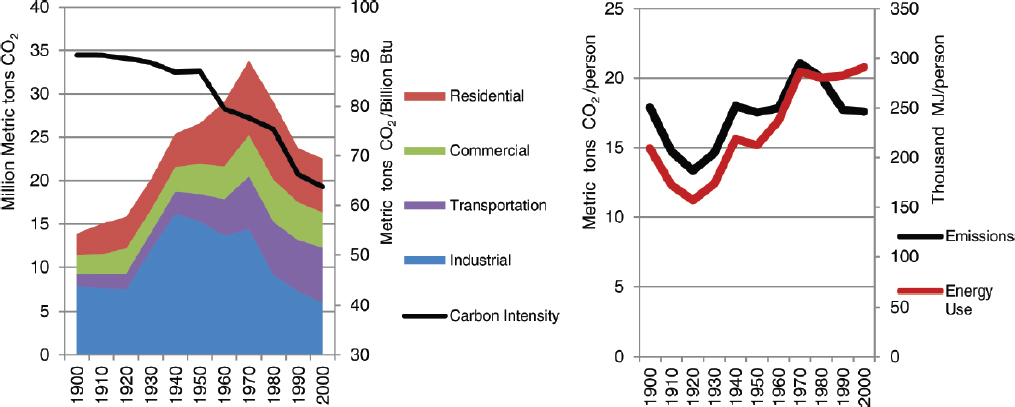
TABLE 4-9 Key Characteristics for Pittsburgh
| Indicator | Pittsburgh | United States |
|---|---|---|
| ENV Average Annual Precipitation (inches/year) | 34.8 | 40.8 |
| ENV Existing Tree Canopy (% of land cover) | 42% | 25% |
| ENV Roadway Fatalities (per hundred million annual vehicle miles traveled) | 1.2 | 1.1 |
| ENV Particulate Matter 2.5 (ppm) | 14.0 | 10.2 |
| ENV Residential Carbon Footprint (metric tons of CO2 per capita from residential energy consumption) | 2.7 | 3.4 |
| ECON Financial Health | A+ | AA+ |
| ECON Average Residential Electricity Rate (cents/kWh) | 11.4 | 11.9 |
| SOCIAL Black or African American | 13.4% | 13.2% |
| SOCIAL Hispanic or Latino | 1.9% | 17.4% |
| SOCIAL Asian | 3.4% | 5.4% |
| SOCIAL Home Ownership (2009-2013) | 65.5% | 64.9% |
| SOCIAL High School Graduate (25 or older, 2009-2013) | 93% | 86% |
| SOCIAL Below Poverty Level | 12.9% | 15.4% |
| SOCIAL Violent Crimes (per 100,000 people) | 421 | 191 |
NOTE: ENV, ECON, and SOCIAL refer to the three dimensions of sustainability: environmental, economic, and social, respectively. SOURCE: Appendix B.
gas for many heating uses. Emissions and energy use generally had similar trends during the 20th century, until emissions declined in the last two decades while energy use continued to increase. A combination of fuel changes and efficiency improvements led to this change.
MAJOR SUSTAINABILITY EFFORTS
Air Pollution
With abundant coal resources and considerable heavy industry, air and water pollution became major environmental concerns in the Pittsburgh region throughout the 20th century. Air pollution was so intense that streetlamps were turned on during the daytime, and office workers would have to change shirts midday. In 1948, roughly two dozen residents died and hundreds were hospitalized in Donora, Pennsylvania, due to pollution associated with a severe temperature inversion in the local area (Tugwell et al., 1999). Emission controls and a transition to medical and technology-based industries resulted in gradually improving air and water quality in the region during the 20th century, but Pittsburgh continues to struggle with air quality. With more stringent recent air quality standards, the region is out of attainment with federal air quality standards for 8-hour ozone and 2.5-micron particulate matter. However, the region is in attainment with federal standards for all other criteria air species. The trend is good, with exceedance of 19 days in 2012 dropping to 2 days at one site in 2014 (Allegheny County Health Department, 2014). An indoor air quality metric is being piloted in the city as part of the Pittsburgh 2030 Initiative (Green Building Alliance, 2014). In addition, the Pittsburgh Climate Action Plan Version 2.0, released in 2012, has outlined the creation of an air quality action plan for Allegheny County and the City of Pittsburgh as one of its medium-term recommendations, aiming to raise awareness of the importance of urban air quality issues (Pittsburgh Climate Initiative, 2012).
Water Quality
As with air quality, Pittsburgh also continues to have degraded water quality. A particular problem has been combined sewer overflows, in which large precipitation events overwhelm the combined wastewater sewer and treatment capacity, resulting in overflows of sewage into local rivers. In 2010, 28 percent of days during the recreation season had water quality advisories issued (Pittsburgh TODAY, 2015). A second longstanding concern is acid drainage from legacy coal mines. A long-term program of investment in wastewater infrastructure is still under development, and many miles of rivers and streams have already been reclaimed.
In terms of water consumption, a district water baseline for downtown Pittsburgh was established using historic water consumption information by the Pittsburgh 2030 District Initiative and the Pittsburgh Water and Sewer Authority. Existing building targets for water consumption are a 50 percent reduction by the year 2030, and an interim target of a 10 percent reduction by 2015. In 2014, water performance from 80 percent of downtown square footage was reported, with results indicating a 10 percent reduction from the baseline (Green Building Alliance, 2014).
Regarding the water industry more generally, southwestern Pennsylvania is uniquely positioned to be a leader in various dimensions of water infrastructure innovation. In 2011, Sustainable Pittsburgh facilitated the release of Pittsburgh’s H2Opportunity–An Assessment of Southwestern Pennsylvania’s Water Sector, the region’s first ever economic analysis of the water industry sector, which provided key recommendations on the assessment, organization, and advancement of regional opportunities related to water, the support of innovation and commercialization in water technology, and the promotion of green water management infrastructure, among others (Pittsburgh World Environment Day Partnership, 2011). In 2012, the Water Innovation Consortia Planning Committee released the Sustainable Water Innovation Initiative for Southwestern Pennsylvania, which identified eight projects relating to either energy development and water management; navigation infrastructure, monitoring, and water security; stormwater and green infrastructure; or regional watershed and drinking water interactions to leverage the development of innovative solutions in the water sector (Water Innovation Consortia Planning Committee, 2012). This example presents how various stakeholders have integrated research, science, and technology into the support of sustainability initiatives.
Climate Action Plan
As shown in Figure 4-11, GHG emissions declined in Allegheny County from 1900 to 2000, generally due to a switch of fuel sources away from coal and a reduction in heavy industry. This trend is likely to continue, largely due to requirements imposed by the federal and state governments. In particular, the Commonwealth of Pennsylvania has regulated provision of renewable energy, with a requirement for 8 percent of renewable energy by 2020 in the state (Rabe, 2006). Corporate Average Fuel Economy Standards should reduce emissions for transportation services.
Local efforts for GHG emission reductions also exist. In 2008, the city of Pittsburgh adopted its first Pittsburgh Climate Action and established a goal of reducing GHG emissions to 20 percent below 2003 levels by 2023. GHG emissions in the county are shown in Figure 4-11. Figure 4-12 shows more recent emissions amounts, as reported in the 2008 Pittsburgh Greenhouse Gas Emissions Inventory (Pittsburgh Climate Initiative, 2008). In 2012, the Pittsburgh Climate Action Plan Version 2.0 was released, which provides an update on the progress of initial recommendations, as well as outlines new measures aimed toward meeting the 2023 target. As of 2014, more than 23 of the 35 community action items have been completed or are under way.
Energy Production and Use
Pittsburgh historically has had a heavy reliance on energy from coal reserves, although natural gas and nuclear power are also major sources of energy. Figure 4-13 shows energy consumption estimates from the Energy Information Administration for the Commonwealth of Pennsylvania. Pittsburgh is generally similar in energy consumption to the entire state. Pennsylvania as a whole is a net exporter of electricity. Natural gas has become the predominant means of heating buildings, whereas coal filled this role in the early 20th century.
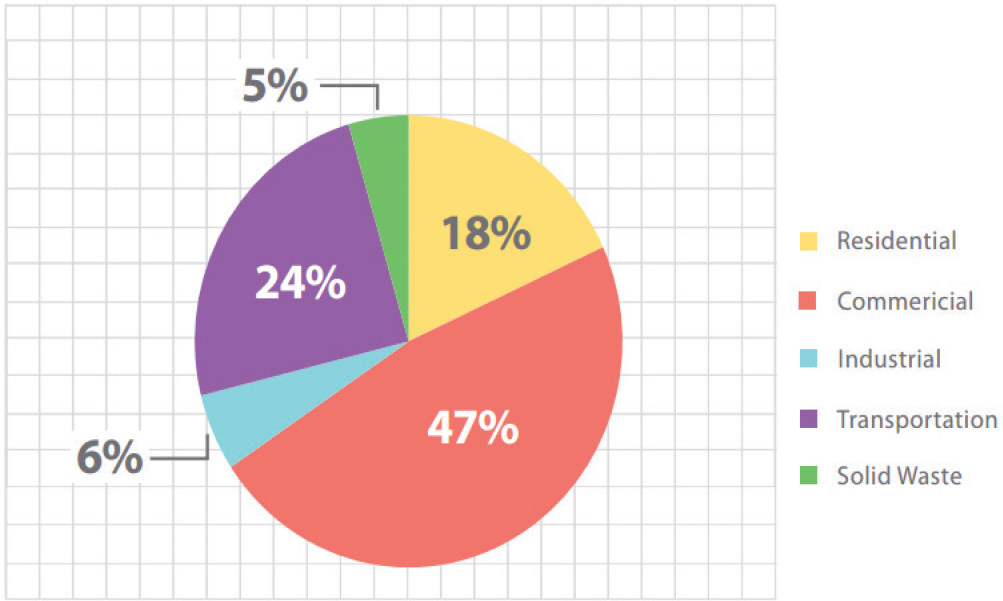
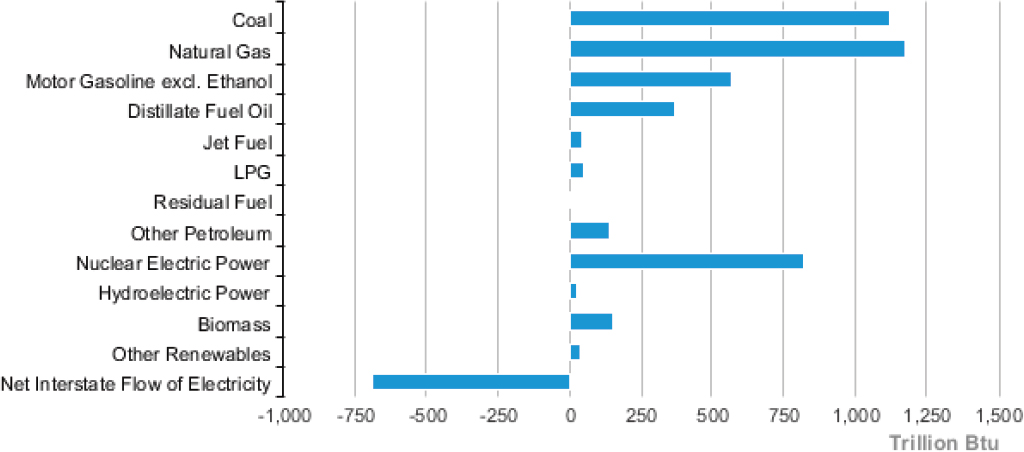
Another sustainability challenge facing the Pittsburgh region is managing the impact of the Marcellus Shale Natural Gas development. Production and proven reserves in the Marcellus Shale area of northern Pennsylvania have both increased in the past 10 years (Figure 4-14). The well development has affected local ecosystems, required water for hydraulic fracking operations, increased regional conventional and GHG emissions, and increased roadway traffic, including roadway wear and tear (EIA, 2014).
The Pittsburgh Climate Action Plan Version 1.0 provides a number of recommendations which focus on energy use and efficiency as relating to emissions. Version 2.0 of the plan provides a number of updated recommendations which primarily focus on reductions in energy demand, water demand, waste generation, transportation fuel combustion, and strategies to strengthen regional capacity (Pittsburgh Climate Initiative, 2012). Examples include
- Reducing energy use in city-owned buildings by 20 percent over 5 years, and
- Adopting a goal of 10 MW of renewable energy capacity installed in Pittsburgh by 2020 (Pittsburgh Climate Initiative, 2012).
Moreover, the Pittsburgh 2030 District initiative has reported a 6.3 percent reduction in energy use below the baseline. The initiative has established goals of a 10 percent reduction by 2015, and a 50 percent reduction by 2030 (Green Building Alliance, 2014). In addition, the city government purchases 15 percent of its electricity from renewable energy and utilizes solar energy on its facilities (Pittsburgh Climate Initiative, 2012).
Transportation
Pittsburgh has been a transportation hub throughout its history. The rivers have been major corridors for freight movement, especially with development of lock and dam systems in the region. With the development of the steel industry in Pittsburgh, railroads provided connections throughout the United States. Many of the neighborhoods of Pittsburgh developed as streetcar suburbs in the late 19th and early 20th centuries (Brunn et al., 2003).
The topography of the Pittsburgh region provides challenges for transportation investment and operations. The three major rivers and related streams require use of numerous bridges and restrict the extent of the roadway
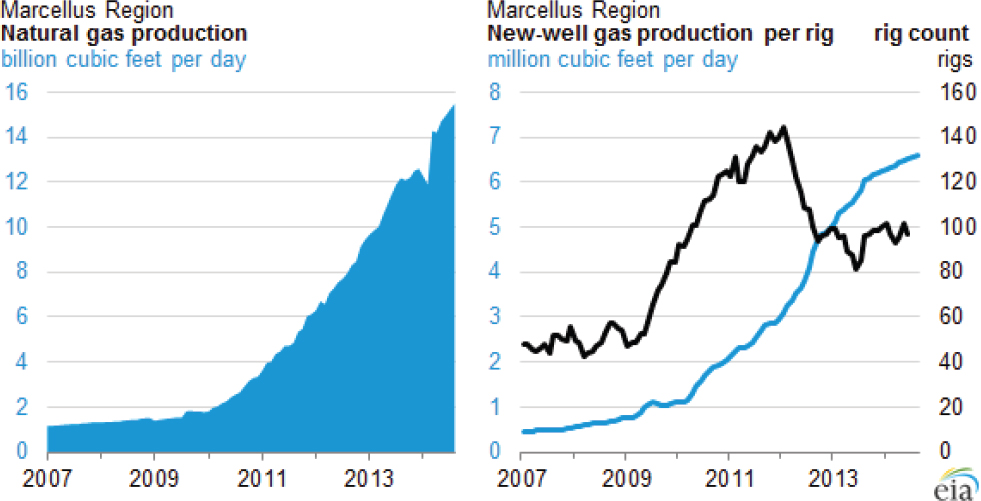
network. Recently, the City of Pittsburgh has developed a network of bicycle lanes throughout the city to encourage nonmotorized transportation (Fraser, 2014).
Transportation also features as a prominent issue area in the Pittsburgh Climate Action Plan, with recommendations focusing on reducing the number of single-occupancy vehicles commuting to Pittsburgh, encouraging public transit use and bicycle commuting, and reducing commuter and travel footprints (Pittsburgh Climate Initiative, 2012). As part of the Pittsburgh 2030 District Initiative, a 50 percent reduction in transportation emissions goal was established, as well as an emissions baseline (from mid-2015) which was established as an average of the percentage share of different transportation modes of commuters and associated air emissions from commuter transportation to and from downtown Pittsburgh (Green Building Alliance, 2014). The city is also involved in a number of other transportation initiatives, including alternative fuels and waste hauler retrofits—the city uses B20 biodiesel (20 percent biodiesel, 80 percent petroleum diesel blend) in all diesel equipment and is retrofitting its diesel waste hauling vehicles with equipment to reduce diesel particulate emissions. Diesel particulate filters have been installed on 13 waste haulers and the rest of the fleet is planned to be retrofitted from a $443,100 grant awarded by the state of Pennsylvania (City of Pittsburgh, 2016).
Poverty and Workforce Development
With the drop in steel industry employment, Pittsburgh has had problems with concentrated pockets of poverty and unemployment, particularly in the towns surrounding steel mill closures. For 2009-2013, persons below the federal poverty level were 23 percent, compared with a statewide average of 14 percent (U.S. Census Bureau, 2015b). Retraining steel workers for employment at comparable wage levels to those in the steel industry is very difficult.
In recent years, the Pittsburgh region has seen growth in software, robotics, and medical technology enterprises. These industries have attracted recent graduates (especially from the local universities) and immigrants. In June 2015, the unemployment rate in the region was 5.5 percent (Pittsburgh TODAY, 2015).
City of Pittsburgh Sustainability Planning
Since 2008, the City of Pittsburgh has had an Office of Sustainability that works in partnership with private groups (such as the Green Building Alliance and Sustainable Pittsburgh) and with other government agencies (such as Allegheny County and the Commonwealth of Pennsylvania). Objectives for the city’s sustainability program are (City of Pittsburgh, 2015a)
- Improving the internal operations of municipal government, to reduce the fiscal and environmental impact related to the local government’s services;
- Fostering innovative and collaborative solutions that overcome barriers to ecological responsible behavior;
- Ensuring that the city provides clean air, water, and livable communities for residents and businesses;
- Being a leader locally, nationally, and globally in the collective effort to reduce the impacts of climate change while growing the local economy; and
- Encouraging economic opportunities for all communities.
A wide range of activities are performed by the Office of Sustainability, generally in the following programmatic areas:
- Benchmarking and Recognition,
- Innovation and Process Improvement,
- Coordination and Facilitation,
- Funding and Resource Development,
- Sustainability and Resilience Planning, and
- Communication and Education.
Figure 4-15 shows 2014 key performance indicators for the Office of Sustainability for its city improvement activities.
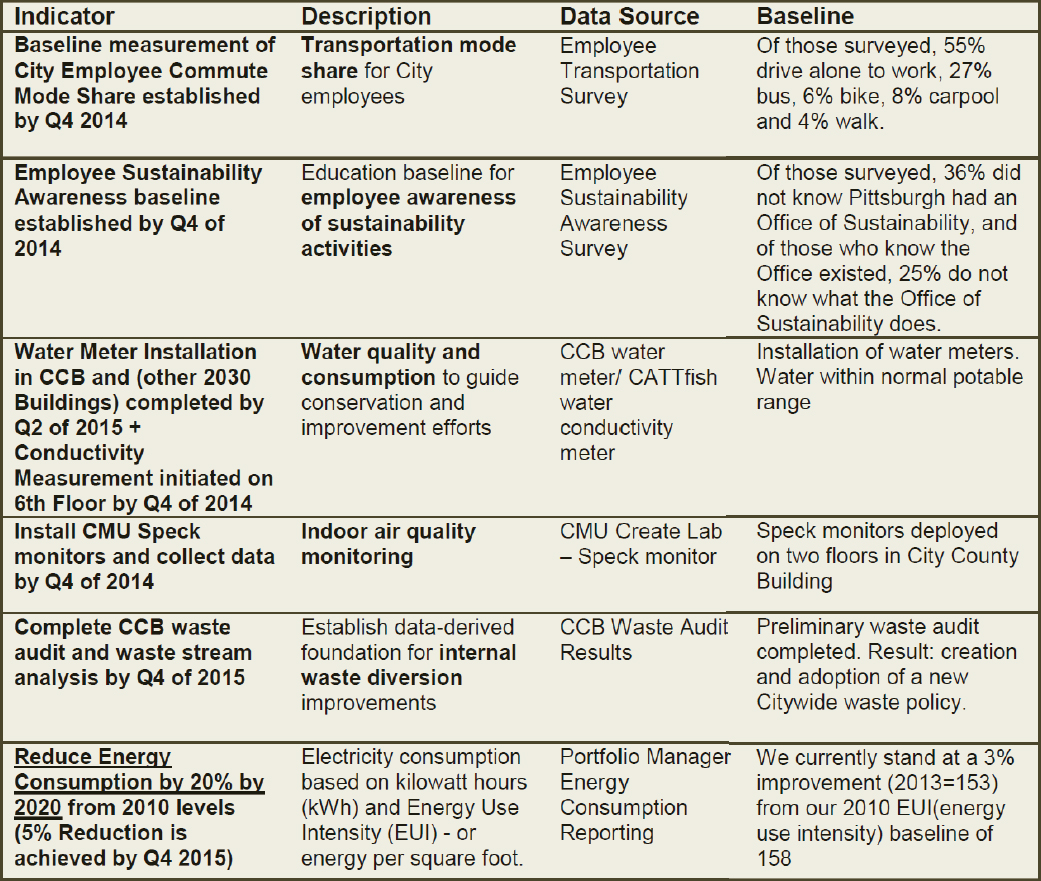
OTHER SIGNIFICANT ACTIVITIES
Public-Private Partnerships
Beginning in 1945 and extending through the 1950s, Pittsburgh experienced Renaissance I, which focused on air pollution control and redevelopment of the downtown area. Renaissance I plans were formed by a partnership between business (organized in the Allegheny Conference for Community Development) and the City of Pittsburgh under the leadership of Mayor David Lawrence. A second Renaissance began in the 1970s with a focus on cultural district expansion and renewal. Again, this activity was a result of private-public partnership, but the public agencies and private foundations tended to take on leadership roles (Tarr, 2002). During the 1990s, the region realized that economic revitalization was critical to its future sustainability. Again, a public-private partnership was formed, called the Regional Economic Revitalization Initiative. Some environment actions were
pursued within this initiative, such as redevelopment of riverfronts for parkland, but the bulk of the activity was intended to foster economic and workforce development. Finally, beginning around 2010, the local government, businesses, foundations, and university communities coalesced around an agenda to overcome continuing environmental problems and to promote sustainable development. Deployment of new technologies developed locally is a feature of this new set of partnerships.
More recently, the Pittsburgh Climate Action Plan Version 2.0 outlines a number of recommendations which focus on community and business partnerships (Pittsburgh Climate Initiative, 2012). Sustainable Pittsburgh provides an example of an organization which promotes sustainability through a focus on partnerships and collaboration, and facilitates a number of initiatives such as the Pittsburgh Green Workplace Challenge, the Sustainable Pennsylvania Community Certification, and Sustainable Pittsburgh Restaurants (Sustainable Pittsburgh, 2016).
Role of Science and Innovative Technology
From the 1800s to the early 1900s, the Pittsburgh region was notable for innovation in developing world-class steel production and manufacturing processes. Pittsburgh steel was exported for buildings and transportation facilities throughout the world. More recently, innovation has been promoted to achieve the sustainability goals outlined above. For example, in conjunction with researchers at Carnegie Mellon University, the city is investing in indoor air quality monitors and new adaptive traffic signal controllers. It has formal agreements with local universities and was a founding member of the MetroLAB city-university consortium intended to promote “smart cities” as part of the White House Smart Cities Initiative (Carnegie Mellon University, 2015). The MetroLAB Network aims to advance collaboration among university researchers and city policy makers to undertake research and development projects that improve infrastructure, public services, and environmental sustainability. Finally, the Phipps Center for Sustainable Landscapes in Pittsburgh is one of the first buildings in the world to achieve the Living Building Challenge.21
Brownfield Redevelopment
With a significant industrial history, the Pittsburgh region has over 10,000 brownfield sites that can be redeveloped, although most require some form of environmental remediation. Nevertheless, numerous successful brownfield redevelopments have been accomplished while considering developmental, ecological, and socioeconomic tradeoffs (Haller, 2005). For example, the former LTV plant of 48 acres along the Monongahela River was successfully developed for office and research space use. The site now has over 1,000 employees and returns roughly $1 million per year in property taxes (Western Pennsylvania Brownfields Center, 2015). Brownfield developments are associated with lower overall travel times for residents and industries. Moreover, they can take advantage of existing infrastructure developed for the original industrial users.
SUMMARY OBSERVATIONS
Pittsburgh has a history of unbridled industrial development in the 19th century, with recurring problems of air and water quality as well as waste disposal. It received the description “Hell with the lid off” for good reason. While Pittsburgh has retained considerable primary production, the development of the software, robotics, and medical technology enterprises has begun to change the city significantly.
Several lessons can be drawn from the evolution of Pittsburgh’s economy and activities over the past 150 years. First, public-private partnerships can be effective in implementing changes to improve the overall quality of life. Pittsburgh’s three renaissance periods all featured such partnerships, although the more recent developments included a greater presence of the private sector, nonprofit groups (particularly charitable foundations), and
___________________
21 The Living Building Challenge™ is the built environment’s most rigorous performance standard. It calls for the creation of building projects at all scales that operate as cleanly, beautifully, and efficiently as nature’s architecture. To be certified under the Challenge, projects must meet a series of ambitious performance requirements over a minimum of 12 months of continuous occupancy. See http://living-future.org/lbc.
TABLE 4-10 Example Highlighting Actions for Pittsburgh that Illustrate Steps in Urban Sustainability Roadmap (see Chapter 3, Figure 3-1)
| City | Pittsburgh |
|---|---|
| Adopt Principles | P1, P2, P3, P4 |
| Opportunities and Constraints | Opportunities: Growth of renewable energy generation and green infrastructure. Constraints: Air and water pollution and aging infrastructure. |
| Prioritize Co-net Benefits | Brownfield development, improved job access, improved street lighting and traffic management. Green infrastructure projects could simultaneously help with issues of air pollution, water pollution, GHG emissions, and urban heat islands. |
| Partnerships | Numerous partnerships with private sector, nonprofit organizations, corporations, universities, and other government agencies. Example partners: Allegheny Conference for Community Development, Green Building Alliance, Pittsburgh Higher Education Council, Pittsburgh Cultural Trust, Sustainable Pittsburgh. |
| Goals | Adopted by the Mayor and City Council and used by the city’s Office of Sustainability. GHG reduction target of 20% below 2003 levels by 2023. |
| Strategies | Street light improvements; building energy efficiency improvement; transportation mode shift; pollution reduction; green infrastructure for stormwater management. |
| Data Gaps | Indirect emissions (Tier 3 emissions) are not tracked locally. Emissions within the region but outside the city limits. |
| Implementation | City of Pittsburgh Office of Sustainability |
| Local to Global | Close cooperation between agencies at different levels. |
| Public Buy-in | Mayor roundtables. Public forums on issues such as the city’s Climate Change Adaptation Plan |
| Feedback | — |
universities. Second, reusing old industrial sites can have significant benefits for travel time and urban liveliness. Generally, the benefits outweigh the costs of environmental remediation. Brownfield redevelopment benefits include travel cost savings and employment opportunities. Finally, the Pittsburgh region was overly reliant upon a single industry for its economic driver during much of the 20th century. With the contraction of the local steel industry in the 1970s, the region has struggled to find other industries to provide growth and employment. Diversity of industrial activity is an important lesson learned. Nonetheless, Pittsburgh has made progress in environmental stewardship efforts, with a targeted focus on GHG emissions reduction and climate protection (Table 4-10).
CHATTANOOGA
Chattanooga is the fourth largest city in the state of Tennessee, located near the Tennessee-Georgia border (Figure 4-16). The mountains that surround Chattanooga and provide its scenic backdrop also trap air pollutants in the Chattanooga valley, so that in 1969, the federal government declared Chattanooga’s air the dirtiest in the nation. In the time since, substantial private and public resources have been invested in transforming the city to what is considered today as one of the most revitalized cities in the Southeast.
BACKGROUND
Chattanooga was first settled by Europeans in 1816. By the mid-1800s, Chattanooga was seen as “the gateway to the deep south,” a vital trading stop for steamboats and trains (Eichenthal and Windeknecht, 2008). The resources of Chattanooga made it a strategic city during the Civil War, with the second deadliest battle of the war occurring just miles from the city at Chickamauga (Civil War Trust, 2015). A new industrialized Chattanooga rose
out of the rubble, one that was considered the “dynamo of Dixie.” However, less than a century later, Chattanooga was hit hard by the Great Depression. Although the Tennessee Valley Authority (TVA) revolutionized the region by generating cheap hydroelectricity that attracted manufacturing and jobs, the industrialization of Chattanooga had its costs. In 1960, Chattanooga had a higher percentage of manufacturing jobs than any other city in the South, which contributed in 1969 to EPA finding that Chattanooga had the dirtiest air in the nation (Parr, 1997). As pollutants hovered over the city, Chattanoogans moved to the suburbs and the downtown district emptied out (Eichenthal and Windeknecht, 2008).
In the 1970s and 1980s, a vision of “bringing the country to the city” was introduced to Chattanooga largely by city councilman David Crockett who studied inner-city redevelopment initiatives across the United States. At the same time, civic leaders like Eleanor McCallie Cooper (Director of the Chattanooga Venture) invited the whole community to bring their ideas to the discussion about the future of Chattanooga, to ensure that decisions about the city were not made by a small elite (Lerner, 1998).
Chattanooga spans about 140 square miles of Hamilton County and is encircled by mountains and rivers. Overlooking Chattanooga, Lookout Mountain provides a picturesque view of the city and the Tennessee River (Phillips, 2013). The modified Köppen classification system defines the climate of Chattanooga as humid subtropical with an average temperature of 60.3 degrees (Chattanooga Area Chamber of Commerce, 2011; Pidwirny, 2011) and 52.4 inches of annual rainfall (Table 4-11).
In 2010, the City of Chattanooga had a population of about 170,000, and the metro area had a population of about 528,000. Based on these data, Chattanooga is the fourth largest city in Tennessee, and one of the largest 150 cities in the country. While the majority of Chattanoogans are white, the City of Chattanooga has a diverse racial composition: 19.8 percent are black or African American, 5.1 percent are Hispanic or Latino, and 2.1 percent are Asian (Table 4-11).
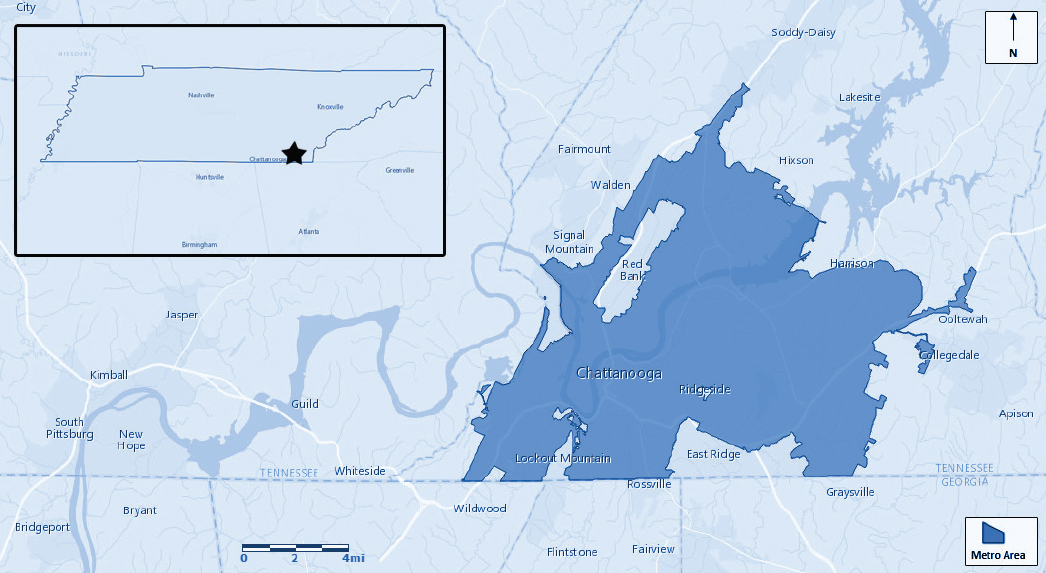
There are a number of notable statistics related to Chattanooga. Violent crimes occur at a rate that is more than three times higher than that of the United States. Although this rate is alarming, the violent crime rate has been declining, potentially as the result of an increase in the city’s police force. Examining the crime statistics of Chattanooga also interestingly reveals that close to one-half of assaults and homicides occur in a house where both the perpetrator and victim live (Brogdon, 2013).
Similarly, Chattanooga suffers from a poverty level that is above the national average. Within the city limits, the poverty levels nearly double to 30 percent. Manufacturing had once been the largest employer in Chattanooga, but job opportunities disappeared with the factories. As a result, Chattanooga’s unemployment rate is higher than the national average (7.9 versus 7.6 percent). More than 40 percent of children in Chattanooga live in poverty, and close to 70 percent of impoverished households are headed by women (Greenhouse, 2014). Chattanooga’s progression toward sustainability has been achieved despite ongoing problems of poverty and crime.
Like most southern cities, Chattanooga grappled with racial tensions in the 1950s and 1960s. However, Chattanooga was unique in hiring black police officers beginning in 1948 and busing out-of-district students into white school districts before most other southern cities (Eichenthal and Windeknecht, 2008). Despite this, a 2009 National Association for the Advancement of Colored People (NAACP) study said, “Chattanooga has a major race problem.” The study found a general perception among black residents of Hamilton County that they had limited career paths, feared retaliation for accusing authority figures of racist behavior, and were 19.5 times more likely to go to jail than white residents of Hamilton County. Unemployment is much higher among African Americans and especially black youths (NAACP, 2011).
By the end of the 1960s, nearly one-third of Chattanooga jobs were in manufacturing, and the effects of manufacturing had perverse impacts on the city’s air quality. By merely walking outside, Chattanoogans risked covering their clothing in soot. The beautiful view of the mountains was obscured behind a haze of air pollution, and drivers had to use their headlights in daylight in order to see. Today 12.6 percent of Chattanoogans are employed in manufacturing; while much less than 50 years ago, this is still higher than most U.S. cities (U.S. Census Bureau,
TABLE 4-11 Key Characteristics for Chattanooga
| Indicator | Chattanooga | United States |
|---|---|---|
| ENV: Average Annual Precipitation (inches/year) | 52.44 | 40.8 |
| ENV: Existing Tree Canopy (% of land cover) | 23 | 25 |
| ENV: Roadway Fatalities (per hundred million annual vehicle miles traveled) | 1.40 | 1.10 |
| ENV: Particulate Matter 2.5 (ppm) | 13.5 | 10.2 |
| ENV: Residential Carbon Footprint (metric tons of CO2 per capita from residential energy consumption) | 3.1 | 3.4 |
| ECON: Financial Health | AAA | AA+ |
| ECON: Average Residential Electricity Rate (cents/kWh) | 10.13 | 11.88 |
| SOCIAL: Black or African American | 19.8% | 13.2% |
| SOCIAL: Hispanic or Latino | 5.1% | 17.4% |
| SOCIAL: Asian | 2.1% | 5.4% |
| SOCIAL: Home Ownership (2009-2013) | 64.9% | 64.9% |
| SOCIAL: High School Graduate (25 or older, 2009-2013) | 86.3% | 86% |
| SOCIAL: Below Poverty Level | 16.6% | 15.4% |
| SOCIAL: Rate of Violent Crimes (Type 1 Violent Crime Offenses Reported/100,000 people) | 636 | 191 |
NOTE: ENV, ECON, and SOCIAL refer to the three dimensions of sustainability: environmental, economic, and social, respectively. SOURCE: Appendix B.
2015a). Along with the region’s declining but still relatively high reliance on coal for electricity generation, the city’s strong manufacturing base contributes to its noncompliance with fine particulate matter. TVA’s shrinking reliance on coal power contributes to the city’s smaller-than-average residential carbon footprint. Reflecting its strong business and industrial base, Chattanooga enjoys a higher financial rating (AAA) than the U.S. government (AA+) (Tables 4-11 and Appendix B).
Figure 4-22 compares the performance of Chattanooga and the United States on seven sustainability indicators. The spider chart was created using the metrics data supplied in Table 4-11. The chart shows that Chattanooga today falls far short of the nation in terms of public safety and air quality, but excels in financial health.
MAJOR SUSTAINABILITY EFFORTS
Today’s postindustrial Chattanooga economy and environment are in stark contrast to the city it was half a century ago, with clean air, new investments in high-tech businesses and clean manufacturing, and an emphasis on sustainability. The “Chattanooga way” (see Box 4-6)—combining strong and sustained community and business leadership with a commitment to participatory democracy—has produced an environmentally based urban recovery movement that has transformed the city.
Air Pollution
As the industrial and railroad sector thrived in Chattanooga, so did unregulated air particle emissions in the late 1960s. Residents, governmental officials, and industrial leaders united to clean the air over the city they called home. In 1969, Chattanooga passed an Air Pollution Control Ordinance (after being declared the city with the dirtiest air in the country). The ordinance created the Air Pollution Control Board and Bureau, and placed significant limits on stationary and mobile emissions. Despite a compliance cost of over $40 million a year, all major contributors to Chattanooga emissions were in line with the new standards within 3 years (Chattanooga-Hamilton County Air Pollution Control Bureau, 2015). A large contributing factor to reducing emissions in the 1970s was the loss of foundries and factories in Chattanooga. However, it would take 20 years for the Chattanooga skies to meet federal standards. When Chattanooga did acquire attainment, it was one of the first eastern cities to succeed for 1-hour ozone levels (Hundt et al., 2009).
The EPA created more stringent air quality regulation in 1997; to achieve these stricter federal standards as soon as possible, Chattanooga formed an Early Action Compact. As Chattanooga continued its efforts to clean the air, so did the EPA nationwide by again setting new stricter levels of air quality (Chattanooga-Hamilton County Air Pollution Control Bureau, 2015). After failing to meet the standard in 2004, Hamilton County initiated motor vehicle emission testing (EPA, 2014d). Other aggressive measures taken by the city and county to meet these new standards included a burning ban from October to April, lowering the speed limits for trucks, retrofitting school buses to be emission neutral through the use of diesel oxidation catalysts, and installing vapor recovery systems at gas stations (Chattanooga-Hamilton County Air Pollution Control Bureau, 2015).
Land Use and Transportation
Revitalization efforts to create a sustainable city began in the 1980s. Moccasin Bend, 600 acres of land that straddle the Tennessee River across from downtown Chattanooga, was the initial target. The Lyndhurst Foundation, which attained its fortune from an heir of the Coca-Cola bottling rights, funded an Urban Land Institute evaluation of Moccasin Bend. The task force concluded that efforts to revitalize the city must be focused on reconnecting the city with the Tennessee River. A plan for a 22-mile Tennessee River Park was conceptualized in hopes of creating community pride and inviting new investments and tourists (Eichenthal and Windeknecht, 2008).
With the election of Mayor Gene Roberts in 1983, and continued revitalization efforts by the Lyndhurst Foundation, plans were initialized for the Miller Park District. Located in the center of downtown, the plan called for a Tennessee State Aquarium and the construction of additional housing. The Lyndhurst Foundation further funded “Chattanooga in Motion” to allow Chattanooga leaders to visit other cities also hoping to revitalize their downtown areas. Following these visits, the Chattanooga Venture was created in 1983 to host a series of public meetings discussing what the ideal Chattanooga would look like in 2000. These meetings resulted in Vision 2000. Among the goals detailed in Vision 2000 were the preservation of the Walnut Street Bridge and additional downtown affordable housing (Eichenthal and Windeknecht, 2008).
After receiving funding from the Lyndhurst and Tonya Foundations, the Miller Plaza opened in downtown Chattanooga in 1988. For more than 20 years, the plaza has served as a place for Chattanoogans to gather. Also in 1988, ground was broken along the banks of the Tennessee River for the Tennessee State Aquarium. Funded exclusively by private donations, including $10 million from the Lyndhurst Foundation, the largest freshwater aquarium in the world opened in 1992. In less than half a year, more than one million people had visited the aquarium, and it had brought in more than $130 million to Chattanooga in its first year. Chattanoogans had participated in civic engagement to accomplish a large-scale goal, and thus the “Chattanooga way” had worked.
Also in 1992, Chattanooga became one of the first cities to launch a free electric shuttle, in this case connecting the largest hotel in Chattanooga to the aquarium (Eichenthal and Windeknecht, 2015). In 2012, the Chattanooga electric shuttle celebrated its 20th anniversary and ridership of nearly 17 million since opening (Pare, 2012). In 1993, the Walnut Street Bridge reopened and connected downtown Chattanooga to North Chattanooga (Eichenthal and Windeknecht, 2015). Today, the Walnut Street Bridge is one of the longest pedestrian bridges in the world and is seen as a symbol of Chattanooga (Wade, 2014). In 1994, the first multifamily apartment complex opened in downtown in 20 years. The citizens of Chattanooga and their leaders again joined forces to complete Coolidge Park along the river. This 10-acre park replaced a Coast Guard reserve station and now boasts a carousel and rock climbing wall. By the beginning of the new millennium, downtown Chattanooga had transformed into a thriving center for nightlife complete with hotels, entertainment, restaurants, and a minor-league baseball stadium (Eichenthal and Windeknecht, 2008).
Additional steps were taken by the local government in the waning years of the 20th century to prepare Chattanooga for the 21st century. In 1996, citizens approved a referendum to raise taxes with an understanding that half of revenues would go toward enhancing economic development. An environmentally friendly building was constructed to house city and county offices in part as a result of this tax. Further conversion and reconstruction projects continued throughout the downtown area (Eichenthal and Windeknecht, 2008).
Sustaining Chattanooga for a Changing Climate
In 2006, Chattanooga Mayor Ron Littlefield was among the first 500 mayors to sign the Climate Protection Agreement (Garcia, 2007). This committed Chattanooga to record its current emissions levels and set goals to reduce emissions. As is the “Chattanooga way,” the residents were asked for their opinions and views. More than 500 attended “Chattanooga Green,” a meeting to gauge what Chattanoogans wanted from a sustainable city. After receiving input from Chattanoogans, the Chattanooga Green Community analyzed ways to turn these hopes into reality. In 2009, Chattanooga unveiled its climate action plan that detailed 47 action items (Hundt et al., 2009).
The Chattanooga Climate Action Plan focuses on four areas: energy efficiency, education and policy, healthy communities, and natural resources. The Chattanooga Green Committee—14 individuals appointed by the mayor—hoped through this plan Chattanooga could achieve its goals while improving the quality of life and ensuring Chattanooga remains economically competitive. In order to implement this plan, the committee recommended an Office of Sustainability (Hundt et al., 2009). After opening, this office merged with the Chattanooga-Hamilton County Regional Planning Agency to reduce costs (Hightower and Sohn, 2012). The committee research found that electricity and transportation were the largest contributors to emissions in Chattanooga. With this in mind, the committee set the following three goals: (1) 7 percent reduction in GHG emissions by 2012 compared to 1990, (2) 20 percent reduction in GHG emissions by 2020 compared to 1990, and (3) 80 percent reduction in GHG emissions by 2050 compared to 1990 (Hundt et al., 2009).
First, the committee recommended focusing on energy efficiency and increasing alternative energy use. Alstom, a wind turbine manufacturer, opened a plant in Chattanooga in 2010. The plant is partially funded by a Department of Energy clean-energy tax credit worth $63 million (Micheli, 2013). The Chattanooga Airport is now also 85 percent powered by a 7.5-acre solar farm located at the airport that generates 2.1 MW (Pare, 2013). Furthermore, the mayor of Chattanooga issued an executive order in 2012 mandating a 25 percent reduction in energy usage by city departments and offices by 2020, a move that will annually save nearly $3 million by conservative estimates (Hightower and Sohn, 2012). Following the recommendation of the committee, the city’s municipal utility—the Electric Power Board (EPB)—became a TVA Generation Partner through generating energy that TVA can buy back. Consumers are incentivized to invest in green power by as much as $1,000 to offset initial costs. TVA then buys this entire green power output at a premium (EPB Electric Power, 2015).
Additionally, the committee recommended constructing LEED-certified buildings (Hundt et al., 2009). The first and still only LEED Platinum certified auto plant on the planet is now in Chattanooga following the opening of the Chattanooga Volkswagen Plant (Volkswagen Group of America, 2014). The committee also endorsed more green buildings in Chattanooga (Hundt et al., 2009). Today, Chattanooga’s green buildings are enabled by green|spaces, a store dedicated to providing materials necessary for green building, and a Green Building Council on the Home Builders Association of Greater Chattanooga (green|spaces, 2015; Home Builders Association of Greater Chattanooga, 2015; Malek, 2015). Since the committee recommendation to increase recycling, Chattanooga has made it easier for its residents to recycle by offering recycling bins (City of Chattanooga, 2015).
The committee also voiced that city officials were already acting properly by continuing to focus on ensuring that Chattanooga’s downtown offers affordable housing so Chattanoogans can live, work, and play in a focused area. This coupled with further alternative transportation options will further reduce emissions (Hundt et al., 2009). In 2013, Chattanooga launched “GreenTrips,” a program that rewards commuters for opting to bike, walk, carpool, or use public transportation (GreenTrips, 2015). Chattanoogans are able to register “green trips” they have taken and receive points. These points can then be redeemed to buy prizes or enter contests. Today, biking is particularly attractive to Chattanoogans thanks to “Bike Chattanooga,” a program that allows members to pick up and drop off bikes at their convenience from dozens of stations across the city (Chattanooga Bicycle Transit System, 2015). Chattanooga has also been named a top 40 American bike-friendly city (Bicycling, 2014).
The committee also urged the city to continue expansion of greenways, protection of biodiversity, and further planting of trees (Hundt et al., 2009). As would be expected from a city focused on manufacturing, trees had been replaced with pavement and factories. Since undertaking sustainable efforts, the tree canopy of Chattanooga has grown (Figure 4-17). It should continue to expand with the “Citizen Forrester” program, in which participants of the program discover where to best plant different types of trees in the city (Barnett, 2011). In terms of city green
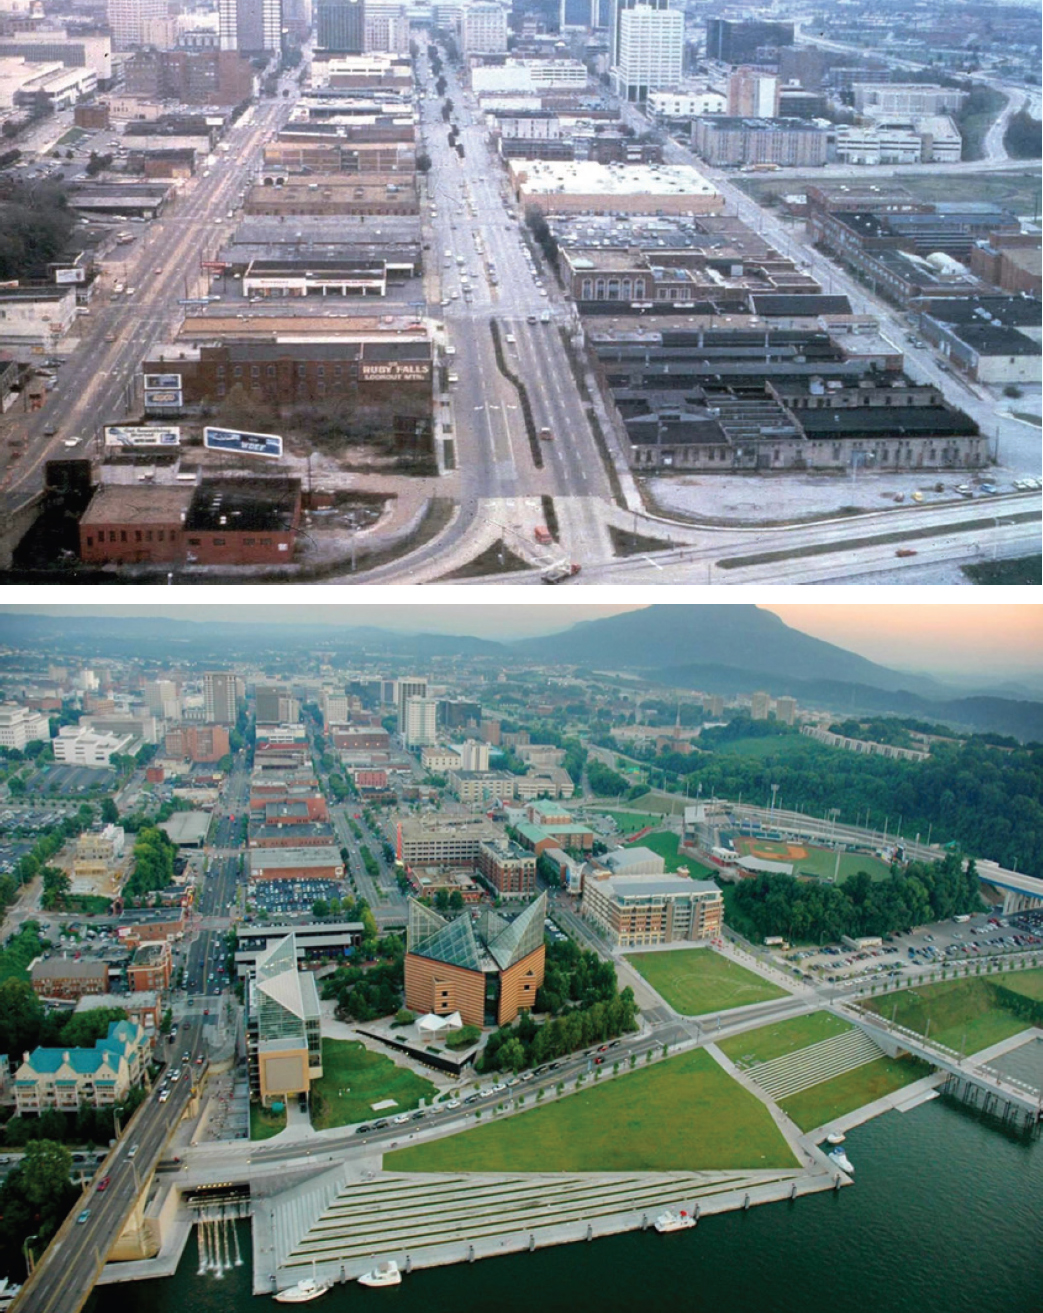
space, Main Terrain Art Park, a 1.72-acre park, opened in 2013. The park hosts on-site detention ponds that store 1.5 million gallons of water annually. This water is then recycled to irrigate the park (National Endowment for the Arts, 2015). In the coming decades, climate is not the only expected change for Chattanooga. The population of the Greater Chattanooga area is expected to surge from 1 million to 1.4 million by 2055. Once again the community of Chattanooga is engaging in conversations of how to sustain their scenic city through Thrive 2055 (Omarzu, 2014).
OTHER SIGNIFICANT ACTIVITIES
Over the past several years, Chattanooga has continued to apply innovative approaches to promote sustainability. Of particular note are its unique fiber optic and smart grid networks. In 2011, EPB completed the installation of 8,000 miles of fiber optic cables, making it the first “gigabit city” offering gigabit speeds as a standard residential fiber optic option. High-speed fiber optic networks send data as instant pulses of light rather than signals over a metal cable. This fiber optic network delivers television, phone, and broadband services to every residence and company in EPB’s 600-square-mile territory. Unlike most systems, its high-end services are not just an option for the affluent, but are standard service for all (Chattanooga Area Chamber of Commerce, 2015).
With a grant from the U.S. Department of Energy, Chattanooga was able to add intelligent devices to its electricity distribution system, supported by its fiber optic backbone, to achieve more reliable and efficient services. Its distribution automation is served by 1,200 “IntelliRupter Pulse Closers” producing real-time telemetry that is sent to EPB’s SCADA (Supervisory Control and Data Acquisition) system every 4 seconds (see Figure 4-18) (Wade, 2014). This system avoids electric outages by detecting potential faults and rerouting power. In addition, EPB’s automated meter infrastructure allows customers to manage their usage more effectively with real-time
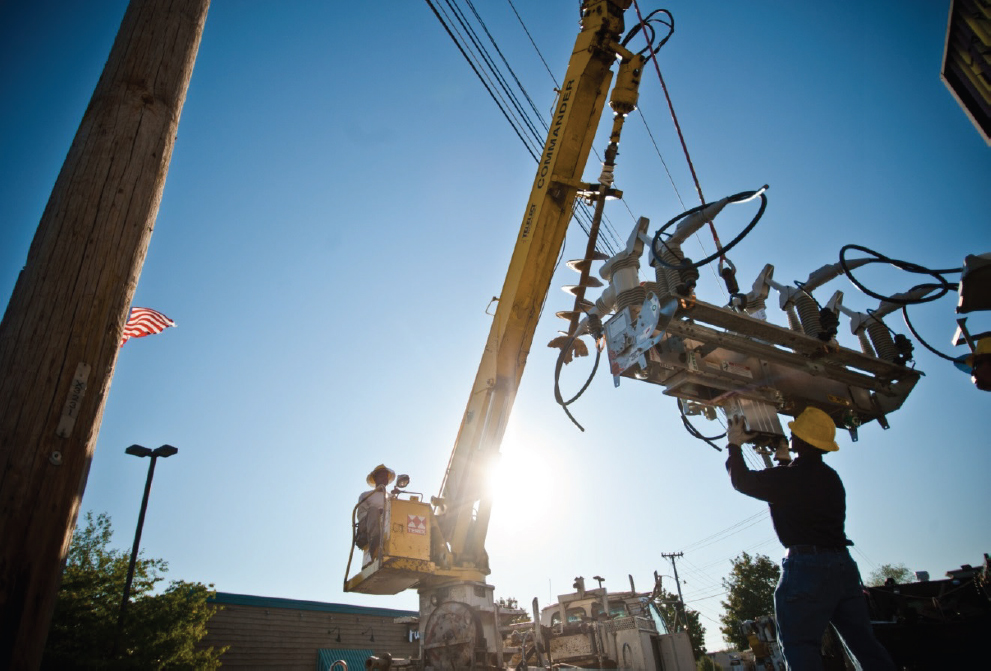
TABLE 4-12 Example Highlighting Actions for Chattanooga that Illustrate Steps in Urban Sustainability Roadmap (see Chapter 3, Figure 3-1)
| City | Chattanooga |
|---|---|
| Adopt Principles | P1, P2, P3, P4 |
| Opportunities and Constraints | Scenic location with access to the Tennessee River; gigabit city. Historically “dirtiest air in the nation”; race and crime issues; unemployment. |
| Prioritize Co-net Benefits | Improve air quality: City becomes a community again. Become greener: Invites tourists to visit and new companies move in. Prepare for a changing climate: Ensures Chattanooga is a sustainable city. |
| Partnerships | Chattanooga formed an Early Action Compact. Partnerships induced by a leading foundation, the Lyndhurst Foundation. Chattanooga Venture was created in 1983 to host a series of public meetings discussing what the ideal Chattanooga would look like in 2000. These meetings resulted in Vision 2000. |
| Goals | Achieve a cleaner, greener, safer city with rehabilitated housing and nonpolluting jobs: Achieved. Comply with EPA air quality standards: Achieved. Bring the community and jobs back into the city: Achieved. Reconnect the city with the Tennessee River: Achieved. 80% reduction of GHGs by 2050 compared to 1990: In progress. |
| Strategies | Vision 2000: public-private partnerships and strong public engagement. The climate action plan: Creation of a Chattanooga Office of Sustainability. |
| Data Gaps | |
| Implementation | Chattanooga passed an Air Pollution Control Ordinance. Creation of the gigabit city with a smart grid and infrastructure to enable the growth of IT-driven businesses. |
| Local to Global | — |
| Public Buy-in | The “Chattanooga way” (see Box 4-6). |
| Feedback | — |
consumption data and time-of-use rates. With these features and more, Chattanooga has become arguably the smartest municipal electric grid in the country.
With these infrastructure assets, Chattanooga has developed business accelerator programs to launch businesses based on ultrabroadband applications. This has drawn entrepreneurs from across the globe to Chattanooga, including HomeServe USA and Engage 3D, that have chosen to relocate to the city because of its smart grid and fiber optic capabilities (Chattanooga Area Chamber of Commerce, 2015).
Chattanooga has also achieved greater “procedural” equity with respect to its governance. The government of Chattanooga was commission style until 1990. This meant the five city commissioners were elected through at-large elections rather than through elections that were based on district representation. A recommendation of Vision 2000 was for Chattanooga to adopt a mayor/council model that would provide greater government representation for all residents. Following a lawsuit, the commission style was ruled illegal under the Voting Rights Act since it did not allow fair representation from the minority population of Chattanooga (Table 4-12). Chattanooga adopted the recommended revised form of government that now has nine city council members elected through nine district elections. This innovation led to the inaugural council comprised of nine members who had never served in city government before. While the council had only ever had one nonwhite commissioner before 1990, the council of today is now racially diverse (City Council of Chattanoga, 2015; Eichenthal and Windeknecht, 2008).
SUMMARY OBSERVATIONS
Chattanooga’s designation as the “dirtiest city in America” in 1969 became a catalyst for a sea of change. EPA’s air quality benchmarking motivated the city to go beyond incremental improvements to dramatically turn itself around. Without such a “wake-up” call, it is not clear that Chattanooga would have become the hub of sustainable growth that it is today. Other observations include the following:
- Chattanooga benefited greatly from the involvement of strong business and civic leaders, along with substantial resources made available from local foundations to fund the transformation planning and the reconstruction projects that accelerated change.
- Despite being plagued by numerous challenging issues, Chattanoogans were able to participate in civic engagement by laying out attainable goals for a cleaner environment, and pursuing them until they became a reality.
- The city’s land use planning fostered healthy urban ecosystems by capitalizing on Chattanooga’s unique assets, including the beauty of Moccasin Bend along the Tennessee River that had been rundown and lost as a focal point during the decades when heavy industry occupied this prime real estate.
- Its recent innovations in fiber optic and smart grid infrastructures have created new partnerships and enabled Chattanooga to attract clean high-tech development.
- Chattanooga has achieved further success by ensuring greater procedural equity in its governance by reforming the city government to be more inclusive.
- Despite the progress Chattanooga has made over the past five decades, not all Chattanoogans have benefited. Crime, poverty, and unemployment rates remain high.
Looking to the future, the sustainability efforts of Chattanooga will likely attract further economic development. Chattanooga should continue to build phoenix industries from the assets that previously existed in its historic manufacturing days. However, it is clear that sustainability initiatives alone cannot resolve enduring poverty and racial issues that continue to challenge Chattanooga. For this city to achieve world-class status, its less prosperous residents need to benefit more substantially from the creation of a greener city.
GRAND RAPIDS
The experience of Grand Rapids demonstrates three main lessons: (1) sustainability plans do more than set targets—they inform stakeholders of both the current conditions and plans for action; (2) measurable targets joined with scientific threshold impact statements encourage support and build local buy-in—they illustrate the importance of action and the consequences of inaction; and (3) triple-bottom-line indicators create a framework for sustainability that illustrates the co-benefits of multitargeted goals—they allow for broader and interrelated work plans.
BACKGROUND
A historic manufacturing city 30 miles due east of Lake Michigan, Grand Rapids is the second largest city in Michigan with a city population of 193,792. It is the seat of Kent County and the largest city in an eight-county area in western Michigan that includes 1.5 million people (Figure 4-19). The population is steady, gaining almost 4 percent of its population since 2000. However, social and economic issues challenge the city with more than one-quarter of its population living below the poverty rate, income at almost 20 percent less than the state of Michigan median, and a home ownership rate 15 percent less than the state’s average. A significant percentage of families pay more than 35 percent of their monthly income in housing costs (see Table 4-13) (U.S. Census Bureau, 2015b).
Grand Rapids is a city of innovation. Its history has included one of the nation’s first hydroelectric plants, it was the first city to introduce fluoride to its drinking water, and it had the first publicly funded art installation (Western Michigan Environmental Action Council, 2013). Today, local corporations have created a collaborative model for innovation with GRid70, a multicorporate research and development design hub that uses intersectoral
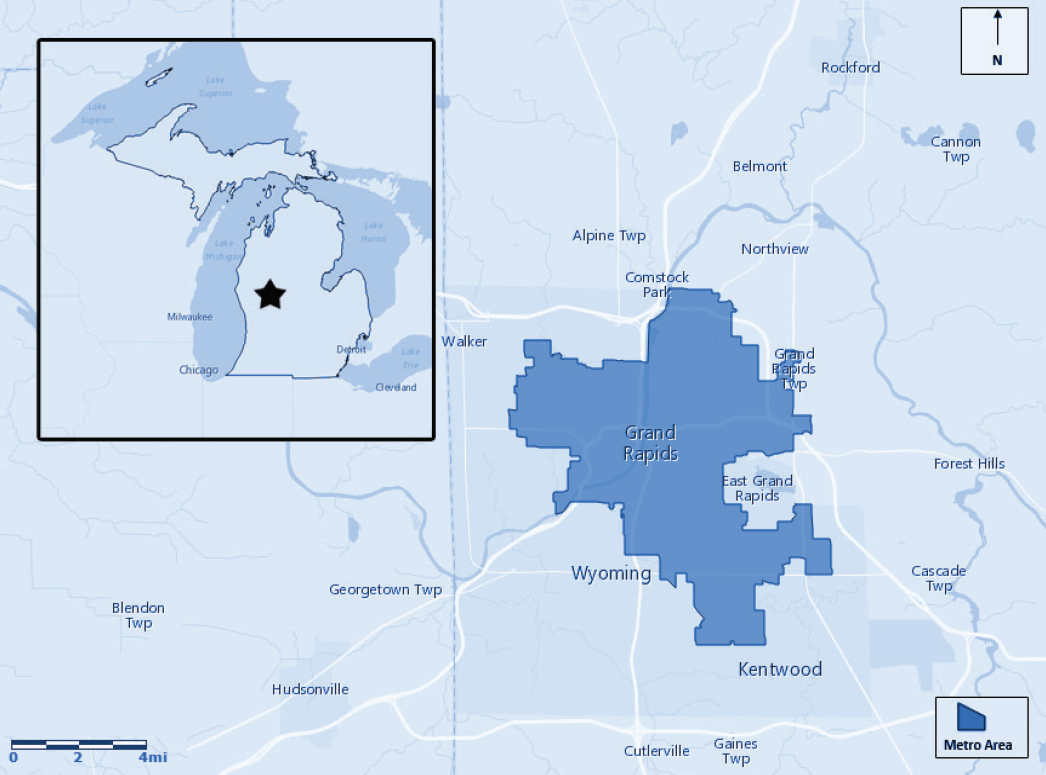
and interdisciplinary approaches to new product and process development in noncompeting companies in the region. Companies located in GRid70 include Meijer Stores, Amway, Mercy Health, and Wolverine Shoes (Knape, 2010). In addition, a new $15 million venture capital fund, Start Garden, invested in two new ideas a week in 2012. Those initial investments have grown with more capital being invested. From 2012 to 2016, Start Garden has invested in 190 ideas, 70 next stage projects, and 22 startups (Dishman, 2012; Sanchez, 2015).
Once known as the “Furniture City,” Grand Rapids experienced decline in traditional manufacturing in the 1960s and 1970s. The resulting job loss made diversifying the economy a priority. While 15 percent of the local workforce is still in manufacturing compared to a national average of 9 percent, the current economic profile includes furniture and office equipment, aviation, automotive, retail, manufacturing, sales, publishing, multisector service industries, and health care. Spectrum Health is the largest employer in western Michigan with over 23,000 employees. Grand Rapids is the fourth largest cluster of medical device suppliers in the Midwest and the eighth in biopharmaceuticals (Longworth, 2014).
With these growth industries, educational attainment, workforce preparation, and sectoral diversification are critical to support the regional economy. Grand Rapids was one of the first cities to receive a Department of Labor WIRED (Workforce Innovation in Regional Economic Development) grant through the West Michigan Strategic
TABLE 4-13 Key Characteristics for Grand Rapids
| Indicator | Grand Rapids | United States |
|---|---|---|
| ENV Average Annual Precipitation (inches/year) | 38.3 | 40.8 |
| ENV Existing Tree Canopy (% of land cover) | 34% | 25% |
| ENV Roadway Fatalities (per 100 million annual vehicle miles traveled) | 1.0 | 1.1 |
| ENV Particulate Matter 2.5 (ppm) | 12.2 | 10.2 |
| ENV Residential Carbon Footprint (metric tons of CO2 per capita from residential energy consumption) | 4.7 | 3.4 |
| ECON Financial Health | AA- | AA+ |
| ECON Average Residential Electricity Rate (cents/kWh) | 13.71 | 11.88 |
| SOCIAL Black or African American | 10.4% | 13.2% |
| SOCIAL Hispanic or Latino | 10.1% | 17.4% |
| SOCIAL Asian | 2.8% | 5.4% |
| SOCIAL Home Ownership (2009-2013) | 70.1% | 64.9% |
|
SOCIAL High School Graduate |
84% | 86% |
| SOCIAL Below Poverty Level | 26.8% | 15.4% |
| SOCIAL Violent Crimes (per 100,000 people) | 409 | 191 |
NOTE: ENV, ECON, and SOCIAL refer to the three dimensions of sustainability: environmental, economic, and social, respectively. SOURCE: Appendix B.
Alliance. A focus of the $15 million grant was on workforce development to improve the number and qualifications of the local workforce referred to as the “talent supply chain” (Longworth, 2014). The area’s number of high school graduates (83.9 percent) is less than both the state (88.9 percent) and national averages (86.0 percent). However, its population with a bachelor’s degree from 2009-2013 exceeds both at 29.9 percent (U.S. Census Bureau, 2015b). This effort is complemented by the area’s 2-year, 4-year, and graduate institutions, including Grand Valley State University and a branch of the Michigan State College of Human Medicine (Longworth, 2014).
MAJOR SUSTAINABILITY EFFORTS
Because of its strong corporate history, business leadership has been a prominent component of Grand Rapids’ civic culture working with local government and citizen groups to improve the quality of life in the city and invest in areas of promise. These strong partnerships allowed the city to identify problems and then create inclusive engagement processes for solutions. For example, in the 1980s deficiencies in storm and wastewater treatment triggered new approaches in infrastructure planning and investment (Western Michigan Environmental Action Council, 2013). In the mid-1990s, at the urging of a local business leader, the city began a process to use quality management principles to address local social issues (City of Grand Rapids, 2008). This study process lasted 18 months and resulted in the application and introduction of high-impact management practices across city departments.
According to former Mayor George Heartwell, this early work extended to the adoption of the triple-bottom-line (social, environmental, and economic) approach to sustainable development in 2005. The existing sustainability planning process was replaced with the formation of the Grand Rapids Area Community Sustainability Partnership (CSP). The partnership, which has grown from the original five members to over 200, includes community leaders from academia, government, business, and environmental organizations. The partnership’s work began by
providing guidance for improving the city’s services to residents and businesses and has since evolved to a more comprehensive sustainability initiative focused on triple-bottom-line indicators. In 2006 the city developed its first sustainability plan with a vision of improving the environment, economy, and social equity using indicators and specific targets guided by research, data, and implementation strategies. In 2008 the city worked in partnership with the Community Research Institute at Grand Valley State University to collect data on sustainability measures and to establish a baseline for the future assessment of outcomes.22 In addition, according to Dr. Haris Alibašić, director of the Office of Energy and Sustainability, the city established sustainability requirements for city buildings around materials, energy use, and water conservation for construction, renovation, and management. Sustainability has been a priority for the City of Grand Rapids for more than a decade (Box 4-7).23
A key component of the sustainability plan is its accountability. The Office of Energy and Sustainability and the CSP revised the 2006 plan in 2010 to cover fiscal years (FY) 2011-2015 with updates and specific data targets and indicator research included. This plan was adopted by the city and was updated in October 2015 with revised targets for FY2016-FY2020.
THE FOCUS OF THE SUSTAINABILITY PLAN
Grand Rapids has been quite successful in identifying indicators and targets in its triple-bottom-line approach to improve environmental, economic, and equity outcomes on a range of issues and also in highlighting co-benefits of the outcomes while managing tradeoffs. The Sustainability Plan for FY2011-FY2015 contains 232 targets organized around economic, social equity, and environmental outcomes (Alibašić, 2013; City of Grand Rapids, 2013b). In the fifth year of the FY2011-FY2015 plan, 188 of the targets are completed, 42 are in process, and 2 have had no change. Using the triple-bottom-line frame, 68 percent of the economic targets, 61 percent of the social outcomes, and 71 percent of the environmental targets have been met. The 32 resiliency recommendations of the Climate Resiliency Report are being incorporated into the Sustainability Plan and have measurable targets as well (City of Grand Rapids, 2015b).
___________________
22 G. Heartwell, interview with S. Morse Moomaw, July 2015.
23 H. Alibašić, interview with S. Morse Moomaw, July 2015.
While the plan covers a broad range of specific actions, the following is a summary of the priorities:
- On economic well-being, Grand Rapids emphasizes growing and encouraging small to mid-sized companies, a more diverse supplier base, worker skills and career readiness, and enhanced downtown and neighborhood business districts that capitalize on the Grand River area.
- In the social equity area, the focus is on improving the quality and quantity of housing, increasing educational attainment and workforce participation, expanding civic involvement, reducing crime, and improving the quality of life through access to the arts, food sources, and recreation.
- In the environmental area, the plan focuses on reducing greenhouse gas emissions and the impact on climate change, protecting the quality of natural systems including stormwater management, and implementing sustainable design and land use.
Within these three areas, four initiatives are particularly strong: reduction of greenhouse gas emissions, stormwater management, stakeholder engagement, and green infrastructure (City of Grand Rapids, 2013b).
Reduction of Greenhouse Gas Emissions
In 2009 as part of an initiative by ICLEI, the international association of local and metropolitan governments dedicated to sustainable development, the City of Grand Rapids joined with the U.S. Conference of Mayors Climate Change Protection Agreement to reduce greenhouse gas emissions. Using the six major sources of GHGs developed by the Kyoto Protocol—carbon dioxide, methane, nitrous oxide, hydrofluorocarbons, perfluorocarbons, and sulfur hexafluoride—Grand Rapids developed a data set that provides a baseline against which progress can be evaluated. Based on the data from the inventory, the city has identified very specific targets for reducing GHG emissions with the overall goal of meeting the obligations of the U.S. Mayors Climate Protection Agreement (City of Grand Rapids, 2009). The city has reduced direct and indirect CO2 emissions by 4,440 metric tons since 2012 (City of Grand Rapids, 2015b).
The Office of Energy and Sustainability has had a strong focus on the renewable energy sector. Renewable energy sources account for more than 30 percent of the city’s energy supply. Grand Rapids has committed to energy reduction and use in two major ways: (1) reduction of greenhouse gas emissions and reduction of energy demand and (2) reduction of fossil fuel consumption. These targets center on reducing time in cars and increasing sustainable, multimodal transportation alternatives (City of Grand Rapids, 2015b). The Intergovernmental Panel on Climate Change estimates that transportation is responsible for almost one-quarter of all energy-related GHG emissions (Ribeiro et al., 2007; Sims et al., 2014). Research from the CEO for Cities organization suggests that reducing 1 mile per day in vehicle miles traveled per vehicle in the region would generate $141 million in annual savings in fuel, maintenance, and automobile purchases (Cortright, 2008). Grand Rapids is continuing to expand its alternative transportation systems and increase use of alternative fuels. The city had reduced its GHG emissions by an average of 2.6 percent annually since 2013 due to efficiency improvements, waste reduction, and renewable products (City of Grand Rapids, 2015b).
Stormwater Management
Stormwater management is important to the long-term growth and stability of all cities but particularly those who depend on a natural water source. In the 1980s, the city realized that the lack of a strong stormwater management process left it vulnerable to weather events, particularly the flooding of the Grand River, which intersects the city. As a result, several major initiatives were launched, including the Stormwater Asset Management Plan to provide a system inventory, the implementation of the Asset-Management Optimization Software system to locate any major breaches in the system, and the improvement of its stormwater ordinance, which is considered a model for other cities. The ordinance encourages 100 percent stormwater retention on new development sites and offers “greenspace” credits to encourage developers to incorporate innovative practices (Western Michigan Environmental Action Council, 2013). In addition, Grand Rapids’ sustainability plan calls for a 100 percent
compliance rate for three permit programs: the Stormwater Pollution Prevention Initiative, the Public Education Program, and the Illicit Discharge Elimination program. As of 2008, the city had spent more than $350 million to separate combined sewers and to eliminate overflows into the Grand River. The city completed the initiative to eliminate all its combined sewer discharges into the Grand River in 2015 (City of Grand Rapids, 2013b, 2015a,b).
Stakeholder Engagement
Stakeholder engagement has been critical in the development and implementation of the Grand Rapids sustainability plan and is an important lesson for other cities. The mayor’s office, local leaders, and city employees view sustainability in the context of a multigoal approach and are encouraged to contribute to the “bottom line” of the goal results. The plan process subscribes to the Plan-Do-Check-Act method to achieve results, to be flexible and adaptable to a changing environment, and to plan budget and initiatives accordingly.
Sustainability is integrated horizontally and vertically with regional, state, and national partnerships and across neighboring communities (Price, 2011). These partnerships are guided by strategic initiatives that are cross-cutting and comprehensive. A current example of this vertical integration is the work the Office of Energy and Sustainability is doing with a number of western Michigan organizations and businesses to create the Grand Rapids 2030 Energy District to encourage high-performance buildings, which is positioned to encourage innovation, further education, and promote creative strategies across the built environment sector (Walton, 2015). Grand Rapids has the largest number of LEED buildings per capita in the United States with 83 buildings certified; of those, 24 are classified either platinum or gold (City of Grand Rapids, 2015a; The Right Place, 2016). Vertical integration and partnerships are key to implementation and impact.
Integrity of Green Infrastructure
The integrity of green infrastructure is a cross-cutting theme in the Grand Rapids Sustainability Plan and in the city’s Master Plan. The co-benefits of improvements in both the built and natural environments support a long-term response to climate change through the protection and maintenance of healthy ecosystems and habitats by increasing the tree canopy and the diversity of trees and planting low-maintenance grasses and native plants in parks and public spaces. Part of the Green Grand Rapids initiative, the current tree canopy covers 34 percent of the land area. The sustainability target is to increase the urban tree canopy to 40 percent (City of Grand Rapids, 2011c, 2015b).
In the built environment, the city aims to reduce the carbon footprint through 100 percent compliance with zoning regulations and land-use permits, by increasing the number of sustainable buildings through new construction and adaptive reuse, by instituting more areas of parkland and green space using low-impact design, and by increasing the accessibility of parks to community members. Sustainability targets to support these goals include increasing the number of acres of city-owned parks and open space, increasing the number of people who live within one-quarter of a mile of a park or open space, and making all parks and green spaces 100 percent compliant with the Americans with Disabilities Act. The Green Grand Rapids process used to engage community members around quality of life and green infrastructure issues in updating the Master Plan has engaged thousands of citizens with its user-friendly “Green Pursuits” board game that allows citizens to visualize the desired changes on a map of the city and then report back at “Green Gathering” sessions (City of Grand Rapids, 2011c, 2015b).
Finally, Grand Rapids, like many cities, was designed for automobiles. However, as the city is considering ways to improve multimodal options, citizens have advocated for a bicycle-friendly environment supported by Complete Streets. The goal is 100 additional miles of on-street bicycle lanes by the end of 2017 from the 72.5 miles in 2011 (City of Grand Rapids, 2011a,b). The League of American Bicyclists already considers Grand Rapids one of the nation’s most bike-friendly communities, rating it a bronze in its system of classifying communities (League of American Bicyclists, 2014). However, with a score of 55 out of 100, the community is quick to admit that improvement is needed to reach their goals.
OTHER SIGNIFICANT ACTIVITIES
In 2010 Grand Rapids joined with the ICLEI to launch the Climate Resilient Community Initiative with seven other inaugural partners to support research and action toward increasing local resilience. A partnership with the West Michigan Environmental Action Council in 2012 led to the documentation of climate change resiliency at the local level using the triple-bottom-line framework. The Grand Rapids Climate Resiliency Report (Western Michigan Environmental Action Council, 2013) included climate science, research and analysis, and the results from 25 local interviews. The interviewees represented a wide range of sectors impacted by climate change. Using the software Model for the Assessment of Greenhouse-Gas Induced Climate Change with the Regional SCENario GENerator v. 5.3.3, coordinates were marked for the City of Grand Rapids and projected to an area of 175 by 175 miles (Liobimtseva, 2013; Western Michigan Environmental Action Council, 2013).
The Great Lakes region, of which Grand Rapids is a part, can expect more variable and volatile weather from year to year and from season to season. This could lead to more extreme weather events, such as storms that produce more than 1 inch of rain in a 24-hour period, increased frequency of days above 90 degrees and 90 percent humidity, and more freeze-thaw cycles in winter and spring (Kling et al., 2003; Liobimtseva, 2013; Winkler et al., 2012). Additionally, data show that winter ice coverage on the Great Lakes decreased by 71 percent between 1973 and 2011 (Wang et al., 2012). Climate change variables of temperature and precipitation were projected for 2022 and 2042 using baseline data from 1961 to 1990. Projections for 2022 showed that temperatures will increase by 1.1 degrees and 2.6 percent, respectively (City of Grand Rapid, 2013a). The largest increases in temperature are projected to occur during the winter. Climate change impacts were assessed in terms of how they would affect residents’ quality of life and the ability of key sectors to provide services and benefits. While climate change impacts an individual sector in isolation, it also affects the interaction of the sectors and the function of the system as a whole. Therefore, understanding the needs of the community, major relationships between sectors, and the ability of the sectors to meet those needs in a changing climate are key to building resiliency.
The Office of Energy and Sustainability is now integrating resiliency and sustainability into emergency preparedness. This illustrates the kind of integrative thinking that has allowed Grand Rapids to continue to build synergy around sustainability and strive for a balanced community portfolio.
SUMMARY OBSERVATIONS
Grand Rapids illustrates how a mid-sized city can use planning, collaboration, and research to build a sustainability strategy. The city is developing a multifrontal approach to environmental security that identifies and measures sustainability indicators and their impact. The goal of the sustainability agenda is to reach beyond city government to corporations, small businesses, government agencies, nonprofit organizations, and the public at large. While this kind of integrated sustainability effort lies beyond the scope of a local government planning agency, continued and consistent municipal leadership provides an important foundation for sustainability efforts. Several key findings emerged from the work in Grand Rapids that can be helpful as other mid-sized cities consider sustainability planning:
- Actions related to climate change, resiliency, and sustainability can be considered concurrently in developing both targets and responses.
- A range of historic discriminatory practices around financial inequities, housing availability, and placement of at-risk neighborhoods causes vulnerable populations to be disproportionately affected by extreme weather events.
- Targets, words, and specificity matter. Sustainability planning must include benchmarks, targets, and implementation plans. Clarity on the definition and application of sustainability is critical.
- Broad-based community support, consistent community leadership, and collaboration across sectors are critical to changes in behavior and policy. Environmental issues must have champions.
- The triple-bottom-line (economics, social equity, and environmental) approach to sustainability provides a transparency that can engender a more inclusive set of stakeholders and actions.
Recognized by the U.S Conference of Mayors in 2012 for efforts to confront global climate change, in 2010 as the “Nation’s Most Sustainable City” by the U.S. Chamber of Commerce, and in 2009 as a Regional Centre of Expertise on Education for Sustainable Development by the United Nations, Grand Rapids is reaching its goals by setting sustainability as a priority early on, recognizing the co-benefits between issues, and being intentional in its approach (City of Grand Rapids, 2015b). See Table 4-14.
TABLE 4-14 Example Highlighting Actions for Grand Rapids that Illustrate Steps in Urban Sustainability Roadmap (see Chapter 3, Figure 3-1)
| City | Grand Rapids |
|---|---|
| Adopt Principles | P1, P2, P3, P4 |
| Opportunities and Constraints | Opportunities: Reduction of carbon footprint, water protection and conservation, stakeholder engagement, green infrastructure, and expanding economic opportunities through health care and tourism. Constraints: Fiscal limitations to implement strategies, transportation infrastructure, and poverty. |
| Prioritize Co-net Benefits | The City of Grand Rapids Sustainability Plans have approached the challenge of sustainability through the triple bottom line—economics, equity, and environment—and their related co-benefits. The goals set respond to each of these areas separately but are intentional about identifying and enhancing the intersections of the three. |
| Partnerships | The Grand Rapids Area Community Sustainability Partnership (CSP). has grown from the original five members to over 200 and includes community leaders from academia, government, business, and environmental organizations. GRid70, a multicorporate research and development design hub, uses intersectoral and interdisciplinary approaches to new product and process development in noncompeting companies in the region. Community Research Institute at Grand Valley State University assists the Sustainability Office with data and data collection to support the target indicators. An example of vertical integration is the work the Office of Energy and Sustainability is doing with a number of western Michigan organizations and businesses to create the Grand Rapids 2030 Energy District to encourage high-performance buildings. |
| Goals | To approach sustainability from a triple-bottom-line perspective in order to ensure economic vitality, social equity of all residents, and protection the natural and built environment. |
| Strategies | To build a strong economy by expanding sectors, investing in workforce development, supporting small business development, and strengthening the quality of life. To create social equity by increasing housing choices, improving educational outcomes, making community services and opportunities more accessible, and reducing crime. To secure the environment by reducing energy use and dependence on fossil fuels, reduction, managing stormwater more efficiently, expanding the amount and accessibility of green space and the tree canopy, conserving and protecting water, and developing mobility options. |
| Data Gaps | Data to support implementation strategies, to update and verify outcomes, and to determine interrelationship and connectedness with region, state, and world. |
| Implementation | Targeted investments in technology, natural systems, human capital, the built environment, and social capital. |
| Local to Global | A founding city in the ICLEI network, Grand Rapids has a commitment to the U.S. Mayor’s Climate Change Agreement and the use of available science and protocols to contain local and regional footprint. |
| City | Grand Rapids |
|---|---|
| Public Buy-in | The growth of the Community Sustainability Partnership is evidence of strong support for the concept. In addition, the city uses traditional media, social media, and neighborhood dialogues to communicate plans and progress and to solicit input from a broad range of stakeholders. The Green Grand Rapids process to update the Master Plan around quality of life and green infrastructure issues has engaged hundreds of community members with its user-friendly “Green Pursuits” that allows citizens to visualize the desired changes in a board-game map process and then report back at “Green Gathering” sessions. |
| Feedback | Since the city adopted its first Sustainability Plan in 2006, there have been five target updates as well as a Climate Resiliency Report published. |
CEDAR RAPIDS
Cedar Rapids has followed the path of many small cities in the Midwest. The population of urban areas has increased as farming has become more mechanized, but the city economy is still dominated by the agricultural economy. Cedar Rapids is an example of many small to moderate-sized cities spread across the landscape in resource-rich areas with sufficient rainfall that are, or could be, producers of the stuff (food, timber, minerals, energy) that supplies staples to the rest of society (Day et al., 2016). The megatrends of the 21st century, especially that of energy scarcity, will likely result in agriculture becoming more labor intensive with a higher diversity of crops than is common now. Farm communities will also likely become more robust with the re-invigoration of rural institutions.
BACKGROUND
Cedar Rapids is in the center of a region that supplies an enormous amount of grain and other foods both to U.S. consumers and to export markets. Cedar Rapids is the second largest city in Iowa after the state capital, Des Moines (Figure 4-20). It is the only urban area among those considered in this report that is not part of a mega-region as described in the section on settlement patterns and population distribution (see Figure C-1 in Appendix C) (Hagler, 2009). It is one of many small cities established in the rich agricultural region of the Midwest in the 19th century, and where many counties are classified as underperforming (see Figure C-2 in Appendix C) (Hagler, 2009). Counties in underperforming regions are those that have not kept up with national trends in population, employment, and wages (Hagler, 2009).
The fertility of soils in the United States is highly variable and the Midwest “breadbasket” has some of the richest soils in the world. Figure C-3 in Appendix C shows the soil fertility index derived by Schaetzl et al. (2012). The dominant soil order as defined by the U.S. Department of Agriculture in much of the Midwestern Great Plains heart of U.S. agriculture is Mollisol, typically found where grassland ecosystems have flourished. The long-term addition of organic materials derived from grassland plants creates a thick, dark, fertile surface soil. This in turn enables incredibly productive agriculture. Around the world, Mollisols are used extensively for growing food (Brady and Weil, 2007). Much of the rest of the Midwest is characterized by Alfisols, highly fertile soils mainly formed under forest cover. Although Mollisols and Alfisols are widespread in the United States (together they make up more than one-third of U.S. land area), other soil types found around the country, especially in the east and west of the Great Plains, are not as favorable for growing food unless significant resources are used to boost productivity (Day et al., 2016). Inevitably, utilizing soils for agriculture causes changes in soil properties and can enhance the risk of erosion (Powlson et al., 2011). The richest soils are in the Midwestern breadbasket and the upper Great Plains.
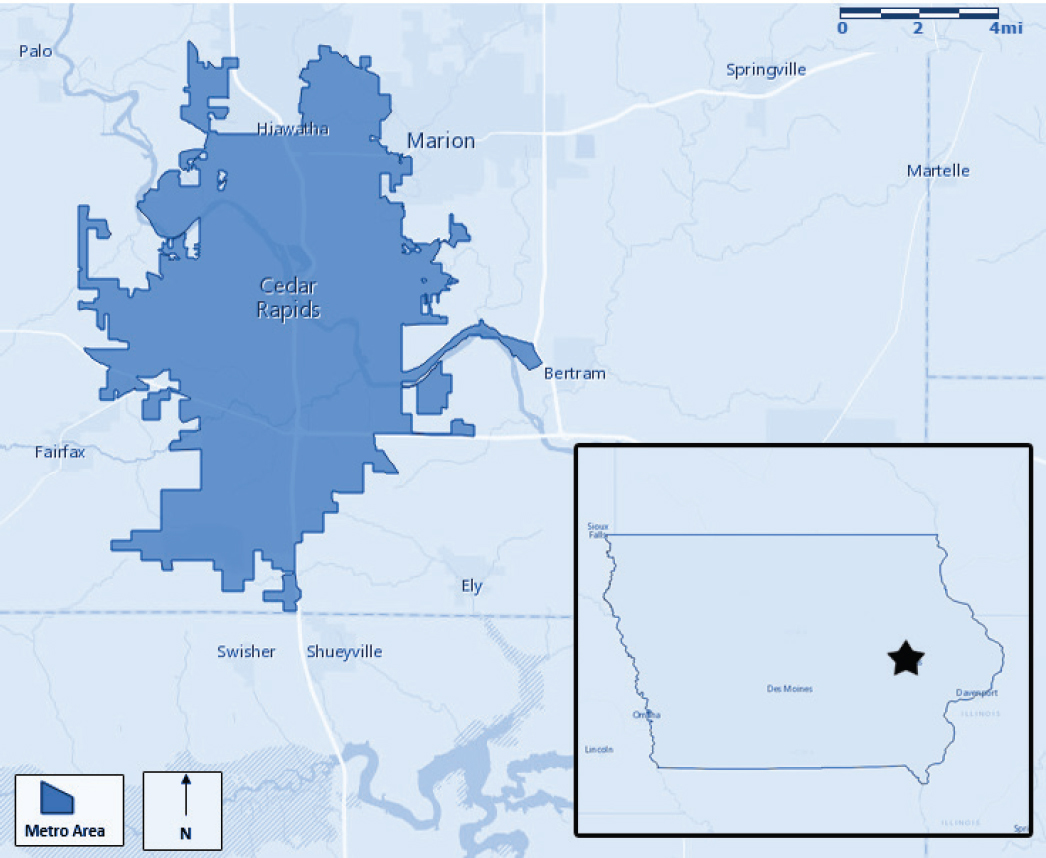
The city is situated on both banks of the Cedar River. The city’s population was 1,830 in 1860 and increased to 25,656 by 1900. It surpassed 100,000 by 1970. The population remained relatively stable during the 1980s and 1990s. In 2010, the population of the city was just over 125,000, while that of the three-county metropolitan area was 255,452 (Day et al., 2016).
Given the fertility of the surrounding agricultural land and its location on a tributary to the nearby Mississippi River, it is unsurprising that grain processing forms the basis of Cedar Rapids’ economy. Large agricultural companies that have offices in Cedar Rapids include Quaker Oats, Archer Daniels Midland, Cargill, and General Mills. Early in the 21st century, the value of agriculture products in east central Iowa was $600 million from crops and $300 million from livestock. Other important employers are the defense and commercial avionics company Rockwell Collins and the insurance company Aegon. Partly because of Rockwell Collins, Cedar Rapids has more engineers per capita than any other city in the United States. The city also has a higher percentage of exported products, per capita, than any other in the country, mainly reflecting the agricultural and avionics industries (Day et al., 2016).
TABLE 4-15 Key Characteristics for Cedar Rapids
| Indicator | Cedar Rapids | United States |
|---|---|---|
| ENV Average Annual Precipitation (inches/year) | 37.6 | 40.8 |
| ENV Existing Tree Canopy (% of land cover) | 13 | 25 |
| ENV Roadway Fatalities (per 100 million annual vehicle miles traveled) | 1.0 | 1.1 |
| ENV Particulate Matter 2.5 (ppm) | 11.1 | 10.2 |
| ENV Residential Carbon Footprint (metric tons of CO2 per capita from residential energy consumption) | not available | 3.4 |
| ECON Financial Health | Aa1 | AA+ |
| ECON Average Residential Electricity Rate (cents/kWh) | 13.0 | 11.9 |
| SOCIAL Black or African American | 4.5% | 13.2% |
| SOCIAL Hispanic or Latino | 2.9% | 17.4% |
| SOCIAL Asian | 2.2% | 5.4% |
| SOCIAL Home Ownership (2009-2013) | 73.0% | 64.9% |
| SOCIAL High School Graduate (25 or older, 2009-2013) | 94% | 86% |
| SOCIAL Below Poverty Level | 9.7% | 15.4% |
| SOCIAL Violent Crimes (per 100,000 people) | 212 | 191 |
NOTE: ENV, ECON, and SOCIAL refer to the three dimensions of sustainability: environmental, economic, and social, respectively. SOURCE: Appendix B.
Before colonization, the area was inhabited by tribes belonging to the Prairie-Plains Indian culture whose members lived both migratory and settled lifestyles. The Sauk and Meskwaki tribes dominated eastern Iowa. These tribes sold their lands to the federal government and were relocated to Kansas. Cedar Rapids was settled, like much of Iowa, by European immigrants in the mid-1800s. The city was established in 1838 and incorporated in 1849. By 1870, farms and small towns covered much of the state, ending the frontier era.
From its founding, the economy of Cedar Rapids, like many towns and cities in the Midwest farm belt, has been tied to agriculture due in large part to the fertility of the area’s soils. However, agriculture and infrastructure in the area have changed over time. Prior to the Civil War, wheat, oats, barley, hay, and sorghum were important crops. Crops were first shipped to markets on the Mississippi River, but in the 1850s, rail transport began. Following the Civil War and the completion of an east-west rail line across Iowa in 1867, the main agricultural crops changed to corn and hogs. For the most part, corn was fed to hogs that were then sold on the market. Iowa also became an important egg producer. It remains a top-producing state of corn, hogs, and eggs today.
In the first part of the 20th century, farms produced much of the food they consumed typically from large flocks of chickens, large gardens, small dairy herds, and fruit trees. After World War II, farms became less diversified and most farm families bought their food rather than produce it. Agricultural productivity increased and substituted mechanization and inputs, such as pesticides and fertilizers, for labor. As a result, farm sizes grew larger, and Iowa farms began to specialize in corn, soybean, and hog production (Day et al., 2016).
MAJOR SUSTAINABILITY EFFORTS
The vision of Cedar Rapids to create a more sustainable community is incorporated into its iGreenCR Team report. The City of Cedar Rapids contributes to this team by investing in more sustainable practices and working toward goals set for city operations to reach by the year 2020. The iGreenCR vision is built around five central principles:
- Community—Building a community that embraces its diversity and history;
- Growth—Advancing opportunities for businesses, individuals, and the community as a whole to thrive;
- Environmental Stewardship—Promoting economic and social growth while restoring the relationship between the city and its natural environment;
- Affordability—Creating a city that is affordable and accessible to all members of the community; and
- Innovation—Serving as a leader in creative, successful strategies to lead the progression toward a sustainable future.
Elements of this vision include options for biking and mass transit; energy efficiency; a focus on environmental amenities such as parks, gardens, and urban and nearby water bodies; urban forestry; efficient use of water; and attention to place and history. Energy efficiency initiatives include tracking of reduced greenhouse gas emissions. There are no specific plans for meeting the energy needs of the city from renewables (Ambrosy et al., 2014).
Climate change impacts to the Cedar Rapids region will be moderate compared to other regions of the country such as the Southwest and coastal areas. There will be some temperature increase but rainfall should remain adequate for agriculture. The National Climate Assessment (NCA) reported that annual precipitation in Iowa increased by 5 to 15 percent from 1992 to 2012 compared to the 1901-1960 period (Melillo et al., 2014). The NCA also projected that precipitation in Iowa would increase by about 10 percent in the spring, decrease by less than 10 percent in the summer, and increase by less than 10 percent in the fall by the period 2071-2099 compared to the period 1970-1999. These climate projections indicate that Iowa will remain very suitable for agriculture without the necessity of any significant irrigation.
Cedar Rapids could easily feed itself from its local foodshed, as well as provide a surplus for other regions if a greater diversity of crops were grown. It has been reported that it takes about 1.25 acres per capita to provide a typical American diet (Peters et al., 2007; Pimentel and Pimentel, 2003). The population of metropolitan Cedar Rapids is about 255,000 so it would require about 320,000 acres to feed the city based on 1.25 acres per person, or an area within less than 20 miles from the city.
OTHER SIGNIFICANT ACTIVITIES
An analysis of the sustainability indicators indicates that Cedar Rapids fares well compared to the other cities in this analysis. Particulate matter is in the midrange for the case-study cities while the air quality index is one of the best. It has the best water quality index of all the cities. The flat topography of the land means landslide vulnerability is nil. Natural hazard vulnerability is high perhaps due to flooding potential.
Economic indicators are in the midrange to positive for Cedar Rapids. The city has the lowest unemployment of the cities analyzed. It scores low for percent use of public transit and walk score and is in the midrange of water usage.
Social indicators are also generally positive for Cedar Rapids. It is a relatively small metropolitan area with a largely white population. Compared to other case-study cities, it has the highest median household income, the lowest poverty rate, the lowest income inequality ratio, the lowest rate of violent crime, and the best health indicators. Cedar Rapids has a very high population of college-educated people. Despite its low population density and high percentage of licensed drivers per driving-age population, the city has the lowest mean travel time to work and, by far, the lowest yearly delay in hours per commuter of all the case-study cities; both of these indicators reflect the size of the Cedar Rapids urban area relative to other cities described in this chapter.
SUMMARY OBSERVATIONS
The most significant message for urban sustainability to come from this analysis of Cedar Rapids is the importance of the current status and setting of a city. It has a highly educated and affluent population without the extremes of income and wealth inequality that exist in cities like New York and Los Angeles. Cedar Rapids has a relatively benign climate and will be less affected by climate change than other cities because it is not vulnerable to sea-level rise and intense storms that originate in the oceans (hurricanes, west coast storms). There is a net
TABLE 4-16 Example Highlighting Actions for Cedar Rapids that Illustrate Steps in Urban Sustainability Roadmap (see Chapter 3, Figure 3-1)
| City | Cedar Rapids |
|---|---|
| Adopt Principles | P1, P2, P3, P4 |
| Opportunities and Constraints | Opportunities: Cedar Rapids is a producer city that produces agricultural products that are not dependent on discretionary spending. Climate impacts will be relatively benign. Highly educated workforce. Constraints: Agriculture will have to adapt to 21st-century megatrends but it has a clear preindustrial model. |
| Prioritize Co-net Benefits | Cedar Rapids scores relatively high on most metrics of sustainability. The focus for sustainability is on community, growth, environmental stewardship, affordability, and innovation. |
| Partnerships | The community was engaged in developing the iGreenCR report. |
| Goals | Sustainability is built around five principles: community, growth, environmental stewardship, affordability, and innovation. |
| Strategies | iGreenCR Team report. |
| Data Gaps | As yet, there are few specific plans for meeting the energy needs of the city from renewables. |
| Implementation | Plans for implementations include biking and mass transit; energy efficiency; a focus on environmental amenities such as parks, gardens, and urban and nearby water bodies; urban forestry; efficient use of water; and attention to place and history. Energy efficiency initiatives include tracking of reduced greenhouse gas emissions. |
| Local to Global | Cedar Rapids will be subject to the same national laws and regulations that impact all cities. The main connection of the city to national and global levels is the enormous food production that flows to national and global markets. |
| Public Buy-in | The public has been involved in the development of sustainability plans for the city. |
| Feedback | As yet, there are no specific metrics for meeting the energy needs of the city from renewables and for achieving sustainability goals. |
precipitation surplus, and the city is on a permanently flowing river. Cedar Rapids will experience droughts from time to time, but sporadic flooding is the hazard more likely to occur. The relatively small size of the city means that it does not have the huge demands for energy and materials of mega-cities like New York and Los Angeles. The city is in an area of low regional population density with some of the richest soils in the world. As a locus of the food-processing industry, Cedar Rapids’ economy is based on a nondiscretionary commodity—food—which provides economic stability. Furthermore, if needed, food could be supplied to the city’s population from an area within about 20 miles from the city if agricultural production were more diversified.
Cedar Rapids’ focus on community, growth, environmental stewardship, affordability, and innovation builds on a strong base that will make long-term sustainability easier to attain than most of the other cities considered in this report. These conclusions are supported by the Industrial Cities Initiative published by the Federal Reserve Bank of Chicago (Engel and Longworth, 2012). They classified Cedar Rapids, along with Grand Rapids, as resurgent cities. These are cities that have relatively smaller declines in manufacturing employment with relatively larger increases in well-being.
FLINT
Flint, Michigan, is an example of a postindustrial, depopulating city that is common across the Northeast and Midwest in an area that is termed the “Rust Belt.” Its depressed economy and high poverty rate are substantial challenges to meeting its sustainability goals. However, its geographic location provides it with assets, such as insulation from the effects of climate change and fertile farmland, that could be used to improve its sustainability (Figure 4-21).
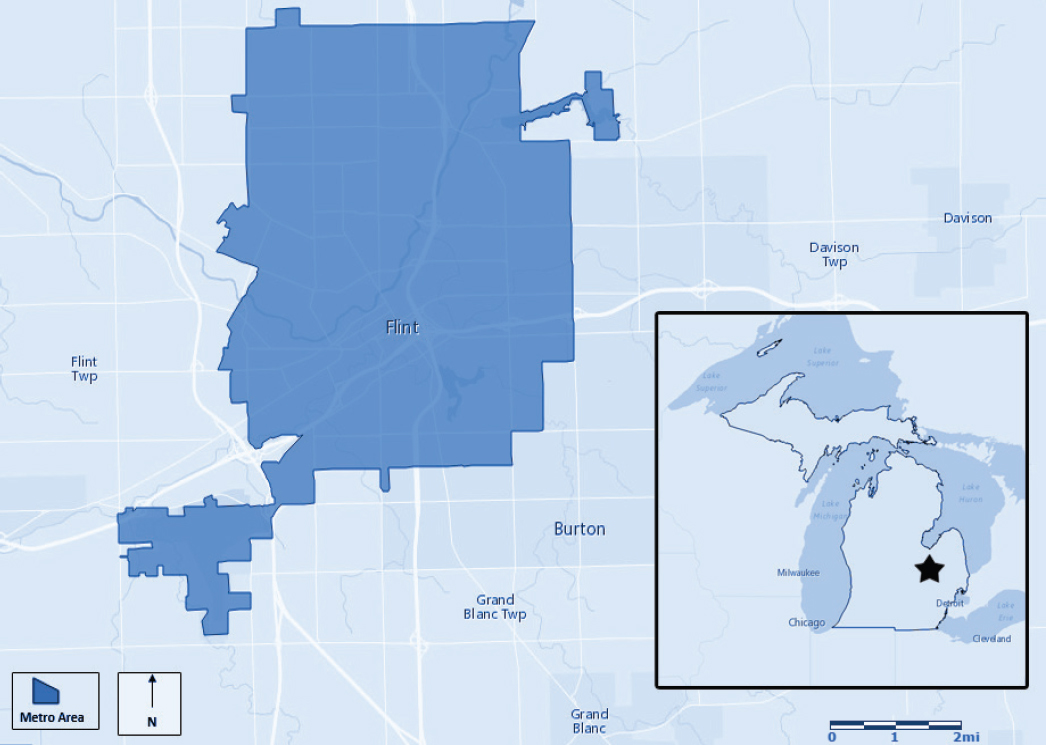
BACKGROUND
Flint was founded in 1819 as an outpost for fur trading with the local Ojibwa tribes. The town was also a stopover on the land route between Detroit and Saginaw. The village was incorporated in 1855. Flint and other towns in southern Michigan, such as Detroit, were originally prosperous agricultural communities based on the rich soils of the area. In the second half of the 19th century, exploitation of extensive old-growth forests of the region caused the lumber industry to grow in Flint, which in turn resulted in the development of a carriage-making industry. When horse-drawn transport gave way to vehicles powered by the internal combustion engine, Flint emerged as one of the most important locations for the growing auto industry. It was the birthplace of General Motors, and the founding of the United Auto Workers union grew out of the Flint Sit-Down Strike in 1936. During World War II, the city prospered as tanks and other war machines were manufactured. Up until the mid-20th century, Flint’s prosperity paralleled the explosive growth of the auto industry as the United States transformed into an automobile-dominated society. Flint’s economy benefited from a regional supply base that included steel mills in Pennsylvania, coal mines in Kentucky and West Virginia, and iron ore from Minnesota (Day et al., 2016).
Flint’s fortunes reversed after the 1960s as a result of a number of major social and economic trends. Central to these was increasing prices of oil and the development of more fuel-efficient vehicles by the Japanese. The collapse of the U.S. auto industry and the general deindustrialization of the northeast and Midwest led to the dramatic loss of population and urban decay of the city. Employment by General Motors fell from about 80,000 in the late
TABLE 4-17 Key Characteristics for Flint
| Indicator | Flint | United States |
|---|---|---|
| ENV Average Annual Precipitation (inches/year) | 31.4 | 40.8 |
| ENV Existing Tree Canopy (% of land cover) | 13 | 25 |
| ENV Roadway Fatalities (per 100 million annual vehicle miles traveled) | 1.0 | 1.1 |
| ENV Particulate Matter 2.5 (ppm) | 12.2 | 11.9 |
| ENV Residential Carbon Footprint (metric tons of CO2 per capita from residential energy consumption) | not available | 3.4 |
| ECON Financial Health | no rating | AA+ |
| ECON Average Residential Electricity Rate (cents/kWh) | 13.7 | 11.9 |
| SOCIAL Black or African American | 20.6% | 13.2% |
| SOCIAL Hispanic or Latino | 3.2% | 17.4% |
| SOCIAL Asian | 1.1% | 5.4% |
| SOCIAL Home Ownership (2009-2013) | 70.3% | 64.9% |
| SOCIAL High School Graduate (25 or older, 2009-2013) | 89% | 86% |
| SOCIAL Below Poverty Level | 21.0% | 15.4% |
| SOCIAL Violent Crimes (per 100,000 people) | 854 | 191 |
NOTE: ENV, ECON, and SOCIAL refer to the three dimensions of sustainability: environmental, economic, and social, respectively. SOURCE: Appendix B.
1970s to less than 8,000 by 2010. Though Flint’s population had exploded between 1900 and 1960—growing from 13,000 to nearly 197,000—by 2010 the population had shrunk to 102,000 (Day et al., 2016).
The economic crisis led to a series of financial emergencies and political upheavals as the city continued to decline and resulted in the state of Michigan taking over much of the city government operations. Flint now stands as a city fundamentally changed from its heyday of the 1960s. Vacant land is common because properties in residential neighborhoods have been abandoned, and blighted housing is widespread. In 2002, the Genesee County Land Bank was founded by the county treasurer Dan Kildee. The purpose of the land bank was to take charge of dilapidated and abandoned properties, making the properties available for resale or demolition. In 2009, the land bank owned 14 percent of property parcels in the city, much of which is open space (Day et al., 2016).
MAJOR SUSTAINABILITY EFFORTS
A number of the trends taking place in Flint can be viewed as movement toward sustainability, given the emerging constraints. Some of these have not been cast in the context of sustainability, but still there are lessons to be learned.
There are active plans in both Flint and Detroit to develop urban agriculture on vacant land. “Urban farms” from a few acres to several hundred acres have sprung up in both cities with vegetables, fruit trees, chickens, and eggs (Day et al., 2016). Soils in the region of Flint are characterized as Alfisols, highly fertile soils mainly formed under forest cover (Schaetzl et al., 2012). Like Cedar Rapids, Flint could feed itself from within a radius of 20 miles surrounding the city. Thus, in the face of pervasive urban decay and collapse, Rust Belt cities may be able to go a long way toward feeding themselves. This is potentially important if industrial agriculture begins to falter because of high energy prices and climate change.
Flint, as well as Detroit and other similar cities, serve as examples of both the perils and possibilities of postindustrial cities in the Midwest and elsewhere. In many ways, Flint and similar cities are on the leading edge of change that will come to most urban areas as the megatrends of the 21st century sweep across the landscape.
The City of Flint has outlined its vision of the future in Imagine Flint—Master Plan for a Sustainable Flint (www.imagineflint.com). The plan states that “Flint is a city poised and ready for transformation.” It aims to transform Flint into a community that is economically, environmentally, and socially vibrant. It seeks to accomplish this objective by investing in the human capital of Flint’s residents, improving the efficiency of the city’s infrastructure, providing more support services to families, and empowering residents to improve their neighborhoods. The plan calls for civic engagement with the community, including with its youth, and says that decisions are to be based on active public participation.
The city hopes that Imagine Flint will result in walkable neighborhoods with green spaces and mixed-income housing; a diversified economy that encourages youth to stay in Flint and attracts new residents; and increased public safety and a reduction in crime and gun violence. The city’s carbon footprint should be lowered through improved mass transit, investment in energy-efficient buildings, and attention to natural systems in the Flint River watershed. The plan also calls for developing a local food system, which is feasible because Flint is surrounded by fertile land. There are already urban farms operating on many of Flint’s vacant lots, producing vegetables, fruit, eggs, and poultry meat. The vision of the program states in part: “Green, Sustainable, and Healthy are synonymous with Flint, as the City has fully embraced the notion of pioneering best practices in green industry and infrastructure, becoming a 21st Century Sustainable Community.” Imagine Flint addresses social equity and sustainability, reshaping the economy, quality of life, and adapting to change, youth, and civic life. It includes emphases on mixed neighborhoods and neighborhood centers, energy-efficient buildings, encouraging walking and bike use, mass transit, enhance natural systems through responsible planning and development (Flint River watershed, parks and open space), reducing the city’s carbon footprint, safe neighborhoods, reducing energy costs, strengthening education, reducing the number of residents with low skills, diversifying the economy, improving public safety and reducing crime, reducing gun violence, developing a local food system, expanding arts and cultural activities, and preparing a 5-year strategic plan (City of Flint, 2013).
OTHER SIGNIFICANT ACTIVITIES
Sustainability indicators for Flint are largely negative. Flint has higher particulate matter than the national average and poorer water quality. In addition and more recently, its water quality was of particular concern at the time this report was written. In order to save money, in April 2014, a temporary change in the source of the city’s water supply, from Detroit-routed Lake Huron water to the Flint River, led to the leaching of lead into the water supply from the highly corrosive Flint River. This was compounded by an aging local water distribution system with a high percentage of preexisting lead pipes and plumbing. Following resident complaints, significantly elevated water lead levels and child blood lead levels were found to constitute a Safe Drinking Water Act violation. This is especially concerning given the long-term negative consequences of even low-level lead exposure for children—biologically, educationally, and psychologically—that could disadvantage any city for generations (CDC, 2012; Edwards et al., 2015; Hanna-Attisha et al., 2016).
This water crisis resulting in high lead levels is one of the most important sustainability issues facing Flint and likely many other cities with aging infrastructure. The Office of Michigan Governor Rick Snyder’s Flint Water Advisory Task Force’s 2016 Final Report found: “The Flint water crisis is a story of government failure, intransigence, unpreparedness, delay, inaction, and environmental injustice” (Flint Water Advisory Task Force, 2016, p. 1). The Task Force’s finding, noting the role of “environmental injustice,” is also reflected in a varied and growing number of other literature sources—from the American Journal of Public Health and the New England Journal of Medicine to the United Nations and beyond. For example, Hanna-Attisha et al. (2016) note, “Greater Flint’s struggles have been amplified by a history of racial discrimination,” while Ryder (2016) states, “the [Flint] crisis highlights the extent to which disparate vulnerabilities to risk and disproportionate impacts of hazards can become issues of environmental injustice.” Similarly, a statement to the media by the United Nations Working Group of Experts on People of African Descent, on the conclusion of its official 2016 visit to the United States,
noted “communities are calling for environmental justice as they are concerned that they are disproportionately exposed to environmental hazards impacting their health and standard of living” (UN Working Group of Experts on People of African Descent, 2016).
Additionally, the crisis illustrates how the legacy of Flint’s governance problems, in the context of a city with very limited access to appropriate expertise, exacerbated the failure of government oversight to respond quickly to the water crisis (Rosner, 2016). Underprivileged communities have fewer resources to deal with infrastructure issues, and that impedes efforts toward urban sustainability (Flint Water Advisory Task Force, 2016). The confluence of environmental injustice and persistent governance deficiencies also compromised the deployment of engineering solutions in Flint. As Bellinger (2016) notes, “the corrosion-control treatments required by the Environmental Protection Agency’s Lead and Copper Rule were, for some reason, discontinued. To make matters worse, the addition of ferric chloride to reduce the formation of trihalomethanes from organic matter increased the corrosivity of the Flint River water.”24Scully (2016) also states, “when the City of Flint switched from Lake Huron to Flint River water, corrosion control with orthophosphate was discontinued despite the river’s greater known corrosivity.” Political, economic, and social conflicts are common for most of the cities treated in this report and across the nation. Neglecting these problems will impede sustainability efforts. All cities must realize the risks that they face by not prioritizing clean and reliable resources, and transparency of government actions (Konisky, 2016; UN, 2016a). There should have been close interaction among all levels of government rather than the finger pointing and attempts to assign blame. The central lesson here is that the health of city citizens is essential to sustainability as well as to the city’s ability to compete for residents, businesses, and federal monies.
Flint also has high unemployment, a high crime rate, and the lowest level of college-educated persons of the cities examined in this report. The percentage of the population below the poverty line is above the national average. The income inequality ratio for city residents is low, but that may be because of the overall depressed state of the city’s economy. Flint’s indicators for health are low, as are its scores for public transit use and walking, but it has higher than average total good days in terms of the air quality index, scoring 178 compared to 33 for Los Angeles. Despite a high level of licensed drivers per 1,000 driving age population, Flint has a low mean travel time to work and an average yearly commuting delay in terms of hours per commuter. (Flint scores 25 hours compared to 7 for Cedar Rapids and 85 for Los Angeles.) Thus, the sustainability indicators show mixed results for Flint. They are measures of a city in transition. As discussed below, this could be the beginnings of a transition to sustainability in ways that other cities have not begun.
SUMMARY OBSERVATIONS
Flint and similar cities are widely viewed as failed urban areas in comparison with the currently more successful cities of the east coast and elsewhere. However, there are a number of factors that have the potential to make Flint a sustainable city. Climate change will be relatively benign compared to many other U.S. cities. Flint is in an area that will not suffer extreme droughts as in much of the western United States or the effects of sea-level rise and storms in coastal areas. The relatively low population means that providing for the needs of the city is less challenging than for urban areas with 10 to 100 times the population. If it developed a diversified agricultural economy, Flint would be able to easily feed itself within its local foodshed because the city exists in an ecosystem with adequate water and rich soils.
Flint’s strong focus on the human capital element in the Imagine Flint program should help its population adjust to the changes of the 21st century. The plan’s emphasis on engaging youth and supporting families may help it achieve its goals of retaining residents, improving the quality of life in the community, and reducing crime and gun violence. If it is able to repurpose and redevelop vacant spaces and increase the skill of its workforce, Flint may become an example of a postindustrial city that has put itself on a pathway to sustainability.
The Industrial Cities Initiative published by the Federal Reserve Bank of Chicago (Engle and Longworth, 2012) classified Pontiac, Michigan, as an overwhelmed city. These are cities that have relatively larger declines in manufacturing employment and relatively larger decreases in measures of well-being. In many ways, Flint is
___________________
24 Also see Mann (2016).
like Pontiac in that it has suffered declines in manufacturing and population. How Flint and other similar “failing” cities manage the coming transition may provide examples for other cities that have not yet suffered as Flint has. A number of authors have looked at small to medium-sized cities as examples of a promising urban future. Catherine Tumber in her book Small, Gritty, and Green sees promise in smaller industrial cities in a resource-scarce future (Tumber, 2011). She writes about Rust Belt cities in the Northeast and Midwest (cities like Syracuse, Akron, Worcester, Buffalo, Peoria, and Youngstown), their deterioration, and growing invisibility as cities. But her book could just as well be about similar cities in other parts of the country. These cities, like many others, once had vibrant downtowns. But the forces of deindustrialization, outsourcing, and globalization led to loss of jobs, demographic changes, and poor school systems. These trends are expected to be reversed as the 21st century progresses because of emerging trends that include energy scarcity, climate change, food insecurity, and ecosystem degradation (Day et al., 2014). In terms of population, Tumber wrote about small cities in the range of 50,000 to 500,000 persons, which includes Flint (Tumber, 2011). Thus, Flint has potential to transition in sustainable directions, and a vision for such a transition has been partially articulated in the Imagine Flint program. Relatively benign climate impacts, a rich regional natural environment, and a low population will make achieving long-term sustainability less challenging than for much larger urban areas or cities in resource-poor regions such as arid areas.
TABLE 4-18 Example Highlighting Actions for Flint that Illustrate Steps in Urban Sustainability Roadmap (see Chapter 3, Figure 3-1)
| City | Flint |
|---|---|
| Adopt Principles | P1, P2, P3, P4 |
| Opportunities and Constraints | Opportunities: Urban farming on vacant land in the city, rich local food shed; climate change will be relatively benign. Constraints: Oil price rise in 1970 led to shifting of small car production to other area; deindustrializing Rust Belt city; high poverty and unemployment. |
| Prioritize Co-net Benefits | Sustainability indicators indicate both positive and negative aspects of city life in Flint. In terms of environmental indicators, Flint has higher than average particulate matter, poorer than average water quality, but has higher than average total good days in terms of the air quality index. Income inequality ratio is low. |
| Partnerships | The local community has been strongly involved in the development of the Imagine Flint plan; county land bank. |
| Goals | Social equity and sustainability, reshaping the economy, quality of life, adapting to change, youth, civic life. |
| Strategies | Imagine Flint (Master Plan for a Sustainable City). Flint has focused strongly on the human element in the Imagine Flint program. |
| Data Gaps | As yet, there are few specific plans for meeting the energy needs of the city from renewables. |
| Implementation | County land bank; urban agriculture on vacant land; open space and green neighborhoods. Mixed neighborhoods and neighborhood centers, energy efficient buildings, encourage walking and bike use, mass transit, enhance natural systems through responsible planning and development (Flint River watershed, parks, and open space), reduce the city’s carbon footprint, safe neighborhoods, reduce energy costs, strengthen education, reduce number of residents with low skills, diversify the economy, improve public safety and reduce crime, reduce gun violence, develop a local food system, expand arts and cultural activities, prepare a 5-year strategic plan. |
| Local to Global | Flint and similar cities may be a harbinger and example of how cities can survive through the 21st century. It has already begun a transition that many other cities will likely have to go through. An example of how small cities can adapt. |
| Public Buy-in | The public has been involved in the development of sustainability plans for the city. |
| Feedback | — |
SYNTHESIS
The sustainability actions undertaken in the metropolitan regions the committee selected exemplify, in specific urban contexts, the four urban sustainability principles and illustrate committee’s urban sustainability “roadmap” (see Figures S-1 and 3-1). The selected urban areas cover a broad spectrum of population size, population density, geographical location, availability of local resources, and historic conditions that play a key role in the sustainability challenges and opportunity solutions faced by each one of them. Nine cities were selected—Los Angeles, California; New York City, New York; Cedar Rapids, Iowa; Flint, Michigan; Pittsburgh, Pennsylvania; Grand Rapids, Michigan; Vancouver, Canada; Chattanooga, Tennessee; and Philadelphia, Pennsylvania—to represent a variety of urban regions, with consideration given to city size, proximity to coastal and other waterways, susceptibility to hazards, primary industry, water scarcity, energy intensity and reliability, vertical density, transportation systems, and social equity issues.
Each of the nine cities incorporates urban sustainability metrics and indicators through its approaches to unique and shared sustainability challenges. The set of indicators chosen by this committee is, in varying degrees and contexts, highlighted in most of the major sustainability efforts undertaken by each city, most visibly reflected in local climate, energy, and water plans.
The varied sustainability challenges, opportunities, and solutions experienced by each of these urban areas concretely illustrate the four guiding principles outlined in Chapter 3. Many challenges, most visibly those associated with resource use, capacity, degradation, energy, climate change impacts, and so forth, embody Principle 1, which states that the planet has biophysical limits. Moreover, sustainability challenges are, by nature, highly interconnected, spanning all three dimensions of sustainability, thus requiring interconnected, multifrontal solutions. All of the cities examined have developed comprehensive sustainability plans and initiatives that reflect their diverse urban contexts and challenges, thus delineating the core tenets of Principle 2: human and natural systems are tightly intertwined and come together in cities. In addition, many of these cities experience and continue to struggle with social issues of poverty and inequity, reflective of Principle 3: urban inequality undermines sustainability efforts. Furthermore, the numerous examples of associated challenges, solutions, similarities, their connectivity to their regions and broader geographic areas, and lessons both shared and unique to these cities and urban areas exemplify the principle that all cities are highly interconnected (Principle 4). Moreover, a summary table provided at the end of each of the nine city profiles links the city’s specific urban contexts to each step in the aforementioned urban sustainability “roadmap” (see Figures S-1 and 3-1).
The cities with the largest and most diverse populations, New York City and Los Angeles, demonstrated the longest history of implementing sustainability measures in the face of a large reliance on imported resources and big challenges in reducing social inequities and eradicating poverty. These challenges have driven both cities to develop aggressive sustainability plans, with specific targets and outcomes that rely on fruitful collaborations across municipal departments and institutions rather than top-down approaches. Though both cities have tried to heavily invest in public transportation infrastructure, the fundamental differences in the physical layout have driven the cities into distinctly different investment strategies: highways in Los Angeles versus trains and subways in New York. While both cities have made significant progress through a combination of regulation, technological advancement, cross-cutting collaboration, and aggressive policy changes, Los Angeles and New York face continual challenges in meeting their resource needs and the targets they have set for clean water, renewable energy resources, waste management, and GHG emissions reductions. For example, both cities rely on remote water sourcing strategies to supply water to their populations; however, New York City’s innovative ecosystem services–based strategy and land stewardship approach in the Catskills starkly contrasts the importation approach, and associated issues of water rights, used by Los Angeles in the Owens River Valley. Organizations within the cities and their regions, in many cases, have formed working groups among the responsible organizations to target these problems. However, neither one has fully factored into its sustainability plan the substantial impact that the demand of resources needed to run a large city has on the regions that supply those resources.
The city of Vancouver has seen a very unique progress in sustainability. In part an outcome of its location, history, and government, Vancouver has enjoyed a convergence of efforts and results over many years so that the Economist Intelligence Unit placed Vancouver among the top five “greenest cities” in its Green Cities Index. It has
also ranked Vancouver in the top three of its annual “Global Liveability Ranking” every year since 2010, among other similar distinctions. Vancouver’s Greenest City story provides useful lessons to other municipalities, both at the micro level (through its successful delivery) and at the macro level. It is a success story that is transferable across international borders. Though much has been accomplished, the City of Vancouver recognizes that there is much work still to do to be a truly sustainable city. In March 2015, the Vancouver Council upped the ante, unanimously passing a motion to be a city that runs completely on renewable energy by 2050, with the objective of reducing GHG emissions as well as dependence on imported energy.
While such progress is positive and exciting, it also brings reason for caution. Vancouver’s residents are challenged by the amount and rate of change that they have been asked to absorb in pursuit of the Greenest City Goals. While each individual change was made to support residents’ desire to live in a more sustainable city, the collective impact of all of these initiatives requires a significant amount of behavior change from residents and this has proved to be difficult for some. Other cities can learn from Vancouver’s experience by carefully monitoring residents’ response to change (both while planning and implementing green initiatives) and by course-correcting as needed.
Philadelphia and Pittsburgh are prime examples of cities that have aggressively pursued diversification of their economies, with variable success. They both pursued innovative collaborations with municipalities, nonprofits, and various public-private partnerships. Although both cities thoroughly capitalize on their economic assets, continued efforts are needed to further sustainable growth for the cities and their regions. In terms of barriers, there are many areas in which the cities would like to make a bigger impact, but their efforts are hindered by policies at the state and national levels.
Each of the smaller cities in population size and density—Chattanooga, Grand Rapids, Cedar Rapids, and Flint—has experienced a different path to sustainability and at present has succeeded differentially toward its intended goals. Among them, Chattanooga is an example of a city that had to work very hard to succeed. Its designation as the “dirtiest city in America” in 1969 became a catalyst for a sea of change. The air quality benchmarking by the EPA motivated the city to go beyond incremental improvements to dramatically turn itself around. Without such a “wake-up” call, it is not clear that Chattanooga would have become the hub of sustainable growth that it is today. Grand Rapids started on the path to sustainability later and is now developing a multifrontal approach to economic, social, and environmental resilience. Grand Rapids is fortunate to have abundant water access with the Grand River. While working on a number of sustainability fronts, the city wants to ensure that this important natural resource is available to future generations.
The most significant message for urban sustainability to come from this analysis of Cedar Rapids is the importance of the current status and setting of a city. It has a highly educated and affluent population without the extremes of income and wealth inequality that exist in cities like New York and Los Angeles. Cedar Rapids seems to have a strong work ethic and a high level of tolerance to adverse developments as well as a low level of crime compared to other cities, so public safety is an important element of sustainability. At the same time, the city is not as diverse as the large metropolitan areas, and it has a limited built-in resilience. The megatrends of the 21st century will pose challenges for all cities, but Cedar Rapids will have a less difficult time meeting these challenges than many other cities due to its unique economic, social, and environmental construct. The city of Cedar Rapids is a phenomenon difficult to reproduce in a world characterized by massive urbanization. However, in the longer term, as the megatrends of the 21st century roll over society, an important recommendation is that cities develop and enhance basic economic activities that are nondiscretionary such as food production and processing—activities that could boost economic growth and improve regional wealth, which are important characteristics of urban sustainability.
Flint is widely viewed as a failed urban area in comparison with the currently more successful cities of the East Coast and elsewhere. Flint has lost about half of its population since 1960. However, there is a considerable amount of green space within the city that could be devoted to urban agriculture. There is also abundant farmland with fertile soils in the part of the state north of Flint where population density is low, so Flint could feed itself largely from its local foodshed. How Flint and other similar “failing” cities manage the coming transition may provide examples for other cities that have not yet suffered as Flint has. While Flint cannot do much to affect climate change or the larger energy supply system, it can work with the local population to adjust to the changes of the 21st century.
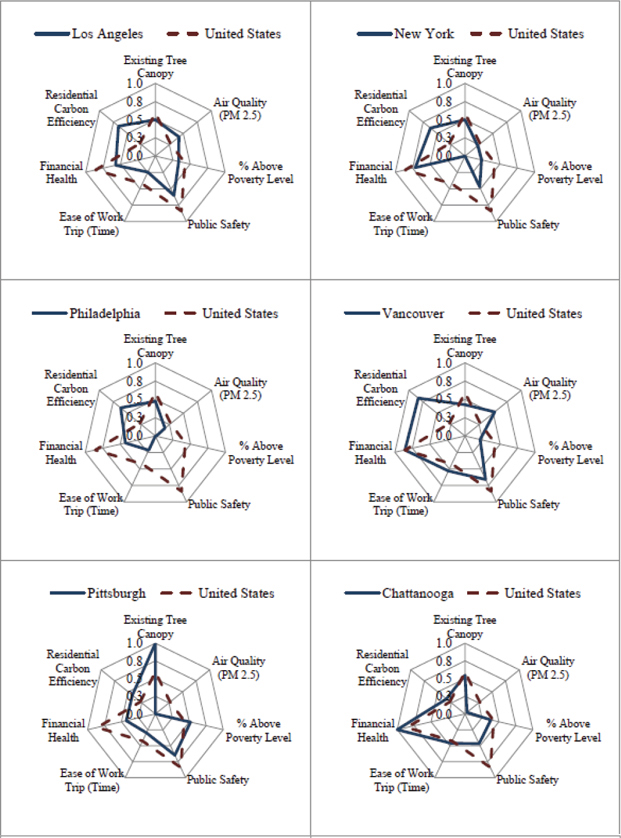
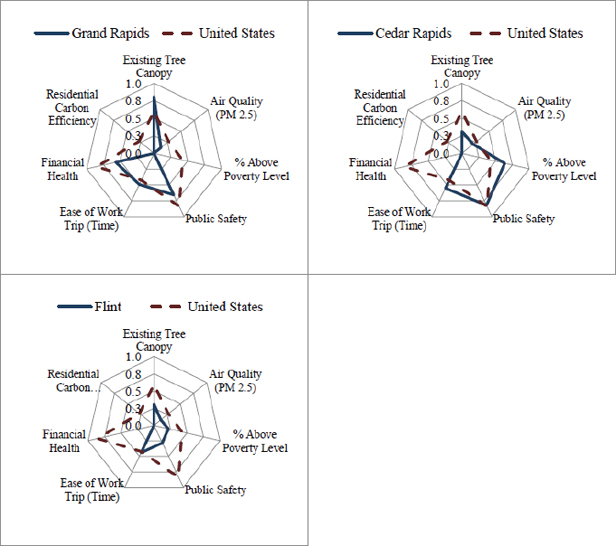
To provide a comparative snapshot of the nine cities assessed in the study, the spider charts (Figure 4-22) were created using the metrics data supplied in Tables 4-1, 4-3, 4-5, 4-7, 4-9, 4-11, 4-13, 4-15, and 4-17, with the convention being the larger the spider web, the more sustainable the city. These charts are not meant to provide a definitive determination as to whether a city qualifies as sustainable, but rather to provide an illustration as to how metropolitan areas varied as compared to the national average. In the event that a high value for a metric was contradictory to sustainability (e.g., high PM2.5, percentage below poverty, violent crime rate, average commute time to work, and residential carbon footprint), then the additive inverse was used for that value. For example, the value for percentage below poverty for Los Angeles is 17.8 percent, with the national average being 15.4 percent; since a high percentage below poverty value implies a negative correlation with sustainability, the calculated value for the chart is [1 − (17.8/15.4)] to obtain a measurement that would correspond positively to sustainability. Such measures were also renamed in the charts to reflect this positive correlation (air quality, % above poverty, public safety, ease of work trip, and residential carbon efficiency). For each of the seven metrics selected, the highest value across the cities and the United States was chosen as the maximum value in the range. Therefore, the values
of the cities were divided by the U.S. average to create the numbers shown on the chart. The result is an overall maximum value of 1.00 and a minimum value of 0.00; thus, the axis measurements of the spider charts range from 0.0 to 1.0 to best illustrate this range of values. Inasmuch as the spider charts below represent static snapshots, the report does not overly rely on statistical methods. A temporal analysis of urban sustainability trends might ultimately strengthen the findings herein, but given the committee’s resource and time constraints, this too must be subject to future inquiry and research.


