
Introduction
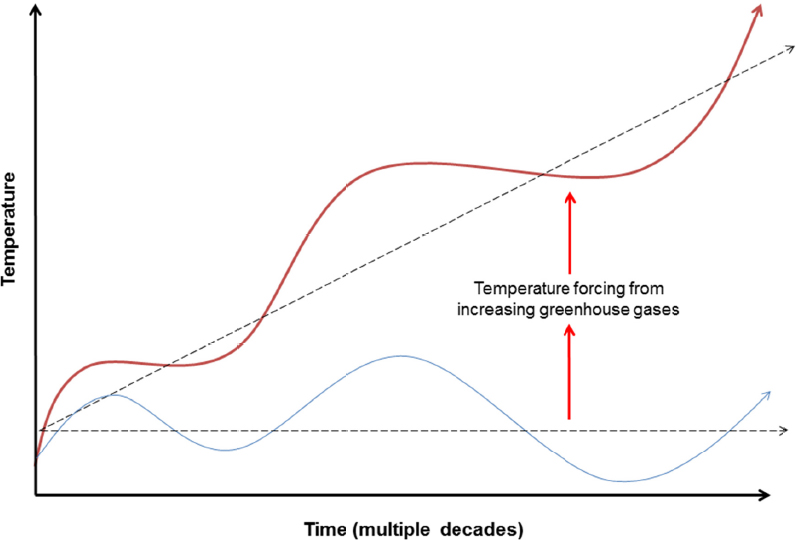
Studies of historic and paleoclimate data (e. g., NRC, 1998), as well as climate model simulations (e. g., Easterling and Wehner, 2009), demonstrate that Earth’s climate system exhibits natural variability at a wide range of timescales because of both internal and external factors (see Box 2). Decadal climate variability refers to variability of regional and global climate on timescales of 10 to 30 years. 1 Longer trends (50 years or more) in observed global mean surface temperature (GMST) in the recent century largely reflect increases in anthropogenic greenhouse gases (GHGs; e. g., Bindoff et al., 2013). Decadal variability can be described as the ups and downs of the climate, which are superimposed on that trend (see Figure 1). In this way, decadal variability can accelerate or decelerate the rate of warming on shorter timescales, whereas climate change is dominated by the steady warming from increasing GHGs over the long term.
The slowdown in the GMST warming trend during the early 2000s spurred a lot of research aimed at identifying variability in observations and models, as well as attributing its mechanisms. What physical mechanisms can explain recent as well as past decadal variability? How much of the variability in recent trends in surface warming is due to internal, natural variability versus external forcing, and how does this attribution vary as a function of timescale? Given what is known today about the controls on decadal variability, what can be said about the future? Are such accelerations and slowdowns predictable? What observations, data synthesis, and improvements in climate models might be needed to provide comprehensive answers to such questions? Finally, what is the best way to measure the influence of human-emitted GHGs on the global climate? Is GMST the best
___________________
1 Participants noted that while the timescale of decadal climate variability is approximately 10-30 years, the mechanisms and drivers of this variability occur at a variety of timescales, for example, ENSO (see Box 3).
metric? Regardless of the measure, what methods can best evaluate inflections in the rate of climate change?
The importance of answering these and related questions extends beyond explaining the recent slowdown in surface warming: The ability to anticipate, and eventually predict, such changes is important to decision-making. Planners and policy makers want information about decadal variability to make decisions in a range of sectors, including for infrastructure, water resources, agriculture, and energy. Furthermore, like the well-studied El Niño and La Niña interannual variations, decadal climate variability is associated with specific regional patterns of temperature and precipitation, such as heat waves, cold spells, and droughts. For example, some of the same mechanisms responsible for the recent warming slowdown may have played a role in the extended drought in the U. S. western states (e. g., Delworth et al., 2015). Clarifying the processes behind the recent slowdown in GMST rise can improve understanding and prediction of regional climate, which in turn can inform decisions that affect our society (e. g., Murphy et al., 2010).
In September 2015, the Board on Atmospheric Sciences and Climate and the Ocean Studies Board of the National Academies of Sciences, Engineering, and Medicine convened
a workshop to examine these questions (see Statement of Task in Appendix A). The workshop included a number of panels followed by open discussions, as well as breakout groups focused on specific modeling and observational challenges, and concluded with reflections on the workshop’s key messages and lessons on communicating these messages (see workshop agenda in Appendix B).


