
2
Characterizing and Communicating Risk
The many complexities of characterizing climate change and communicating clearly about it to diverse audiences were the focus of the first workshop panel. Six presenters provided their perspectives and discussed the implications of their ideas for the fourth National Climate Assessment (NCA4).
CONSEQUENCES OF RISK: A POLICY PERSPECTIVE
Alice Hill of the National Security Council (NSC) opened with a memory of hearing anthropologist Margaret Mead warn during the 1970s of society’s carelessness about the environment and the catastrophic results she already foresaw. Despite the body of scientific evidence that has been built in the decades since, Hill observed, “we are not adequately conveying” that the changes that have already taken place are irreversible and that “decisions being made today will really tie the hands of those who come after us.” Many policy makers take the issue very seriously, but they face considerable challenges in making the case for taking action, she pointed out.
She spoke in stark terms about the NSC’s recognition that climate change is an “urgent and growing threat to homeland security” and mentioned initiatives it has undertaken, such as a flood-management risk standard and a drought resilience strategy. The federal government is also beginning to screen all international development work for its resilience with respect to climate
change impacts. She noted that the National Security Strategy1 also identifies climate change as one of the top risks to the nation, along with weapons of mass destruction, epidemics, and terror attacks.
These efforts are “hard work,” Hill commented, because the risks are not widely understood. Her experience speaking with groups—including civil engineers, risk management specialists, infrastructure owners and operators, and policy makers—has shown her that very few have read the previous climate assessments. “This means we are missing the mark,” she said. Many people do not see how events and systems at the global, national, and local levels all fit together, she noted, but these connections demonstrate why climate change is relevant to their responsibilities. In her view, the NCA4 is an opportunity to provide information that is as useful to a local policy maker—such as the mayor of a small coastal town who needs to make decisions about spending, planning, and infrastructure—as to a leader making decisions at the national or international level.
Hill identified a few issues to illustrate her point:
- Approximately $96 billion was spent on infrastructure in 2014, but it is not likely that most of the individual investments were screened for climate change resilience.
- Coastal assets have an immediate vulnerability to flooding associated with sea-level rise, as the effects of Hurricane Sandy on parts of the Atlantic coast demonstrated in 2012. Some of the infrastructure affected had been built to withstand a 12-foot storm surge, she noted, but the surges in that storm were higher. Infrastructure failures from the immediate surges had cascading effects on essential sectors, including energy, transportation, and health.
- The Earth is already experiencing increased average temperatures, but the implications of high ambient temperatures for human activity are not fully understood.
- In one case, warming water temperatures have caused the shutdown of a nuclear plant that had relied on lower-temperature water for its cooling towers.
- The Mississippi River, an essential waterway, has in recent years both flooded and had water flow that was too low for barge traffic.
- Internal migration resulting from catastrophic events is already significant and will increase. For example, 237,000 people left New Orleans and other parts of Louisiana after Hurricane Katrina in 2005, which meant an estimated $105 billion loss for the state.
___________________
1 The executive branch of the federal government periodically provides to Congress a summary of national security concerns and strategies for addressing them. See https://www.whitehouse.gov/sites/default/files/docs/2015_national_security_strategy.pdf [May 2016].
Although it is difficult to tie any particular event to climate change, trends can be linked to climate change and it is important to help people understand that the impacts people are experiencing are not isolated events, Hill emphasized. “Impacts in the rest of the world affect us, too,” she added. Drought and extreme heat have already caused migration and strained resources. The rise of the terrorist group Boko Haram has been linked to water shortages in western Africa, she noted. Around the world, 100 million people live less than 1 meter above sea level. The U.S. Government Accountability Office lists climate change as a top risk to U.S. assets and to environmental and economic systems.
In short, Hill concluded, it is essential that the NCA4 deliver very clearly the message that changes in the Earth’s climate are virtually irreversible in the absence of engineering solutions that do not currently exist, and some will occur even if greenhouse gas emissions are cut entirely today. Despite the fact that the scientific community cannot predict exactly what will happen, she stressed, “we need to talk more about the worst-case scenarios” and make climate forecasts a routine factor in policy decision making.
Participants offered questions and comments that reinforced Hill’s messages. One asked whether federal agencies and other government entities have sufficient incentives to work together and with the broader community to deal directly with the policy implications of climate change. Hill answered that progress is iterative. Most policy makers have almost no formal education about climate change, she noted, and they represent a wide range of understanding. If the NCA4 clearly conveys what is at stake, she said, it can spur those who are not yet inspired.
Another noted that infrastructure planning and engineering models are generally designed to withstand the range of extremes in the 100-year historical record, but that using the past 100-year record will no longer provide an adequate basis for planning and design.
There are very few areas of science where it is possible to accurately depict the cascading effects, another noted. Collaborations among engineers, health officials, and others to assess the scenarios that might happen in their sectors can help people move beyond the “scare-mongering” label that can be used to undermine messages about the effects of climate change. Some government agencies may be better structured to operate at local levels than others, a participant noted, and many need guidance on how to do it. The White House has sponsored such exercises, Hill noted, and the United States Climate Resilience Toolkit has been developed for this purpose.2
___________________
2 See https://toolkit.climate.gov/ [May 2016].
HOW LIKELY ARE SIGNIFICANT CONSEQUENCES?
Ben Sanderson of the National Center for Atmospheric Research addressed two questions: “What are the odds we are missing something really catastrophic? And how can science better quantify those odds?” Climate research institutions around the world make decisions about what questions to pursue and how to use computer resources, Sanderson noted, and those decisions influence the potential for assessing risk. Better understanding of the likelihood that extreme outcomes will happen is essential in his view, and he suggested modifications in the types of experiments climate scientists do that could provide a more detailed and realistic picture of such risks.
Climate forecasts are based on computer models that represent the many interacting physical processes that affect climate. Climate models are designed to use physical principles, constrained by past data on the Earth’s systems, to produce simulations of future outcomes. They make it possible to test hypotheses about what might happen under varying sets of assumptions regarding specific variables, but the calculations must be “run” multiple times with different inputs (initial conditions and uncertain model parameters) to establish the range of possible outcomes. Thus, climate models can reflect the varying degrees of probability for links in the chain of events that could lead to possible outcomes, but only if they are based on an appropriate experimental design.
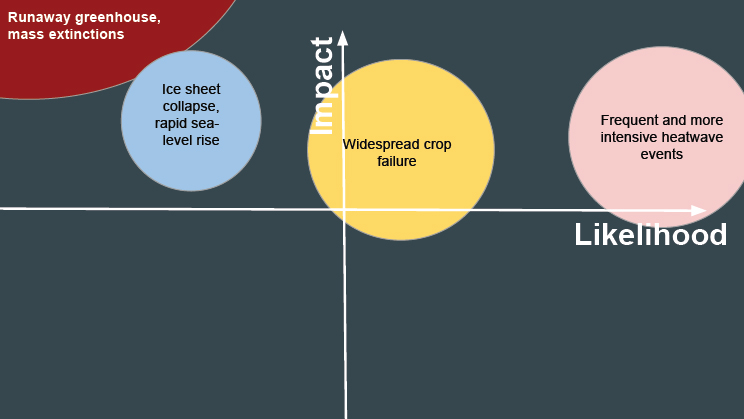
Risk is often described in terms of where outcomes might fall on two axes, one for impact and one for likelihood, as shown in Figure 2-1, Sanderson
SOURCE: Sanderson (2016).
SOURCE: Sanderson (2016).
explained. This figure illustrates that available climate models indicate different degrees of impact and likelihood for different outcomes. For example, frequent and more intense heat waves are an almost certain feature of future climate. Widespread crop failure or ice sheet collapse “can certainly not be ruled out,” Sanderson noted, but they are subject to greater model uncertainty.
He noted that multiple models contribute to confidence in the forecast for increasing heat waves. With respect to the likelihood of ice sheet collapse, however, the data on relevant factors (such as the stability of the ice sheets) are less complete. The partial circle in the upper left-hand corner of Figure 2-1 represents climate change feedbacks that would have major effects on a global scale, namely, extremely high greenhouse gas concentrations and mass extinctions. Scientists know little about these feedbacks because the relevant processes are not well represented in the models, which in turn is partly because there is a lack of data on what would be essentially unprecedented effects.
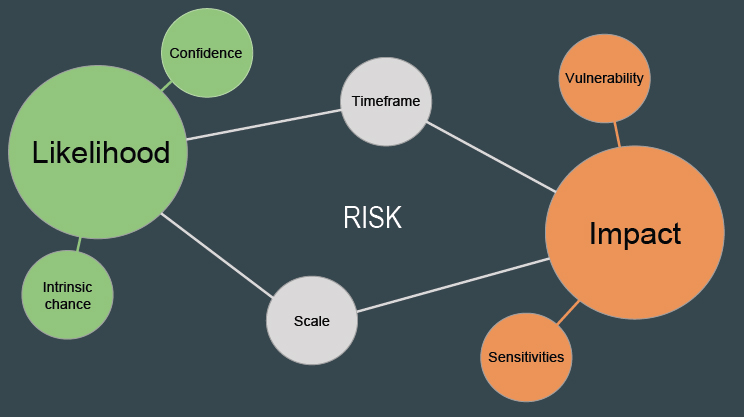
The concept of likelihood can be represented in a more sophisticated way, Sanderson said. Figure 2-2 depicts some other factors that need to be considered. With respect to likelihood, he explained, it is important to distinguish the intrinsic possibility that an event might occur from the confidence with which predictions can be made about it. The diagram also treats risk separately, indicating that it is a product of both the timeframe on which the outcome may occur and the scale of its possible impact (e.g., whether its impacts would be felt locally or on a national or a global scale). Impact itself, he added, is a function of both the vulnerabilities and sensitivity of the systems that may be affected.
Sanderson looked more closely at some specific types of outcomes to illustrate the additional analyses that will be needed to support efforts to prepare for possible risks, turning first to intense heat waves. He discussed the “cascade” of uncertainty, or model of the way in which uncertainty about each of the factors relevant to an outcome will accumulate, to elaborate on what can be said about this risk.
One factor that is uncertain is the choices that humans will make in the future with respect to the use of fossil fuels and other issues, which will determine the levels of greenhouse gas emissions over the coming century. Next in the chain is global climate sensitivity, the degree of increase in global mean temperature that will result from those emissions. Global-level changes affect different regions differently, and those responses introduce another level of uncertainty. There is also a fundamentally irreducible degree of variability in natural phenomena, such as weather, which introduces an additional degree of uncertainty.
Random variability may be the easiest type of uncertainty to account for, Sanderson suggested. If one begins with the assumption that a model is essentially a correct representation of the climate system, then running the model multiple times will eventually allow the range of random variability to become evident and yield a fairly accurate range of outcomes. Other types of uncertainties are more challenging, however. Different models will suggest different responses for particular regions, for example. Climate scientists address this uncertainty using general circulation climate models, a particular type of climate model that calculates atmospheric circulation to represent the behavior of the climate. Researchers look for agreement among such models to assess how likely an outcome is.
However, Sanderson suggested, some of the model agreement may not be as informative as might be hoped. Approximately 40 institutions around the world produce these models, he explained, but many of their models are based on the same design so there are actually far fewer than 40 distinct models. “There is massive overlap,” he suggested. It is not difficult to identify cases where two models share significant portions of code and thus can be expected to produce similar outcomes, Sanderson added, so it is possible to eliminate duplicative results from an analysis.
It is also important to realize, Sanderson added, that each group of scientists who run climate models tends, for defensible reasons, to publish a single central estimate, a version of the runs they have produced that minimizes biases and is in their judgment the best simulation they can provide. However, he explained, because each climate center does this, the set of models they collectively produce does not adequately address the “tails” of the distributions, particularly the outcomes that would have the greatest impact on human life. This means, Sanderson suggested, that “we have very little information about a world with high climate sensitivity, even though we cannot confidently rule
out such a world.” In other words, the existing projections are not adequately bringing the most extreme possible outcomes of climate change to people’s attention.
The way to gain more information about extreme scenarios, in Sanderson’s view, is to run a model repeatedly and explicitly examine the parameters that contribute to uncertainty, particularly at the tail ends of the distribution. Doing this requires significant computing power and time and is not routinely done, he said. Instead, for many climate centers, the focus is on developing very high-resolution models. However, he observed, these higher-resolution models do not in general yield a more accurate simulation, but rather more detailed pictures of the same information.
These sorts of questions about current modeling practices, Sanderson observed, lead one to wonder about the possibility that “we are underestimating long-term warming.” He offered four suggestions for using climate modeling to more directly explore the most extreme possibilities:
- Run simulations for longer time spans. The majority of current models are run on a 100-year timescale. Even current models will show different outcomes for a 300-year timescale than for a 100-year one. For example, by the end of the second century from now, the ability of the ocean to absorb carbon will decrease markedly. “This is not a complex feedback,” Sanderson noted, “but it means that the Earth’s sensitivity changes as you move into the future.”
- Incorporate critical carbon cycle feedbacks into current models. Methane release from permafrost, for example, is not routinely simulated in most models, but this development could increase global sensitivity by as much as 20 or 30 percent.
- Sample the parameters that contribute to the uncertainty of models of the tails of the distributions. In order to gain more precise pictures of extreme scenarios, it is necessary for the models to be run with different plausible combinations of uncertain parameters. This procedure makes it possible to determine in a single model how robust future projections are.
- Do not present climate sensitivity as a single number. Many people assume that when carbon dioxide is doubled, from any starting point, the increase in temperature will correspond in a linear fashion. Various lines of evidence suggest this is not the case, Sanderson argued. The climate is continually evolving, so simplistic, linear projections are incorrect.
Sanderson closed with the conclusion that in order to get a clear picture of the highest risks, “we need to change the types of experiments we are doing.”
Participants asked several follow-up questions. One noted the pressure to
provide information based on downscaling (a statistical procedure for applying information that is available on a large, e.g., global, scale to make projections for local regions) in order to give people more relevant information about the risks they may face. Downscaling introduces more uncertainties, Sanderson responded. Another noted that incorporating additional parameters into models will be difficult in some cases because adequate data are not available; for example, physics data regarding the behavior of ice sheets are incomplete.
ADDRESSING UNCERTAINTY IN CLIMATE CHANGE ASSESSMENTS
Robert Kopp of Rutgers University described two examples of ways to quantitatively address uncertainties in climate change assessments. One is an econometric analysis of economic risks that uses a framework for producing probability distributions.3 In the other example, probabilistic sea-level estimates are generated and applied to decisions affected by coastal flood risks.4 Kopp also discussed the idea of “tipping points” or thresholds in assessing the physical and social systems affected by climate change.
In the first example, Kopp and his colleagues combined econometric approaches to assessing relationships between humans and physical climate using probability distributions for local climate changes. They focused on sectors for which a large body of empirical data exists: agricultural production, health, labor productivity, energy demand, coastal buildings and infrastructure, and crime and civil conflict. They considered key sources of uncertainty, such as emissions, global temperature response, regional changes, socioeconomic responses, and structural uncertainty (i.e., omitted factors or tipping points).
To assess uncertainty in the relationship between emissions and global temperature, they used a simple climate model. To assess uncertainty in regional changes, they developed a framework that used that climate model to develop weights applied to a mixture of global climate models and “model surrogates” that captured tails of climate responses that are not represented in full-complexity climate models.
The researchers used statistical analysis of historical data on local responses to short- and medium-term climatic variability and change. Their objective was to control for the factors that make localities different, in order to isolate what was common in their economic responses to temperature changes. They are developing an open platform to make this procedure widely available: the Distributed Meta-Analysis System5 is a tool for conducting meta-analyses of climate impact and comparing and aggregating the results. They have used
___________________
3 This work is described in Houser et al. (2015) and Rasmussen et al. (in press).
4 This work is described in Kopp et al. (2014).
5 See http://dmas.berkeley.edu/ [May 2016].
this tool to develop probabilistic risk projections based on the assumption that people respond economically to changes in climate as they have in the past, Kopp said.
For example, the models indicate that climate change will have unevenly distributed economic impacts, Kopp noted. Figure 2-3 shows some projections produced by this model for the years 2080 through 2099. Labor productivity is projected to decline almost everywhere in the United States, while violent crime rates will increase, the models show. However, changes in mortality rates and crop yields will be mixed, increasing in some areas and decreasing in others.
Figure 2-4 shows another set of projections produced by the models. This graph depicts the expected increase in the number of years in which extreme heat events will occur, under four different greenhouse gas scenarios. The projections use historical data and calculations of year-to-year variability to show what is likely to happen, depending on the volume of greenhouse gases emitted going forward.
Kopp also summarized an example presented in a second study, in which he and colleagues described a way that local stakeholders can use uncertain projections to support decision making. Kopp and his colleagues combined a variety of evidence—including climate models, physical models of local effects, expert assessments, data on land water storage (water stored in the ground), and historical trend data—to develop probabilistic local sea-level predictions. Kopp noted that users of the projection framework have included the Congressional Budget Office, the state of Delaware, the California Energy Commission, the city of Boston, the New Jersey Climate Adaptation Alliance, and the National Oceanic and Atmospheric Administration.
Kopp said, however, that using these projections to make specific local decisions requires another level of analysis. Decision makers need to consider what responsibilities are potentially affected, the level of acceptable risk in that context, the range of time for which they will plan, and to determine what margin to build in to maintain a constant level of risk. Figure 2-5 shows, for example, that as the projected sea-level rise increases (the x-axis), the expected increase in the frequency of floods of a particular height increases in a nonlinear fashion (the y-axis). The curves represent five different possible degrees of sea-level rise: floods at this location will become three times as likely with the lowest possible sea-level rise and as much as 410 times as likely under the highest projected sea-level rise.
Kopp also noted that it is important to consider risks whose probability may be difficult to assess, because “they may in the end prove to be the most important.” The term “tipping point,” popularized in a 2000 book of that name by Malcolm Gladwell, generally refers to large changes that result from small changes, are contagious, and occur quickly. The term is often applied to climate
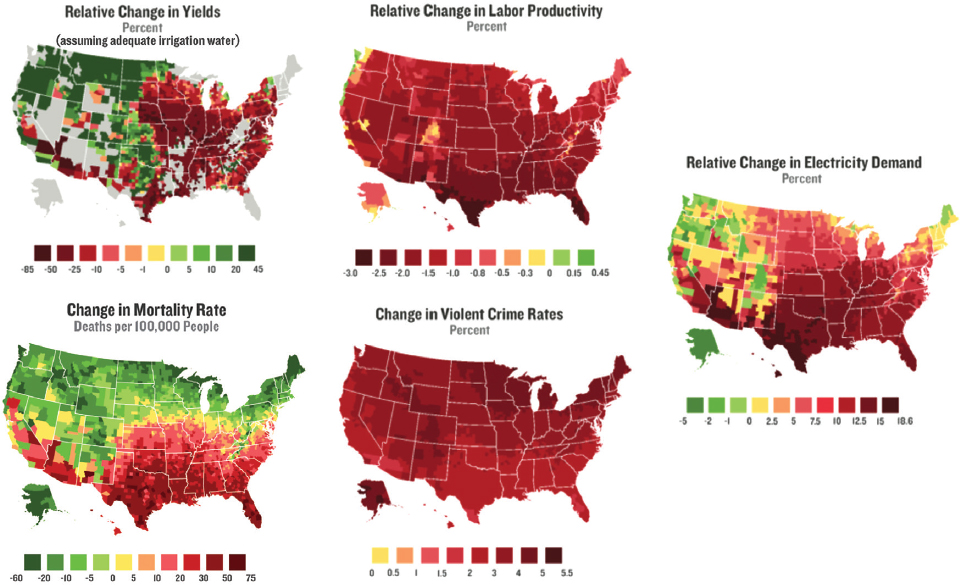
SOURCE: Houser et al. (2015, Figs. 6.4, 7.5, 8.3, 9.5, and 10.3). These figures are adapted from American Climate Prospectus maps prepared by Climate Prospectus (http://climateprospectus.org/ [August 2016] and reprinted subject to Creative Commons License CC BY-NC 4.0 (http://climateprospectus.org/data/ [August 2016]).
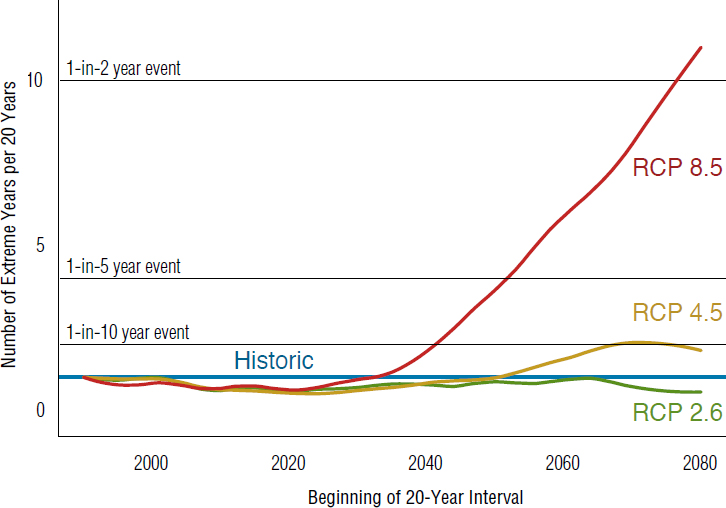
NOTES: A 1-in-20 year event assuming current population would result in 25,000 deaths. RCP stands for representative concentration pathways, which are distinct levels of greenhouse gas concentration in the atmosphere that could result in future differing levels of greenhouse gas emissions over time. These pathways are used in climate change modeling.
SOURCE: Houser et al. (2015, Fig. 8.4). From Economic Risks of Climate Change: An American Prospectus, by Trevor Houser et al. Copyright © 2015 Columbia University Press. Reprinted with permission.
changes, Kopp noted, but he suggested some modifications to the idea for the climate context.6
There are potential tipping points in both physical and social systems, he pointed out. Physical “tipping elements” in a climate context, such as loss of permafrost or ice sheets or dieback of forests, operate on a very long timescale, he explained, in contrast to the much shorter times involved in social tipping points. There may be a long lag between the actions that commit the planet to a climatic change and the full realization of its consequences, making it difficult for people to understand the potentially dramatic consequences of actions they are taking. Thus, understanding how likely it is that the planet may cross a
___________________
6 See Kopp et al. (2016).
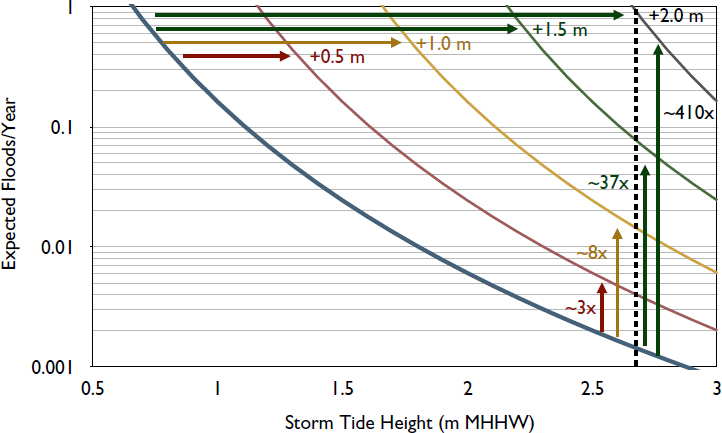
NOTES: Frequency increases labeled are for flood height in Hurricane Sandy. MHHW indicates mean higher high water, the average of the highest high tides per day over a period of time.
SOURCE: Kopp (2016).
critical physical threshold, as well as the potential consequences of doing so, is critical. Physical models can be used to determine the magnitude and timescale of physical changes that may occur, Kopp noted. Empirical models and process models for particular sectors can be used to assess how those physical changes may translate into economic costs.
In closing, Kopp emphasized that many of the consequences of climate tipping points may play out on timescales that are well beyond those typically considered in political and economic decisions—yet these decisions may have vital effects on civilization.
Participants added a few additional perspectives. One noted that the NCA4 will need to strike the optimal balance between “attempting to produce probability distribution functions for future states” and describing “the scenarios that are most risk-relevant.” Another noted her appreciation for Kopp’s discussion of cascading consequences but commented that “we are still stove-piping” by focusing on particular sectors. Analyses of risk in particular sectors may disguise the overall risk because it does not address cumulative, interacting effects. She also noted that interdisciplinary collaboration is needed to flesh out what particular risks mean. For example, economists’ discussions of the impact
of extreme heat do not typically reflect specific understanding of the physiological effects for humans of exposure to extreme heat.
FRAMING RISKS TO IMPROVE COMMUNICATION
The way in which information about climate change risks is framed is central to the way people understand the risks and the decisions they make. Robyn Wilson of the Ohio State University provided perspectives from research in decision and communication science that could help make the NCA4 more engaging and useful.
Some scientists can be uncomfortable with the idea of framing information, Wilson noted, because it might seem to counter the goal of being completely objective. However, any decision about how to present information is a frame, she noted, an “interpretive story line” that communicates why an issue is important to a particular audience and highlights the options or actions that should receive the most attention. A successful frame will pare down technical information so that is it accessible and persuasive to a nontechnical audience.
Researchers who have studied the framing of scientific issues, Wilson noted, have found that a different approach is needed for topics that are controversial than for those that are not. For issues generally accepted by policy makers, it makes sense to focus on highly technical, scientific, and legal information and language because there is no need to attempt to alter policy makers’ views. With climate change, however, which many policy makers do not accept as an important issue, effective framing would focus instead on moral considerations and the dramatic risks and costs the scientific information demonstrates. Leaders such as Pope Francis are in a position to address the moral considerations, but the NCA4 is ideal for addressing the risks and costs that can motivate people to act, Wilson noted.
Research also suggests that the risks that are most likely to motivate people are those that are psychologically near to them in space and time. This point highlights the importance of moving beyond abstract data that are not likely to affect people and localities soon. Public health threats, extreme weather events, and economic costs are some of the issues that people see as likely to affect them and their work. Translating the impacts of climate change into economic costs is useful, but many impacts cannot be translated into economic metrics, she added.
Applying these ideas to the NCA4, Wilson explained, suggests several points. While it is important to attempt to support decision making across scales, a single report cannot address every user effectively and provide comprehensive information about every issue. To her, two questions are (1) which risks should the NCA4 present—that is, how should the chapters be framed? and (2) how should those risks be presented—that is, how should the data be framed?
The chapters in the third NCA (NCA3), Wilson noted, varied in their approach because authors were given wide latitude to choose an approach. For the NCA4, she suggested, it is important that all the chapters be focused on decisions people need to make or problems they face and what science can offer to help them think through their options. Linking the science to potential impacts, values, alternatives, and tradeoffs will be most engaging to users. It will also be important to tie information about impacts to possible actions, she added, though scientists sometimes shy away from being prescriptive about how people should use the information they provide. It is possible to focus on the benefits of actions that municipalities, for example, have already taken, and to highlight the probability of particular outcomes, given action as compared with inaction, without making explicit recommendations, she pointed out.
Wilson also had suggestions for framing the data itself. The NCA3 established some guidance for authors, such as
- providing numerical, not just verbal, estimates;
- using standardized likelihood ranges;
- providing a confidence range for conclusions; and
- highlighting low-probability/high-consequence events.
For the NCA4, Wilson suggested, it might be useful to consider three additional practices:
- presenting expected changes in absolute, not relative, risk terms (e.g., instead of using the phrase “a 50 percent reduction,” describe the change as “a reduction from 10 to 5 percent”);
- using pictographs to show changes in risk, such as depicting the status quo as compared with ways risk might increase or decrease, depending on human action; and
- including different temporal frames, for example, noting both the risk that an event will happen in the course of a lifetime and the annual risk.
Wilson offered suggestions for implementing these ideas. In her view, the NCA4 should
Define chapters based on users the authors want to reach, focusing on decisions that members of that audience need to make and problems they face within their regions or sectors. She said the goal for each chapter should be to provide the information those users need most. Wilson has heard the critique that scientists are “very good at answering questions people don’t have,” so it is critical that the chapters not begin with what scientists think is most important or interesting, but on how science can meet the needs of the target audience.
Integrate explicit examples that will support decision making into each chapter, along with links to additional resources. These examples should demonstrate how available science was linked to a local problem and used to make effective decisions.
Require standard representations of the probability of particular impacts relative to some reference point. For example, a table for each chapter that summarizes key impacts and shows the probabilities of certain outcomes under different scenarios could help users put the information in each chapter into context, she suggested.
Provide a clear framework to help authors to frame their material. Wilson cited as an example a graphic used in the development of the chapter on coastlines in the NCA3 as one useful way to guide authors (see Figure 2-6).
Wilson closed with the suggestion that social and behavioral scientists be included as coauthors on chapters. The perspectives they would bring could be invaluable in helping the scientists frame their data.
Participants’ questions focused on challenges. One noted that developing tables that summarize probabilities, as Wilson suggested, would be very difficult since the evidence is rarely complete. Another noted that “scientists tend to write for each other” and to be both very precise about the robustness of
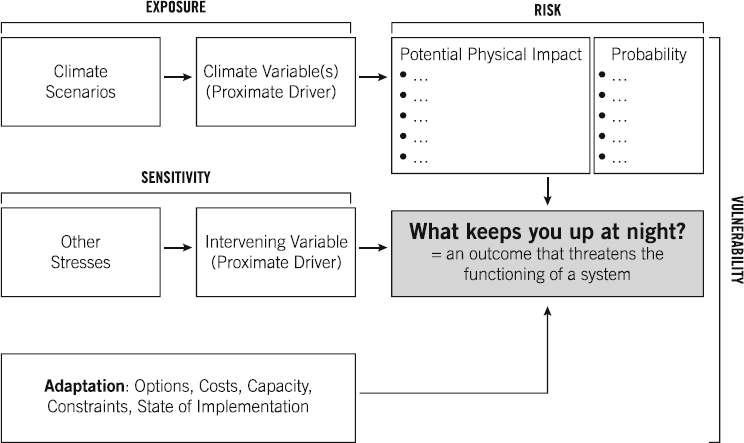
SOURCE: Moser and Davidson (2016, Fig. 2). The third National Climate Assessment’s coastal chapter: The making of an integrated assessment. Climatic Change, 135, 132. Reprinted with permission of Springer.
their evidence, as well as leery about communicating complex or inconclusive results. It would be a big challenge, a participant pointed out, to address this consistently across chapters because of the variation in the knowledge base across the topics.
The participants’ comments also included some suggestions. One was to be very explicit in guiding the authors not to write for their peers, but instead to focus on the information that local decision makers, such as ranchers or water or land managers, need. Another was to focus on case studies and on providing probabilities at scales where it is possible to do so. One participant suggested that users would actually be more interested in discussion of possible consequences than probabilities, as long as the NCA4 was clear about the sources of uncertainty. For example, one suggested, the electrical community is very interested in information about the possibility that the frequency of extreme events affecting the power grid, such as ice storms and lightning events, will increase. The existing science may not indicate probabilities but can be very helpful in helping people understand what they need to prepare for and the approximate timeframe. “Scientists need to become more comfortable with uncertainty,” that person noted.
CHARACTERIZING TRADEOFFS
Robin Gregory of Decision Research and the University of British Columbia provided some additional ideas from the field of decision research. He reviewed some primary reasons why making decisions about issues affected by climate change is challenging and offered strategies for addressing those challenges.
There are many reasons that policy choices related to climate change are difficult, Gregory pointed out. These decisions involve multiple stakeholders and interests as well as many technical experts, each of whom may view the problems and possible responses very differently. Many levels of decision makers (local, state, and national) can play a part, but it is not always easy for them to coordinate. Climate change decisions engage many dimensions of value, including economic and environmental interests as well as ethical and moral considerations. Yet people often have difficulty engaging in open dialogue about ethical and moral issues, and it can be difficult to distinguish facts from values and opinions, he said.
There are also many possible responses to any climate-related problem, Gregory noted, including attempts at both mitigation and adaptation, but the numerous alternatives can complicate and confuse the issue. In many cases, the probabilities of possible consequences to be averted are uncertain, and that can lead to a lack of trust in scientists and other experts. Many decisions interact with others and present multiple tradeoffs to consider, which can make it difficult to decide where to focus attention and effort. All of these complications
can lead to apathy, Gregory noted. He focused on several challenges the complexities of climate change present for which decision science offers guidance:
Articulating clear objectives for climate-related policies. People have difficulty identifying clear objectives when the available options are not familiar to them, Gregory noted, and that is often the case in climate-related policy discussions. Vague objectives are a poor basis for decisions so it is important to define precisely the values to be pursued through different policy alternatives using measures of their performance.
Unfortunately, there are no ready measures for many of the concerns and goals that people value, Gregory added. Social concerns such as community identity or family ties, psychological states such as anxiety or happiness, environmental concerns such as the health and resilience of an ecosystem or species, and cultural concerns such as for a sacred site or traditional practice—all may be very important to people though they cannot easily be quantified. One solution, Gregory suggested, is to identify objectives related to these concerns for which measures can be identified. For example, proxy or constructed measures related to physical or psychological health, economic opportunity, livability of a community, aesthetics, and the like, can represent some of the local knowledge, community values, and other intangibles that people value.
Defining the consequences of changes in climate. Predicting the specific consequences of climate change is challenging, and different people have different views of which potential consequences are important and why. Scientists may be frustrated because they provide good scientific data that are ignored by decision makers. Decision makers may be frustrated because they are asked to consider so many conflicting factors that no one is ever happy with their solutions. Structured techniques for making decisions can help, Gregory explained. These techniques might include using diagrams to explore means and ends or identifying priorities for different objectives using decision trees, profiles of risk tolerance, or surveys of what people value.
Thinking both slowly and quickly. Quick thinking, sometimes known as System 1 thinking,7 happens automatically and with little effort. It is based on associations, recent experiences, and simplified judgment rules. Deliberative thinking, or System 2 thinking, is slower and involves weighing and balancing different ideas and considering strategies or justifications for options. Tension between these types of thinking influences how both experts and nonexperts generate and evaluate alternatives. Thus, it is useful to make room for both in dialogues about climate policy choices, Gregory suggested. Intuitions and emotions associated with System 1 thinking can provide valuable insights into people’s priorities, he explained, but need to be combined with deliberation, analysis and reasoning, and other aspects of System 2 thinking.
___________________
7 See Kahneman (2011).
Making choices that relate to multiple values. Climate change policy choices may have impacts in very diverse areas of life. Thus, making optimal decisions may require considering economic, environmental, social, cultural, political, and other values, Gregory noted. People have difficulty making multiattribute choices that involve numerous values, he added. Asking group members to identify and compare their priorities is one strategy for helping them make choices. Another is to support them in analysis of the options in terms of the values that are most important to them. Table 2-1 shows a consequence table, one way to organize thinking about a situation in which there are multiple objectives and possible alternatives; the “alternatives” column is blank because the user generates the possibilities.
Grappling with scientific uncertainty. Uncertainty is a serious challenge, Gregory noted, which arose in almost every session of the workshop. The complexities of climate models and the results of studies are difficult to communicate in clear, simple terms. Scientists want to be clear about the degree of certainty of their projections, but more attention should be paid to how that uncertainty is framed, in Gregory’s view. Stakeholders who are not scientists can easily lose faith in science when the messages sound either overconfident or too murky to be the basis for action. There are varied methods for presenting probabilities, Gregory noted, and for communicating about adaptive management options. However, people tend to reinterpret information about uncertainties to align with what they already know or believe about the issue.
Integrating risks and benefits. Every climate change policy decision involves balancing risks and benefits, in Gregory’s view. Ideally, decision makers would be provided with clear information about the benefits, costs, and risks of possible actions. However, Gregory explained, research suggests that this is not so simple. People tend to have preferences and emotional responses
TABLE 2-1 Consequence Table for Climate Change Adaptation in a Rural Coastal Community
| Objective | Attribute | Measures | Alternatives |
|---|---|---|---|
| Minimize Management Costs | Cost | Dollars | |
| Maintain Environmental Health | Productivity of salmon | Biomass (kg.) | |
| Maintain Cultural Traditions | Continuity of ceremonies | Constructed scale 1-4 | |
| Improve Human Health | Number of doctor visits | Number of visits |
SOURCE: Gregory et al. (2016a).
that influence the way they perceive options. For example, one study has shown that people tend to rate technology toward which they are favorably disposed as more beneficial and less risky, but to do the opposite in thinking about technology they fear or dislike, as shown in Figure 2-7.
Tradeoffs that involve moral considerations are particularly difficult, Gregory added, and in his view conventional approaches to addressing them have not been effective. Large-scale opinion polls are often superficial, he believes. Town hall meetings often veer off topic, and it can be difficult to distill consensus messages from them. Interviews or small-group meetings involving key stakeholders necessarily involve very small numbers of people, he observed. Information presented in adversarial forums (including legal courts) is often biased or inaccurate. More promising are techniques for combining interviews and small-group discussions with large-scale surveys, deliberative polling, and surveys that allow decision makers to learn about participants’ decision pathways and reasoning.
A decision pathways approach, Gregory explained, allows participants to explore the links between scientific information and other values using a set of common-sense questions. This approach can be used to8
- situate the decision in its social and policy context;
- identify specific policy objectives;
- identify possible alternative actions;
- compare the benefits, costs, and risks of each alternative;
- reflect on key tradeoffs; and
- reconcile differences and summarize the results for policy makers.
If there are gaps in information, or participants who are misinformed about the science, tutorials can be used to address those issues so the process can proceed on the basis of a common understanding of the essential facts.
Gregory closed by emphasizing that there are many promising ideas for dealing with climate change, but policy makers and others are often impeded in implementing them because of confusion about choices that involve multiple dimensions of value. Nonexperts are often uncertain about the consequences of decisions and may lack trust in both scientists and government officials. They also may be frustrated that their concerns appear to be ignored by decision makers. Thus the aims of communication should be to guide people in better understanding both the scientific information and their own values and to help decision makers design policy alternatives that are responsive to stakeholders’ concerns. To do this, “we must learn to listen to what people are telling us
___________________
8 See Gregory et al. (2016b).
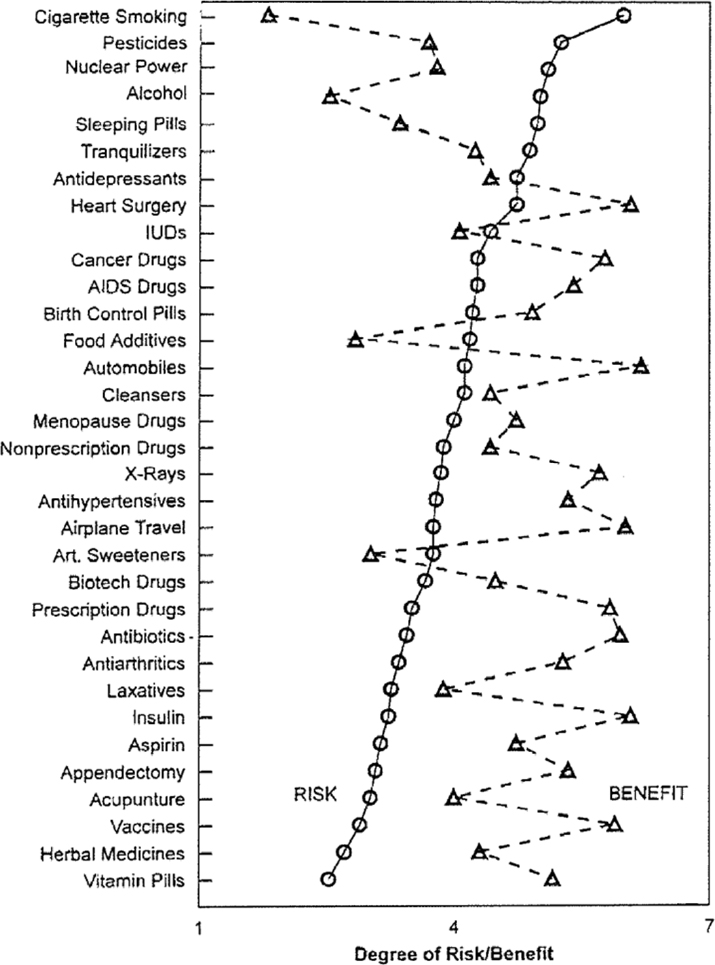
NOTE: Triangles and circles represent survey respondents’ perceived ratings of risks and benefits.
SOURCE: Slovic et al. (1991, Fig. 3). Reprinted with permission of the Canadian Public Health Association.
and establish an improved contract for deliberation: you talk, we listen,” he concluded.
A FRAMEWORK FOR DECISION MAKING UNDER UNCERTAINTY
The decisions that need to be made in the near term are critical building blocks for the broader, longer-term changes needed to fully address climate change, Inês Azevedo of Carnegie Mellon University explained. She described a strategy for making the kinds of decisions that can and should be made immediately to “start de-carbonizing the economy.” She listed several studies that illustrate how the climate science community can assess the potential benefits to health, the environment, and climate of different possible interventions in the U.S. energy system.9
Concern about climate and the environment raises countless challenging questions, Azevedo noted. “We know we need to increase reliance on renewable energy sources,” she noted, “but where can we get the largest benefits?” It is important to know whether it helps the environment more to increase reliance on solar power in California or in Pennsylvania, or whether an electric car brings more benefits than a hybrid does. In which parts of the country will actions such as introducing more stringent building codes, increasing the availability of solar and wind power, or providing more storage in the electrical grid have the most benefit?
What is important to realize, Azevedo noted, is that all of these questions are related. Any intervention in the energy system may reduce or increase emissions, so answering challenging questions is easier if potential benefits and costs can be monetized.
Energy services are responsible for the majority of carbon dioxide (CO2) emissions in the United States, she explained. The infrastructure for producing power in the United States is aging and very carbon-intensive. Different regions of the country rely on different mixes of energy sources and use energy in different ways, she added, and their emissions also vary significantly, as Figure 2-8 shows. That is one reason why the effects of interventions will be different in different locations. Another is that the monetized damage caused by criteria air pollutants10 varies, for example, from as little as $1,000 per ton of sulfur dioxide to as much as $15,000 per ton. Thus, potential benefits will depend on the type of fuel generation that would be displaced by an intervention and other factors. Furthermore, relying on average annual emissions data by region will not be adequate for accurately calculating costs and benefits, Azevedo
___________________
9Siler-Evans et al. (2012, 2013), Hittinger and Azevedo (2015), Tamayao et al. (2015), Gilbraith et al. (2014).
10 Criteria air pollutants are the six air pollutants that are most common in the United States: carbon monoxide, lead, nitrogen dioxide, ozone, particulate matter, and sulfur dioxide.
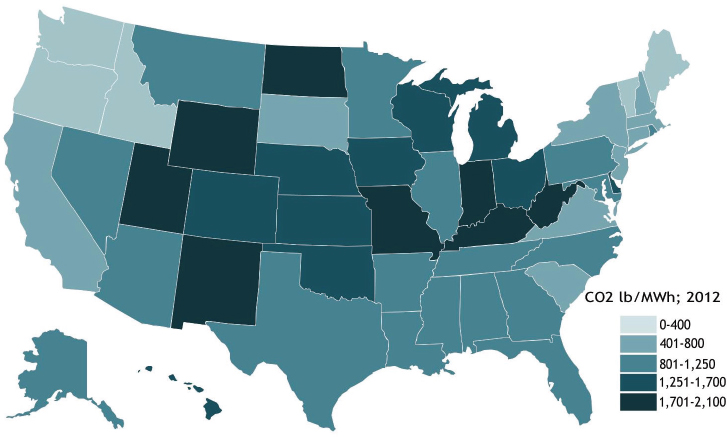
NOTE: Map shows emissions per megawatt-hour of power produced, adjusted for size of state.
SOURCE: Ceres (2014).
explained, because of the temporal variations in energy usage (by 24-hour cycle as well as season).
What is needed, Azevedo explained, is to analyze the following with respect to any possible intervention: the temporal profile (usage patterns across time), its match with the power generation it might displace, and the monetized value of that displacement. Azevedo and her colleagues conducted this analysis for five interventions: conversion to either wind or solar power, increasing the energy storage capacity in the electrical grid, increasing use of electrified vehicles, strengthening building codes, and making lighting strategies more efficient. They used hourly data on emissions of sulfur dioxide and nitrogen oxides for every power plant that uses fossil fuels, which is collected by the Environmental Protection Agency. With these data they were able to derive actual or simulated information about the effects of interventions on an hourly basis. They could estimate savings in CO2 emissions as well as additional benefits from reducing other pollutants and the monetized value of those reductions.
With this sort of information, Azevedo explained, they focused on three measures of performance for the interventions:
- energy production;
- climate benefits from reductions in carbon dioxide emissions; and
- health and environmental benefits from reductions in sulfur dioxide, nitrogen dioxide, and particulate matter.
Azevedo and her colleagues were able to characterize the environmental and health benefits of wind and solar power using hourly data for thousands of power plants across the country by estimating the amount and type of power that would be displaced and calculating the benefits of that displacement. As one might expect, Azevedo explained, the results for solar power show that the locations that can provide the largest electricity output using solar panels are not the ones that can benefit the most. That is, a solar panel in Ohio will produce about 30 percent less energy than a panel in Arizona but will provide 17 times more health and environmental benefits than the Arizona panel because it will displace electricity that would otherwise have been produced by burning coal. In many cases, the comparative analysis will be different depending on whether the top-priority outcome is health outcomes or other benefits, Azevedo noted.
The story is a bit different for wind power. In that case, the locations that provide the largest electricity output using wind power are the ones that can realize the greatest reductions in CO2 emissions, but not reductions in other air pollutants. This is because wind turbines located in the Midwest are most effective at displacing CO2 emissions because that region has excellent wind resources and also has relied heavily on coal-fired generators. Thus, for example, a wind turbine in West Virginia displaces 27 times more CO2 emissions than a turbine in California because of West Virginia’s heavy reliance on coal.
Azevedo briefly described how this type of analysis could be used to assess the impact on CO2 emissions of widespread conversion to battery-powered electric or hybrid vehicles. Variation in these vehicles’ designs is one complicating factor, she noted, so the researchers focused on the Nissan Leaf and the Toyota Prius. Effects on emissions also depend on where and when an electric car is charged, because the time of the day and the type of fuel that supplies the electricity must be considered. Here also, they found the results differed by region.
“A major transition in our energy system is needed,” Azevedo said in closing. Even the most immediate decisions will have long-lasting effects, so it will be critical to determine which strategies will provide the optimal results. To do that, she said, it will be important to consider both greenhouse gases and criteria air pollutants and to examine patterns in behavior and across time and location that will influence the effects of all interventions.
Participants’ comments focused on specific applications of this analysis. One pointed out that this type of analysis could help the authors of the NCA4 identify useful regional case studies to include. Another asked how Azevedo’s analysis might apply to interventions designed to reduce the grid’s reliance on fossil fuels, rather than adding renewable sources. Azevedo noted that she and
her colleagues had examined projections of power plant retirements currently under way and assumptions about the effects of those, but that additional modeling might be useful to better understand that type of policy intervention. Another wondered whether the analysis could integrate additional sources of complexity, such as the varied nature of the power grid in any one region and impacts that changes in climate will have in a particular region. For example, the participant noted that during droughts in California, limitations in hydro-power capacity can cause an increase in reliance on natural gas. Azevedo noted that the analysis is designed to identify optimal potential benefits across the country. California, which has already made significant moves toward use of renewables, will show lower incremental benefits, but that should be interpreted as a sign of progress the state has already made, she explained. She and her colleagues have worked to incorporate the complexity of the grids and other complexities into their model, she noted.


