
4
Technologies for Managing Flowback and Produced Waters for Potential Use
The second panel session of the workshop provided insights into technologies for managing flowback and produced waters for potential use. Three 10-minute presentations by the panelists were followed by a moderated discussion. The discussion was moderated by Linda Capuano, Baker Institute for Energy Studies (Rice University).
PANEL PRESENTATIONS
Technologies for Managing Flowback and Produced Waters for Potential Use
Tzahi Cath, Colorado School of Mines
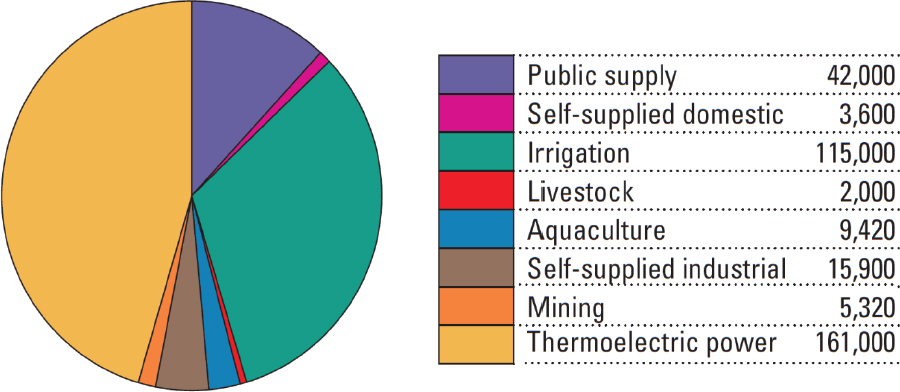
Cath opened his presentation with some background information on water use. About 335 billion gallons of water per day are withdrawn for use in the United States and data indicate the largest share is for thermoelectric cooling, followed by irrigation, he said (see Figure 4.1). Differentiating these uses further by state and region, he noted that in the west, water is mainly used for irrigation, while in the east water is used more for thermoelectric cooling purposes. In terms of states, both California and Texas are large producers and users of water.
Many opportunities exist for increasing use of produced water in the United States, Cath suggested. Currently, produced water use is about 2 billion gallons per day (less than 1 percent of withdrawals) while 32 billion gallons per day of municipal wastewater effluent is discharged nationwide, of which 12 billion gallons per day are discharged to an ocean or estuary. Cath then used the remainder of his time to discuss oil and gas water use, various approaches to water treatment, including desalination and pretreatment, and a decision support tool developed in his group to help determine the kind of treatment options that would be most appropriate for a given intended end use.
In the oil and gas industry, about 2.3 billion gallons per day of produced water is generated, with a very small percent (less than 10 percent) currently used, Cath said. With drinking water available at a relatively low price, little monetary incentive exists to use water. Thus, economics is a driving
SOURCE: Maupin et al., 2014. Available at http://pubs.usgs.gov/fs/2014/3109/pdf/fs2014-3109.pdf (accessed August 11, 2016).
factor along with regulations, liability, and the lack of low-cost treatment technologies to keeping the amount of use of produced water in the country at relatively low volumes. Cath outlined both nonpotable and potable uses of produced water with opportunities growing for potable use, particularly in California, Colorado, and Texas. A great opportunity for reusing produced water is during drilling and hydraulic fracturing operations, especially in regions where water is scarce, he said.
When thinking about produced water use and water treatment in general, a multibarrier or treatment train system is used to address the many challenges in treating water. Cath emphasized that if the characteristics of the water are known, then water can be treated. Waters may have high salinity—greater than 100,000 parts per million—and may contain various organics such as oil and grease, inorganics such as borates and naturally occurring radioactive material (NORM), and variable flows. The treatment process goals have to be fit for purpose, cost effective, and compatible with hydraulic fracturing fluids and geochemistry.
Cath briefly discussed desalination because of the importance of removing salts from produced water. Technologies he mentioned include membranes, thermal, and membrane brine concentrators. The energy required for reverse osmosis desalination is close to the thermodynamic limit and the reverse osmosis process is thus currently limited to low-salinity water. For example, the desalination of seawater is limited to about 60 percent recovery. To conduct seawater desalination, very efficient seawater desalination plants are required. A new desalination plant in San Diego was an investment of more than $1 billion, he said. The plant can treat water for $1.70 per cubic meter. By comparison, Cath mentioned that the cost of desalinating produced water might be about $11.00 per cubic meter. The challenge for produced water is that one needs to pretreat water before desalination can be conducted.
Pretreatment is important to protect downstream processes or production of water for direct use in the field. Cath noted that his research group focuses on pretreatment to protect downstream desalination. They focus on physical, chemical, and biological processes, which include filtration, coagulation, adsorption, disinfection, biologically active filtration, and sequencing-batch membrane bioreactor processes coupled with ultrafiltration and nanofiltration. The question becomes, how does one use the different processes to achieve good pretreatment? He described an example of a hybrid biological and membrane treatment process, which has applications for industrial wastewa-
TABLE 4.1 Comparing Natural Evaporation to Membrane Distillation
| Natural Evaporation | Membrane Distillation | |
|---|---|---|
| Water flux | 0.6 m/yr | 12 L/m2-hr |
| Water flux, mm/d | 1.644 | 288 (175x NE) |
| Time | 1,100 days | 6.5 days |
| Footprint | 1 acre (43,560 ft2) | 250 ft2 |
NOTE: NE = natural evaporation.
SOURCE: Cath, slide 43.
ter and drinking water. Treatment trains described included biological active filtration, membrane bioreactors, ultrafiltration, and nanofiltration.
Cath also outlined examples of new desalination technologies that included high-recovery desalination options such as membrane distillation. He compared natural evaporation to membrane distillation using several criteria including time and footprint (see Table 4.1). The membrane distillation technology has substantial treatment time savings and a reduced landscape footprint—a 1-acre evaporation pond relative to 250 square feet of membrane.
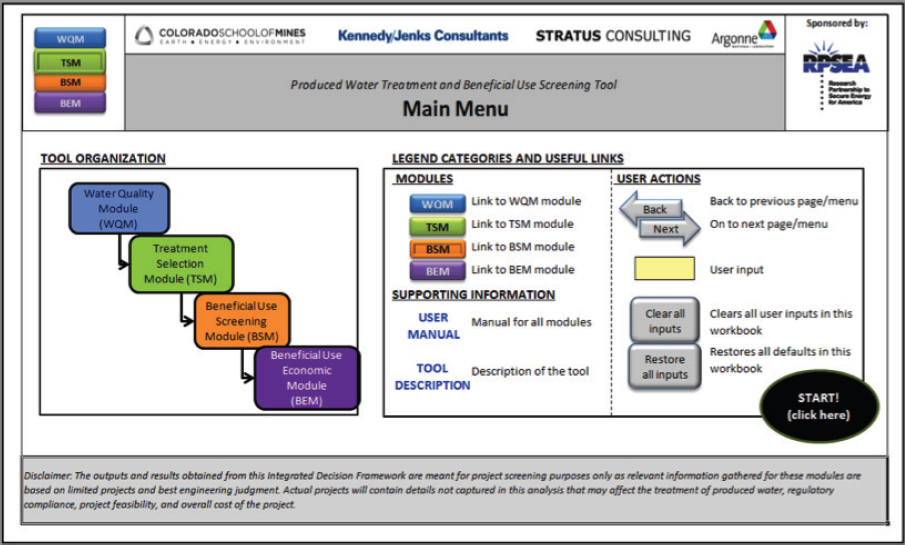
Cath then illustrated a decision support tool (see Figure 4.2) that was developed with financial support from DOE. The support tool helps users select appropriate treatment processes to optimize beneficial use. The tool has four modules:
- Water quality,
- Treatment selection,
- Beneficial use screening, and
- Beneficial use economics.
SOURCE: Cath, slide 47.
Frac Water: Recycling Objectives
Pele Okullo, Newfield
Okullo discussed water recycling from an exploration and production company perspective and noted that industry views produced water as a heterogeneous mixture of several components (e.g., dissolved solids, salinity, suspended solids, iron sulfide, and oil and grease). He mentioned that, before a saltwater disposal well is created, the company will examine the compatibilities of this heterogeneous water and the reservoir. They also look at other aspects of the rock, fluid, and technical system that include porosity, pumping characteristics, and equipment integrity.
In the past couple of years, Okullo said, Newfield did some trials looking at various water treatment technologies with their existing infrastructure. They examined dilution, where produced water was diluted with freshwater. The cost was about $2 per barrel (see Figure 4.3). Okullo emphasized that the overriding factor was the pretreatment cost, for example, pretreating the water to separate oil from water or to address high suspended solids or high bacterial counts. After dilution, they looked at settling water in impoundments for a few days as a treatment option. After solids settle out of the water, the water could then be used for other purposes. The treatment cost was about $2.50 per barrel of water. He and his colleagues also looked at natural filtration processes that resulted in costs at about $2 per barrel of water. Other technologies that were tested included chemical precipitation with polymers and flocculation, clarification, and electrocoagulation (a process where anodes
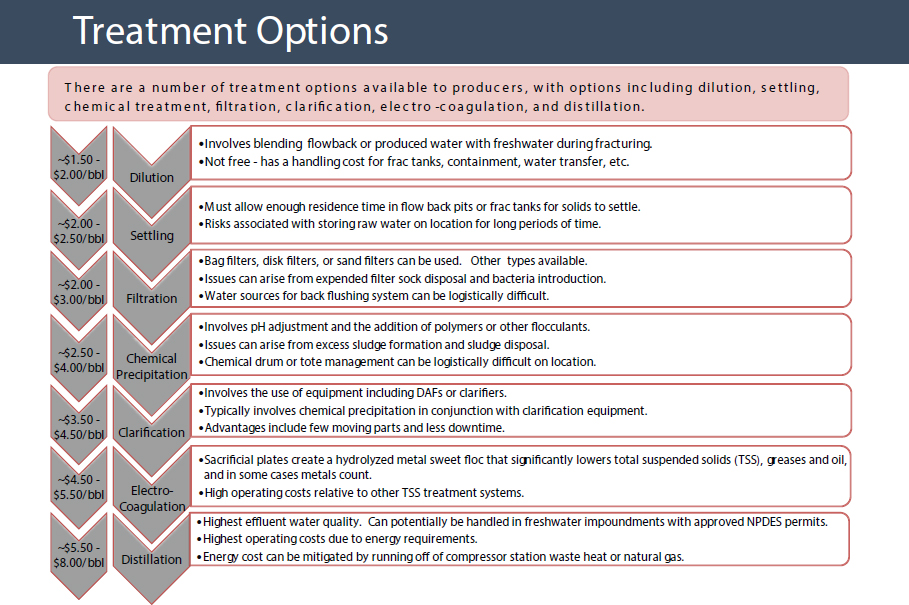
NOTE: bbl = billion barrels; DAF = dissolved air flotator; NPDES = National Pollutant Discharge Elimination System.
SOURCE: Okullo, slide 4.
are used to oxidize metals, which is followed by metals settling out of the water). Treatment costs varied between $2 and $4 per barrel. Treatment using distillation was $8 per barrel. Okullo stressed that many of these costs were calculated on the basis of using existing onsite infrastructure, and if one had to truck or transport water, costs would increase substantially.
Next, Okullo discussed water compatibility with a particular end use or uses, and illustrated this idea using a case study from the Uinta Basin Water. Produced water in the Uinta had 315 milligrams per liter of calcium. Options to reduce that content included sinking a water well on the oil field site, laying a pipe to a nearby river (the Green River), or bringing in utility water that was about 10 miles away. The aquifer water itself was deemed incompatible with the produced water because of the high barium concentrations in the latter. Concern was also expressed about NORM and the potential for barium to precipitate with sulfates. River water was also incompatible—one can comingle waters, but additional treatments with associated cost were needed—with produced water, he said. The sulfate content of the Green River water was 434 milligrams per liter of sulfate, which is problematic for operators. Okullo noted that when one selects a vendor for recycling water, one has to make sure that the vendor is economically sound because hydraulic fracture water chemistry changes. For example, for many of the pilot trials Okullo mentioned, from initial bench testing to larger-scale facilities, the water chemistry changed considerably.
Okullo concluded by stating that Newfield saved about 10 million barrels per year of freshwater by recycling produced water and saved about $30 million in the past 3 years by not purchasing potassium chloride, which would otherwise be purchased if freshwater were used in fracturing. Other gains mentioned included the reduced need for produced water disposal and associated transportation costs.
Use of Flowback and Produced Water: Opportunities and Challenges for Innovation
Rick McCurdy, Chesapeake Energy
McCurdy introduced his presentation by emphasizing that the oil and gas industry was in a downturn. He discussed current technologies that help get to a dischargeable water quality, promising technologies that are on the horizon, and hindrances to the beneficial use of produced water.
McCurdy touched on economics (see Figure 4.4), power demand, and waste/product generation in relation to current treatment technologies. To treat produced water to a freshwater quality, there are presently three primary processes, he said:
- Reverse osmosis (RO; once above 50,000 milligrams total dissolved solids [TDS] per liter, RO becomes economically inefficient),
- Vacuum distillation/mechanical vapor recompression, and
- Crystallization to achieve freshwater quality from produced water, which costs between $7 and $12 per barrel depending on the initial water characteristics.
From a power demand perspective, to treat produced water to freshwater quality using distillation or mechanical vapor recompression required about 6 to 8 kilowatt hours per barrel of water processed, McCurdy said. This means that if one has a 50,000-barrel-per-day plant one needs about 110 and 146 gigawatt hours of electricity per year to operate the plant. As context, he noted the average household consumption is about 11 megawatt hours of electricity per year. Thus, this is equivocal to an energy demand of 25,000 and 34,000 people.
McCurdy discussed plant capacities for treating produced water that range between 5,000 and 300,000 barrels per day (see Table 4.2). The table also showed barrels per day of products and waste such as filter cake, distillate, salt, and CaCl2 brine. If 50,000 barrels per day of water are treated,
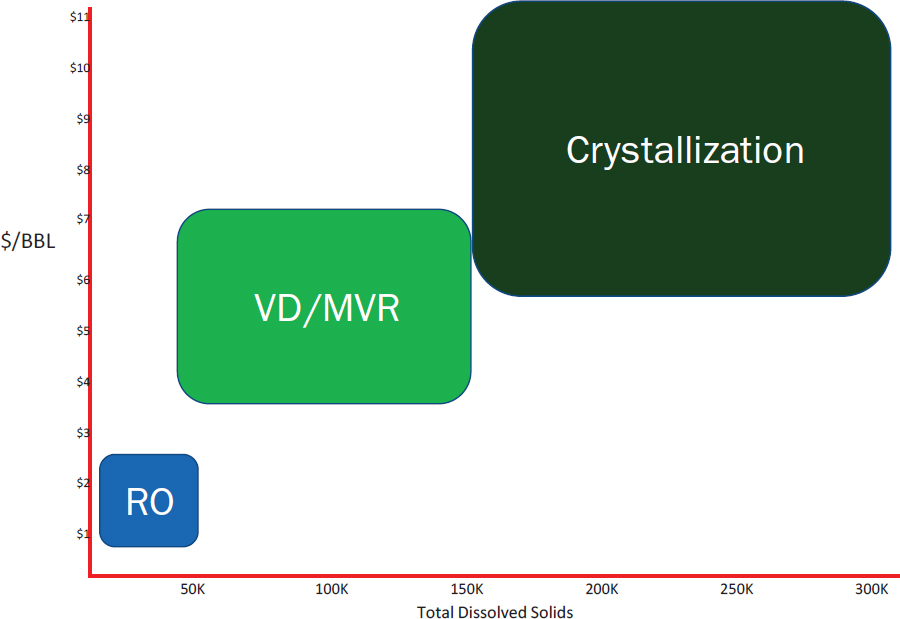
NOTES: Treatment technologies include reverse osmosis (RO), vacuum distillation/mechanical vapor recompression (VD/MVR), and crystallization. BBL = billion barrels of liquid.
SOURCE: McCurdy, slide 4.
TABLE 4.2 Waste/Product Generation
| Capacity | Products and Waste | ||||
|---|---|---|---|---|---|
| bbl/day | MGD | Filter Cake (tons/day) | Distillate (bbl/day) | Salt (tons/day) | CaCl2 Brine (bbl/day) |
| 5,000 | 0.2 | 53 | 4,000 | 107 | 1,000 |
| 50,000 | 2.1 | 533 | 40,000 | 1,066 | 10,000 |
| 100,000 | 4.2 | 1,066 | 80,000 | 2,132 | 20,000 |
| 200,000 | 8.4 | 2,132 | 160,000 | 4,264 | 40,000 |
| 300,000 | 12.5 | 3,198 | 240,000 | 6,396 | 60,000 |
NOTE: bbl = billion barrels; MGD = million gallons per day.
SOURCE: McCurdy, slide 6.
one can generate 40,000 barrels per day of a clean distillate or water that could have beneficial use, he indicated. At that level, about 533 tons of a filter cake per day will go to a landfill. For context, an average double- or triple-axle dump truck can carry about 10 tons of material; therefore, about every 25 minutes, a dump truck would leave the site and go to the landfill. In addition to the filter cake, a little over 1,000 tons of salt per day would be generated as would 10,000 barrels of calcium chloride; a good market exists for this latter product.
McCurdy then discussed specific treatment technologies in further detail, including acid-base generation, membrane distillation, and plasma-arc generation. In the acid-base generation process, the sodium and the chloride in salt brine are separated into a sodium ion and a chloride ion. The water is disassociated into a hydrogen ion and a hydroxyl ion. When combined, this yields hydrochloric acid and sodium hydroxide. The hydrochloric acid is used in oil and gas operations. An anolyte biocide is also generated through this process, he said. Acid-base generation is energy intensive—2 to 4 kilowatt hours per barrel treated, McCurdy noted. In a 5,000-barrel-per-day plant, 75,000 gallons of 15 percent hydrochloric acid, 40,000 gallons of sodium hydroxide, and 10,000 gallons of biocide can be generated every day. If extensive oil and gas operations are in place in an area, some of these products may be used in hydraulic fracturing. If not, a market has to be identified for the products, he said.
Membrane distillation requires little pretreatment as the membrane is resistant to fouling, McCurdy continued. Successful trials have treated waters with up to 120,000 to 200,000 milligram of TDS per liter, with good results. This technology can provide recovery of a distillation unit at the cost equivalent to reverse osmosis. The process also has a low energy demand and might be economically feasible in a few areas, he said. Industry and academia are working together on improvements to this technology. McCurdy suggested that this method may be a step changer for treatment in the future. The disadvantages of membrane distillation include the fact that oil can foul the membranes. Thus, oil has to be removed from the system.
Plasma arc is a new system, McCurdy explained, where a plasma of 6,000 to 8,000 degrees centigrade evaporates water and has the potential to remove organics from the water. It can handle any TDS-containing water with minimal pretreatment. Disadvantages to this technology include insufficient data on air emissions and various aspects of field pilots that have not yet been evaluated, he said.
In his closing remarks, McCurdy tried to stimulate discussion by posing three questions to the audience: How will the water be used, what is in the water, and where will it be used? He suggested that one could extract minerals such as iodine from the produced water or that the water could also be used for feedstock in chlor-alkali plants, for agriculture, and for direct discharge to surface waters and aquifer.
Regarding what is in the water, he mentioned that analytical techniques are lacking for many of the organic compounds in produced waters. He noted another question about chemical analysis, asking the audience if thousands of chemicals need to be analyzed and, if so, how many times, to consider potential use of produced water.
McCurdy mentioned the Clean Water Act and made reference to the 98th meridian. West of the 98th meridian, some leeway exists in existing regulations to put produced water to some beneficial uses. East of the 98th meridian, the same flexibility does not exist, he said. He concluded by asking the audience if this regional issue also needed to be addressed.
MODERATED DISCUSSION
Capuano moderated the discussion and led with a question to the panelists: Because many of the processes described by the panelists were individual techniques, does an activity exist that integrates across processes and looks at reducing water treatment costs from a holistic perspective? McCurdy said that he would really encourage either an academic group or a national laboratory to take up that challenge. He described that industry is already addressing some aspects of this approach with certain waste streams and is looking at the concept of tailored produced water use. This latter approach examines how one system can be used and then tailored with slight changes in the operating conditions to produce water of differing qualities at different times. Thus far, the approach seems to work with waste streams that are not very complex and preferably do not have
the combination of organic, inorganic, and radionuclide components, he added. Cath followed that response by mentioning that his research group is trying this approach with well-known and characterized waste streams. A workshop participant added comments about the work at his university to address some of the same issues, noting differences between his team’s work and that of Cath’s. The participant’s own research group focuses on the system, including transportation and storage costs. The next step is really to achieve better integration (of technology treatment with the system, across a range of different produced water types).
Another participant noted that the suite of technologies discussed by the panelists referred mostly to those that use traditional chemical engineering and a direct cost-only approach. The participant noted that the panel discussion had raised questions about some of the economic externalities and some of the environmental benefits such as saving water and reducing truck trips, but no explicit quantification of those aspects had been provided. The participant asked if the panel could comment on how some nondirect costs are being addressed. Cath responded by indicating that some of the new versions of the decision support tools he had described do try to incorporate externalities. Other tools that are increasingly being used are life-cycle assessment tools that look at different impacts on the environment. They have performed life-cycle assessment on some technologies that compare new technologies to conventional ones.
McCurdy added that different corporations look at similar technologies in different ways. For example, from a field operational standpoint, technologies are viewed on a cost basis. From a corporation standpoint, other costs are included such as public relations costs, sustainability costs, and stakeholder costs. When it comes to cost accounting, the commercial aspects also have to be incorporated, he said. For example, many times a technology may perform wonderfully in the field, but may fail on the commercial side because, for instance, the proper permits were not in place or a cooperative agreement was not finalized with other producers who could use the water.
A participant asked McCurdy to comment on the status of the three technologies he described. Are they at a pilot plant stage or are further developments needed? McCurdy said that acid-base generation is not a new technology and has been around for some time. The issue is establishing a market for the products and the associated economics. He noted that many companies are working to develop membrane distillation and that the technique is in the field pilot phase. The downturn in the oil and gas industry is preventing funding to push it to the next level.
A participant commented on decentralizing water treatment or moving toward mobile onsite water treatment. Mobile onsite water treatment may make sense, the participant continued, when an onsite or nearby use for the water already exists. Mobile onsite water treatment may not make sense if water has to be transported off site for an intended use, the participant added. Cath agreed with the participant’s assessment because moving water is expensive. The industry is still struggling with economies of scale, he said, and small systems are usually more expensive. Okullo followed by saying that during exploration mobile treatment may be useful; however, if the site is fully developed, building a full onsite facility may be more effective.
Capuano raised a point regarding infrastructure retrofitting and noted the challenges regarding attempting to retrofit new or specialized technologies into an old infrastructure. She suggested there is potential to examine existing infrastructure and what is needed to adapt it to managing produced water. Capuano indicated a need to have centralized facilities that can treat water, and that these are often older facilities located close to large cities which have grown around them. Thus, the question is complex and not simply about technology. The technology often has to fit into an infrastructure that is well established, she said.
McCurdy emphasized that it makes a difference if a use for the treated water exists onsite or if water has to transported off site. He noted further the importance of how much water may be available at one location. For example, a good place to put a treatment plant may be in the Mississippi Lime in Northwest Oklahoma where disposal wells are handling 40,000 to 60,000 barrels of water per day.
A participant commented on the geographical differences and differences between geologic plays as a factor in considering produced water. The participant emphasized that even within one play across different states major differences exist in local conditions. Capuano said that more conversation around water demand and the potential applications for the water is needed to match the water (and its characteristics) with the demand.
A participant emphasized the difficulties in modeling the full range of heterogeneities of produced water across all regions and formations. Any model would need portions dedicated to specific input data (e.g., input data from the Marcellus).
Another participant asked the panel to comment on current technologies that may incorporate selective ion removal, especially for constituents like boron or uranium or other radioactive materials. Cath responded by describing what he indicated is a big problem with complex waste streams—that of the interaction between different constituents in the water. Boron is a huge problem for irrigated agriculture, he noted. Boron from an oil and gas perspective is also a big concern with regard to crosslinked gels used in hydraulic fracturing. Emerging technologies can selectively extract boron, he said.
A participant then asked what is known about the brine in the subsurface and whether any research is being conducted on what can be done during hydraulic fracturing to keep the brine in the subsurface and extract the gas preferentially. McCurdy said industry began to look at this issue a few years ago and has been examining the natural process of negative capillary suction pressure in the shale plays which allows the water that is put into the well to be pulled into the shale, much like the way the capillaries in a paper towel dipped into water pull the water into the paper towel. In the shale play, when the water is pulled into the shale, the same process generally kicks out the gas or oil back up the well. Industry has tried experimenting with shutting wells in for longer periods of time after hydraulic fracturing and waiting to bring them on online; this process has generally led to less water production and increased oil or gas production. The optimal approach with this kind of operational procedure is still a question as the operators try to balance the economics of wells being offline for a period of time with the potential for less water production and greater oil or gas production. The participant thought that keeping water in the ground for longer periods of time could be a piece of the solution to produced water concerns and reinforced McCurdy’s comments that fundamental questions remain in this area.
A participant noted the challenge of identifying end users for treated, produced water and the need to do so before discussing the treatment options or infrastructure needs in detail. The end use, the participant suggested, will guide the treatment steps taken. To look at this issue, a participant suggested selecting a few representative places in the country and then looking at a range of potential water uses and treatment technologies and associated analytics. They asked if this could be an appropriate framework to move the conversation from the general to the specific. To move things forward, Capuano followed up by mentioning the importance of bringing participants from diverse backgrounds together in an effort to elevate and move the conversation forward.
Another participant emphasized the downturn in the oil and gas economy and the implications for produced water management. The Groundwater Protection Council (GWPC) is starting to match water users with the availability of produced water in areas such as those drought-impacted regions of the western United States.
A participant asked the panelists if they thought about 3D printing, citizen science, or doing grant challenges to help increase engagement and awareness about produced water and how the water is treated and managed. Cath responded, saying that treatment technologies need to go to the piloting level, then long-term testing and demonstrating. He emphasized that it is not easy to do piloting of new technologies. Industry needs convincing that a given technology can go to full scale and the time scale for many pilot studies maybe inadequate. Cath further commented about water quality regarding analytical capacity and the difficulty in analyzing complex organics.
If there are residual contaminants in the water, even a very low concentration, how does this impact process performance? There is not enough research on that. Furthermore, there is no discussion about variable water streams. He stressed that it is not just treatment but also water storage, and there has been no discussion about storage technologies. McCurdy mentioned that some of the hurdles to developing technologies to treat the water are not having the tools to know what is in the water. There was a follow-on comment about possible short- and long-term impacts of residual contaminants on treatment processes and that produced water is a variable stream, in terms of both quality and quantity. McCurdy emphasized the importance of storing produced water and noted that there was little discussion on this topic.
There was a final comment from a participant who emphasized the importance of pilot-scale testing of technologies. They described past work illustrating the short time scales (e.g., days to a few weeks) of many pilot studies and emphasized the benefit of sustained piloting of technologies for longer periods.


