
5
Characterization of Flowback and Produced Waters for Potential Use
The third panel session of the workshop discussed the characterization of flowback and produced waters for potential alternative uses. Three 10-minute presentations by the panelists were followed by a moderated discussion. The discussion was moderated by Bridget Scanlon, Bureau of Economic Geology (BEG), The University of Texas at Austin.
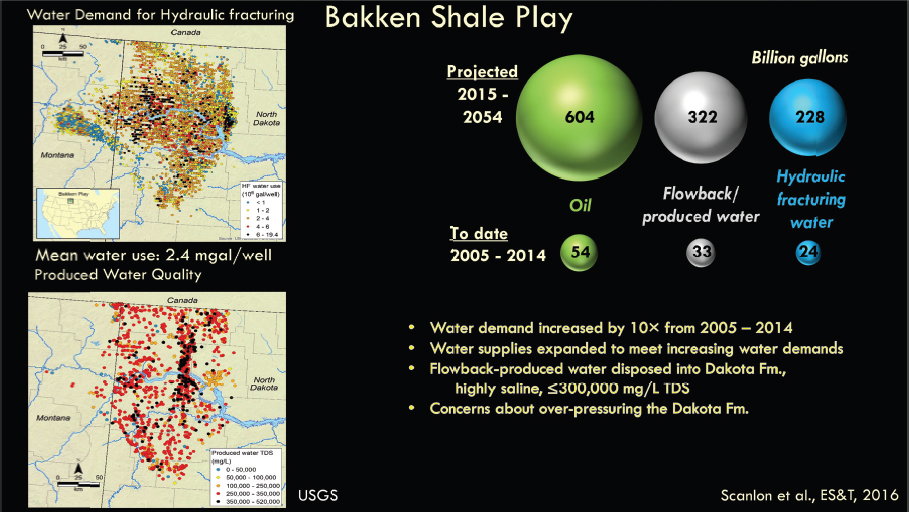
Scanlon opened the session with an overview of several unconventional plays on which the BEG is currently working from the perspective of produced water. These included the Bakken and Eagle Ford shale plays. In the Bakken, the research group found that average water volumes used per well total 2.4 million gallons. Water demand for hydraulic fracturing jobs between 2005 and 2014 has increased by about a factor of 10, she noted, for the Bakken. Part of this increase may be due to changes in operational approaches where slickwater fracturing fluids are being used more frequently than hydraulic fracturing gels, she said.
To date, Scanlon noted, water use for hydraulic fracturing in the Bakken is about 24 billion gallons (see Figure 5.1). In the Bakken, more water is produced from the formation than is used for hydraulic fracturing. Nonetheless, she said, in the Bakken area, operators initially had water shortages because of the difficulties in moving water to the locations where it was needed for hydraulic fracturing. Produced water from the Bakken has very high salinity—up to 520,000 milligrams of total dissolved solids (TDS) per liter, she indicated. Freshwater is plentiful in the area, so no incentive exists to reuse the highly saline produced water. Thus, most of the produced water goes to saltwater disposal wells in the Dakota Formation, which is located at a depth of about 5,000 feet. The Bakken itself is at a depth of about 10,000 feet. Some concerns exist about over-pressuring in the Dakota (due to the volumes of injected water for disposal) because one would have to drill through that formation to get to the Bakken.
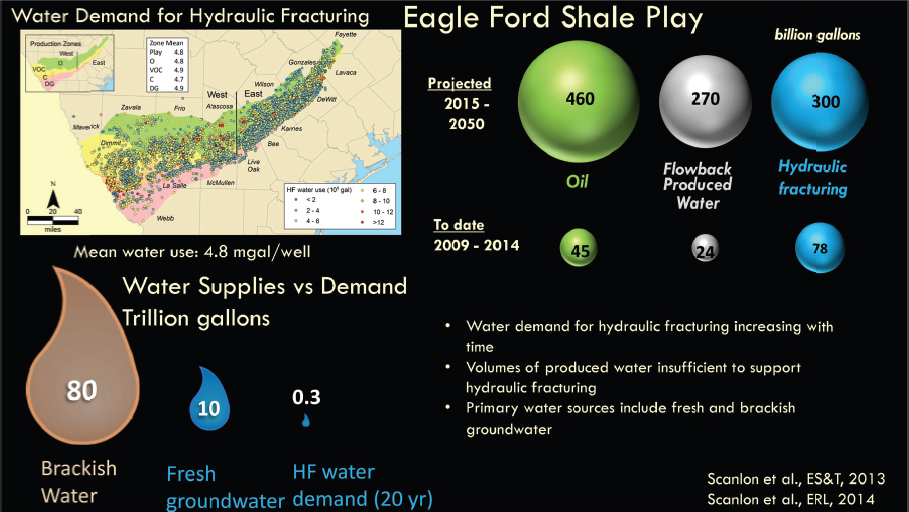
The Eagle Ford shale play in Texas produces oil, condensate, wet gas, and dry gas. The average water use for hydraulic fracturing per well is 4.8 million gallons, or about twice that used for hydraulic fracturing in the Bakken. Water demand for hydraulic fracturing has also increased with time in the Eagle Ford. From 2009 through 2014, 78 billion gallons of water were used for fracturing, she noted, while 24 billion gallons of water and 45 billion gallons of oil were produced. Thus, produced water volumes are low, or roughly one-third of what is actually required for hydraulic
NOTE: TDS = total dissolved solids.
SOURCE: Scanlon, slide 3.
fracturing. Logistically it is almost impossible to reuse water for hydraulic fracturing in the Eagle Ford, she said.
The projected water demand for hydraulic fracturing in the Eagle Ford over the next 20 years is 300 billion gallons (see Figure 5.2), Scanlon noted. She then showed freshwater storage in the aquifer to be about 10 trillion gallons, with brackish water storage at about 80 trillion gallons. On a square-mile grid scale, the water demand for hydraulic fracturing over 20 years is less than 2 percent of the water available, with the exception of a couple of counties where 90 percent of the water demand is for irrigation. In the region, decision makers are incentivizing brackish groundwater use by conservation districts, she said.
PANEL PRESENTATIONS
Characterizing Injected and Produced Waters
Tanya Gallegos, U.S. Geological Survey
Gallegos presented some recent work by her and colleagues at the U.S. Geological Survey (USGS) on injected fluids for hydraulic fracturing. Both volumes of water used in hydraulic fracturing and the type of fracturing fluid used in the process vary regionally across the United States, she said. Their work found that the highest water use areas coincide with areas of shale gas production (for example, in the Appalachian and Arkoma areas). In areas with water use in the 264,000 to 2.64 million gallons per well range such as the Williston Basin and the Permian Basin, water use is primarily tied to hydraulic fracturing for tight oil production. For water usage in the hundreds
NOTE: HF = hydraulic fracturing.
SOURCE: Scanlon, slide 4.
of cubic meters per well, such as the San Juan and Raton Basins, and areas of the Black Warrior Basin, water usage coincides with areas that are historically produced for coal-bed methane, she said. Further examination of the fluid types used in the hydraulic fracturing operations in the various basins also yielded regional patterns, she indicated.
Using the commercial IHS database, their work found that the top 95 percent of fluid types that were reported to be injected into wells were gels, foam-based fluids, and slickwater. In areas associated with shale gas production, the majority of fluids reported were actually slickwater-based fluids, she said. In other areas, which were primarily producing tight oil, they saw that the fluid types were mostly gel-based fluids, while in coal-bed methane areas, injected fluids were largely foam-based fluids, often created using carbon dioxide and nitrogen gases. What is injected into a well during hydraulic fracturing is important when examining the potential use of flowback waters, Gallegos noted.
The USGS describes “produced water” as well fluid that is co-produced with oil or gas, Gallegos continued. Generally, the fluid collected at the wellhead shows three phases. The head space contains gas, which is largely methane. Below the head space is an oil phase, which is separated from an underlying layer of water. The water contains a variety of different constituents, she said. One of the big challenges when examining produced waters is the ability to measure the constituents. Waters have very high salinity and a high specific gravity, and they are also very corrosive. The range of constituents makes the fluids challenging analytically—instruments tend to clog, tubing can corrode, and dilution of water is required, Gallegos said. Dilution presents a problem when trying to detect the presence of trace elements, for example, arsenic or radium.
Another aspect regarding analytical characterization of the fluids is the difficulty in obtaining basic parameters, for example, pH. Calibration is difficult due to lack of comparable buffer solu-
tions, which generate interferences that impact instruments. Difficulties with measuring organics and inorganics are similarly challenged as analytical standard solutions are not in an equivalent matrix. The USGS is trying to develop a brine laboratory to specialize in measuring high-salinity solutions, she indicated.
Gallegos then described various aspects of the USGS produced waters database. The database contains about 165,000 different samples from different wells across the United States and is essentially a collection of about 33 different databases that have been compiled with quality assurance and control over the years. The database has recently added trace elements and is also beginning to include isotopes. Initially, the database consisted of conventional wells, but unconventional wells including coal-bed methane, shale gas, tight oil, tight gas, and some geothermal wells have been incorporated, she said. Not every constituent is available for each data point, but the data often include TDS, pH, calcium, and trace metals such as arsenic, mercury, and cadmium. Other constituents in the database are boron, calcium, magnesium, chloride, and sodium. One of the take-home points Gallegos emphasized was the range of concentrations for a given constituent from produced wells regionally, or even within the same basin. Two of the constituents that are not as well populated in the produced waters database are radium and organics. A wide range of radium concentrations is evident, for example, in the Permian Basin from formation to formation, and the same phenomenon occurs in the Williston Basin, where there is a twofold difference in radium concentrations from one formation to another. The Marcellus shale has the highest radium concentrations among the analyzed shales in basins across the United States at 9,500 picocuries per liter, she said.
To conclude, Gallegos emphasized much work remaining in terms of understanding the water quality associated with produced waters. Based on the USGS studies, they see differences in constituents in produced waters
- As a function of time from hydraulic fracturing and through the life of the well;
- From one formation to another, even within the same basin;
- From one wellfield to another within the same formation; and
- Between conventional, tight oil, shale gas, and coal-bed methane wells.
Workshop on Uses of Flowback and Produced Water: Opportunities and Challenges for Innovation
Ken Carlson, Colorado State University
Carlson began by stating that the goal of his projects is to reduce reliance on saltwater disposal wells for produced water. Colorado had an earthquake a year and a half ago and it shut down saltwater disposal for 3 months or more. He stressed that the work he and his colleagues conduct is not designed to eliminate disposal wells, but rather reduce reliance on them. At present, he suggested that oil and gas operations in Colorado are 100 percent reliant on saltwater disposal wells for managing produced water. He described the basic process for unconventional oil or gas well development as one that includes the transport of freshwater to a site, drilling, hydraulic fracturing, and disposing of water in the nearest disposal well. He offered that opportunities for innovation may exist in the areas of treatment and recycling.
Carlson described a vision or a future scenario that might include a black box to take local produced water and then transform it into a locally beneficial resource. The only way this kind of vision might be realized is to trade transportation costs for treatment costs, he said, because water is currently being transported to a disposal well at around $2.50 per barrel and $0.50 per barrel for downhole costs: most of the monetary costs are in transportation. If water could be treated and then
distributed locally, transportation costs would be minimal. He elaborated further on some grant-funded work that uses a geographic information system (GIS)-based model to select a radius—30, 15, or 10 miles—within which it is reasonable to transport water. The model then identifies all the potential water users within that area. Users could include, for example, agriculture processing facilities. He and his colleagues have adapted the model to help understand water quality needs, transportation costs, and what water volume is for surface use. By identifying all of these parameters in the model, the cost of a particular alternative can be calculated, he said.
Carlson then described alternative surface uses for produced water, which included using water to irrigate agriculture. He said Anadarko has some data on this approach, as does the Colorado School of Mines. He elaborated upon a recently completed greenhouse study at his own university where two biofuel crops were tested (broadleaf canola and switchgrass); five different water types were then used to irrigate both biofuel crops. One water type was a control reservoir water and another was produced water with 2,000 milligrams total organic carbon (TOC) per liter and 25,000 milligrams TDS per liter. In terms of TOC and TDS removal, concentrations were reduced to less than 5 milligrams TOC per liter and 400 milligrams TDS per liter. Thus, the water used to irrigate the crops met the requirements to be discharged. Another water type started at 3,500 milligrams TDS per liter with low organic content from which everything was removed by the biofuel crops. The third and fourth water types were high in organic content, for example with high concentrations of BTEX (benzene, toluene, ethylbenzene, and xylenes). The fifth water type tested was a clean brine. He emphasized that their research to date showed the real need for various types of data when considering produced water for a range of potential alternative uses. To use such waters for agriculture, for example, data are needed not only on the water chemistry, but also on the plants, such as plant productivity and soil data. Different data and analytical needs also require a multidisciplinary approach that includes water chemists to understand what is in the final produced water, agronomists to help understand crop management and soil science, and computer scientists to integrate information and provide decision support analysis.
He concluded by saying that some areas of the country are appropriate for the use of produced water for agriculture, while other areas are not. To move forward in this arena, he said that case studies will be important, as will be the understanding of the regulatory context.
Produced Water: The Oklahoma Perspective
Kyle Murray, Oklahoma Geological Survey
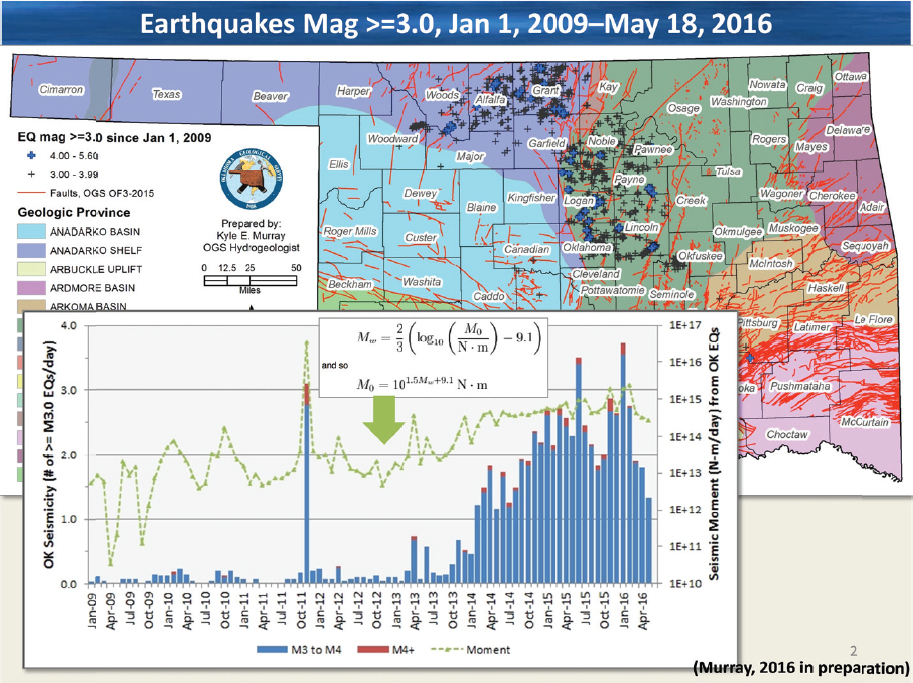
Expanding upon Bridget Scanlon’s overview of quantities of produced water in his presentation, Murray opened his remarks by indicating that the increased frequency of induced seismic events in Oklahoma was one factor motivating efforts to find solutions to the management of large volumes of produced water in the state. The reduction of saltwater disposal volumes, which have been linked in some cases to induced seismicity, is one goal and is becoming a part of the regulatory framework used by the Corporation Commission (which regulates oil and gas activities in the state). Seismicity in Oklahoma began to escalate in 2009 (see Figure 5.3). Prior to 2009, Oklahoma had about two earthquakes of magnitude 3 or higher per year. In 2014 and 2015, more than two or three magnitude 3 earthquakes occurred per day in some parts of the state, Murray said. This upward trend in the number of larger-magnitude earthquakes is also illustrated when measurements of the seismic moment1 in the state are plotted over time (see the bottom of Figure 5.3).
___________________
1 Seismic moment is the measure of the size of an earthquake based on the area of fault rupture, the average amount of slip on a fault, and the force that was required to overcome the friction along a fault. Available at https://earthquake.usgs.gov/learn/glossary/?term=seismic%20moment (accessed October 16, 2016).
SOURCE: Murray, slide 2.
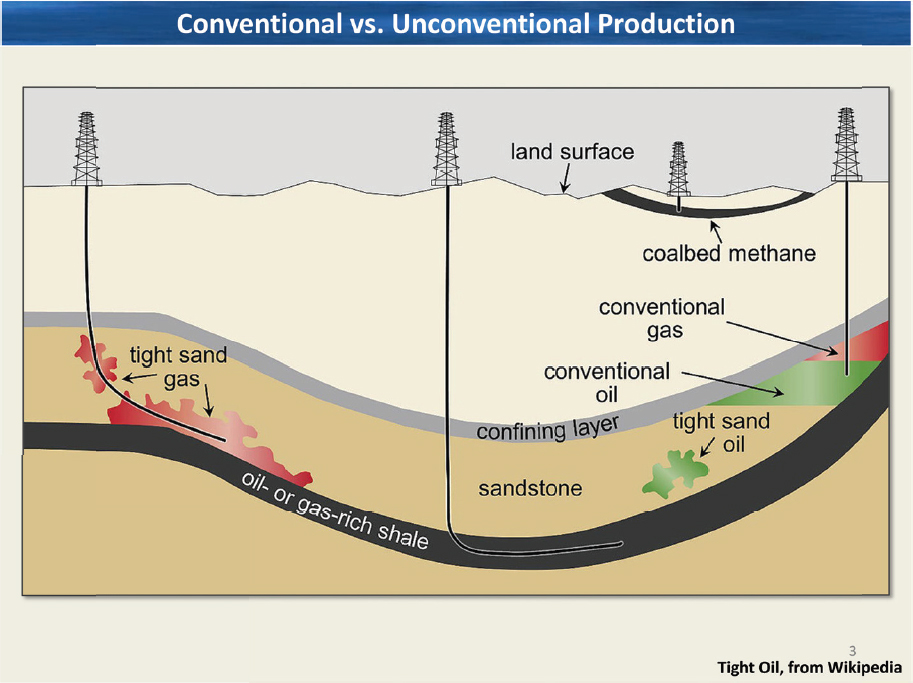
Murray suggested that conventional oil and gas production in Oklahoma relies upon vertical wells that produce gas and/or oil that overlies subsurface contained within a geologic formation (reservoir) (see Figure 5.4). In general, the gas or oil has migrated from a source rock to the geologic formation being drilled. In Oklahoma, the main source rock is the Woodford shale. He said that unconventional oil and production often targets the source rock itself or a nearby, tight rock formation into which hydrocarbons have migrated, with production achieved through a combination of horizontal or directional wells that have been hydraulically fractured (see Figure 5.4).
In Oklahoma, oil or gas production in some areas is achieved through the addition of another technique—dewatering2—for some oil and gas plays. The saltwater (produced water) that returns to the surface from these kinds of operations leads to an associated data need, Murray indicated, that can indicate how water production changes with time from these wells. A water production decline
___________________
2 Dewatering allows water or condensate-rich, hydrocarbon-containing reservoirs to be produced for their gas or oil through technologies that remove water from the hydrocarbons. The presence of high water content in the lower parts of the well can impede passage of the hydrocarbon to the surface. In Oklahoma, certain formations containing oil or gas are particularly water rich and dewatering techniques are applied to aid production.
SOURCE: EPA, 2015. Available at https://en.wikipedia.org/wiki/Tight_oil (accessed August 24, 2016).
curve, similar to what petroleum geologists or petroleum engineers might develop for oil and gas decline from a production well, is the desired result. He illustrated how a dewatering project might take place in which a lot of water is generated at the start of gas or oil production from the well and then declines through time. In the absence of these kinds of data, Murray said he relies on the water-to-oil and water-to-gas ratios, similar to those described in past reports (e.g., Clark and Veil, 2009).
He also mentioned some previous work in which he tried to quantify how much water is being used for hydraulic fracturing, how much water is co-produced with oil and gas (conventional and unconventional wells), and where the water is injected in the subsurface (see Figure 5.5). In the year 2000, Murray said, vertical wells were the predominant form of production in Oklahoma. In 2011, horizontal well completions comprised about 44 percent of the total in the state. Today, he indicated, hydraulic fracturing likely represents more than 50 percent of all oil and gas wells in Oklahoma. He then outlined what the data suggest in terms of water production as the Woodford Shale has been developed since 2005. Overall, he said, water used to produce these wells has increased significantly. To put the water use for drilling and fracturing in perspective to produced water volumes, Murray indicated that Oklahoma used about 100 million barrels in 2011 to develop all oil and gas wells (see Figure 5.5). Produced water volumes on a statewide basis are quite a bit higher.
In the Clark and Veil (2009) publication and the recently published update through the Groundwater Protection Council (Veil, 2015), the water-to-oil ratio on a per-state basis is used to approximate produced water volumes (where the actual volume data themselves are not available). Murray
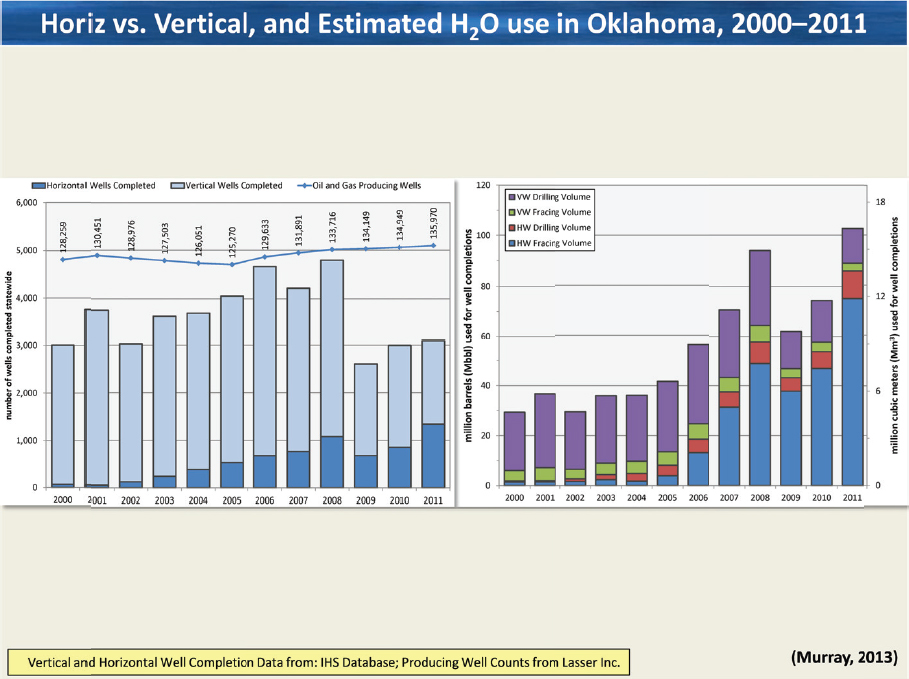
SOURCE: Murray, slide 6.
attempted to refine these estimates for Oklahoma with the goal to identify the geologic zone from which oil and gas was produced. He reorganized or recategorized producing geologic zones or formations in Oklahoma from an initial number of about 450 formations down to 10 zones and 2 miscellaneous categories. The zones ranged from the Permian-aged geologic formations (youngest in the sequence) to the Arbuckle formation (oldest sedimentary rocks in the sequence) and the underlying basement or crystalline rock, where a small amount of production and some disposal of wastewater occur. He considered conventional resources such as the sandstones in the Granite Wash Region of Oklahoma, which is in the Anadarko Basin. The zones that have been developed more recently, including the unconventional plays such as the Woodford shale, the Hunton formation, and others that are deeper (older) in the stratigraphic section, tend to yield a lot more water.
Murray then showed the evolution of oil and gas production from the state relative to various geologic zones. He applied the methodology from Clark and Veil (2009) to the formation or zone level and refined the results to the county scale for a 6-year time frame (2009-2015). The analysis showed a lot of oil production in northern and southern Oklahoma initially, while gas production was in the Woodford shale in southeastern Oklahoma, southern Oklahoma, and also in the Anadarko Basin. Prior to mid-2011, the Granite Wash zone in western Oklahoma was the primary gas-producing zone, whereas now gas is produced primarily from the Woodford shale. Some gas production also occurs from the Mississippian-aged formations in the north of the state.
Murray used these production data to generate water-to-oil and water-to-gas ratios. The median value for the ratio of water to oil in the Mississippian zone was 12, while it was about 17 for water to gas. He then showed produced water estimates for the state divided into county and production zones (see Figure 5.6). The produced water volumes increased significantly in 2012 when the Mississippian zone began to be a major producer, he said.
Murray then showed the saltwater disposal rate on a monthly time scale for every zone in Oklahoma. Most of the saltwater disposal occurs in the Arbuckle zone, which sits directly above the basement rock. Thus, it is important to understand the Arbuckle group and disposal into that zone if one wants to understand seismicity. He also showed the presence of about 1,000 disposal wells out of 3,500 total saltwater disposal wells in the state that inject water into the Arbuckle. The Arbuckle disposal wells are predominantly in the Cherokee platform and the Anadarko shelf, he noted.
In conjunction with different Oklahoma workshops on sourcing and transport of water, and volumes of flowback and produced water, Murray has compiled data based on hydraulic fracturing and completion water use values which show that flowback water has to be less than about 100 million barrels per year in Oklahoma. Produced water estimates, he said, are about 3 billion barrels per year, so the water used for hydraulic fracturing and the flowback water are a small fraction of what is brought back to the surface as produced water. Most of the produced water derives from the geologic formation itself, he continued. Half of that produced water is managed through saltwater
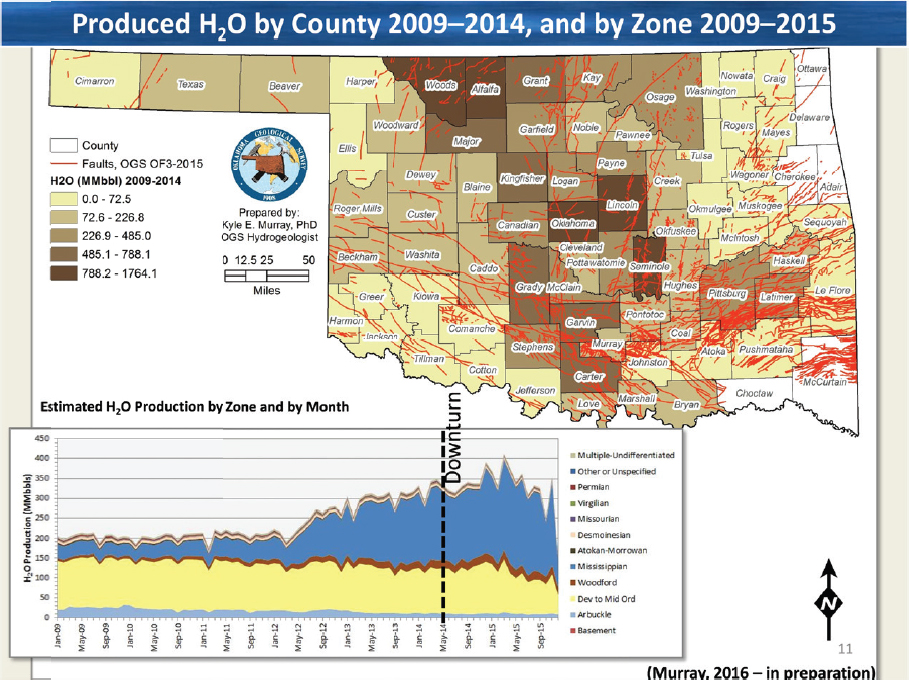
NOTE: MMbbl = one million barrels.
SOURCE: Murray, slide 11.
disposal wells; the other half presently goes to water floods to enhance oil production in existing fields. There are 5,000 enhanced oil recovery wells currently active in Oklahoma.
He concluded by emphasizing a long-term goal to identify more potential water users for produced water that would otherwise be injected into disposal wells. Users are a very important part of produced water management, Murray said.
MODERATED DISCUSSION
A participant commented on the idea of identifying water users. Oil and gas is often produced in locations with a limited number of potential water users. Using water locally is desirable, but may be problematic in many locations. The participant then asked a question: Could water banking be an option for industry in the future, especially in areas that are dry and getting drier? Carlson responded that, currently, water has no value. In the future, opportunities may arise to create value. Presently, the perspective is oriented around identifying places where produced water can be managed in ways that are permitted and do not cause environmental harm. Scanlon mentioned that water banking is traditionally used in Arizona and California to resolve temporal disconnects between water supply and demand during droughts and wet periods. The problem with storage is that it offers the potential for contamination, she said. During the discussion, Murray commented on identifying the end users and bringing them together with oil and gas producers. One resource that may be helpful in moving forward with these kinds of discussions is the Estimated Water Use Report3 released by the USGS every few years. The report shows the use of fresh and brackish water throughout the United States by type and sector, and differentiates between groundwater and surface water. Murray said that he has overlain groundwater used for irrigation with a map of produced water in Kansas and Oklahoma; the map shows co-location of irrigated agricultural areas and oil- and gas-producing areas with significant produced water, suggesting opportunities for potential alternative use.
Regarding banking, Murray mentioned that San Antonio has put into place an aquifer storage and recovery system. The city withdraws water from the Edwards aquifer and puts it into the Carrizo-Wilcox aquifer. Concerns exist about the compatibility of the Edwards aquifer water chemistry with the Wilcox aquifer water and comparative analyses have to be conducted, he indicated. Similarly, if produced water is desired as a source for water in a hydraulic fracturing job the water that is to be injected has to be compatible with the water in the formation and the operational parameters of the well. Murray further indicated that aquifer storage and recovery are great ideas because water would not be lost to evaporation; he did indicate some potential regulatory hurdles to implementing an aquifer storage and recovery arrangement in some areas.
Another participant noted the potential to use produced water for food crops in California. A lot of high-quality produced water with low salinity directly approximates the quality water used by agriculture in the state, resulting in a lot of interest in using this water for irrigation. Gallegos commented that other constituents besides TDS (e.g., radionuclides, organics, and trace metals) may be associated with produced fluids and need to be considered prior to agricultural applications. If some of these constituents exist in produced water that is applied to the land, the constituents could accumulate in soils which could result in potential inhalation exposure and leaching to surrounding waters. If these waters are instead injected into the subsurface, the presence of these constituents could create disequilibrium relative to groundwater. Site-specific studies could help address some of these scenarios.
A specific question was directed by one participant to Murray. The participant noted that in many cases, induced seismicity is associated with particular wells and particular faults, but such an association does not appear to be the case in Oklahoma. The participant asked about determining
___________________
3 Available at http://pubs.usgs.gov/circ/1405 (accessed September 17, 2016).
factors such as the density of faults, density of wells, or sparsity of the seismic monitoring network? Murray responded by saying that many factors can contribute to the occurrence of induced seismic activity that can be felt by people at the surface and that difficulties arise in associating a particular event with one causative factor. In Oklahoma, he said, about 3,500 wells are actively disposing of produced water. Nine hundred or more of these wells are in the Arbuckle. The fault map that he showed during his presentation is one of the latest publications from the Oklahoma Geological Survey, but he noted that thousands of faults are not yet mapped and may never be.
Another participant viewed management of produced water as a resource problem. Billions of dollars are spent trying to move water from one part of the country to another, the participant said. Water has value, especially when billions of dollars are being spent to build canals to transport water in the country and when California is looking at Missouri River water as a potential water source; these factors provide an incentive to consider water as a valued resource. The participant emphasized potential for government involvement in valuing water, using wind energy as an example: Where would wind energy be without government subsidies? Presently, competition for water does exist and if a 1930s-type drought was to occur, discussions would focus on which stakeholder might get first access to existing water. The participant concluded by saying that the produced water topic is important enough to continue moving forward to find solutions, even if all the necessary information is not available.
A question from an online participant asked panelists what must be done to gain greater trust and acceptance from the public and potential end users of treated produced water so that produced water would be considered a resource and not a waste. Carlson suggested the use of case studies, additional data, and additional science to improve understanding of the processes.
The importance of partnerships and the value of drawing together different sectors to solve produced water problems and to match supply with demand was highlighted by one participant. When partners come together, each one has a different level of resources to contribute, the participant said. Not all sectors can invest at the same level so a need exists for assistance and funding from government and private sectors.
A participant asked Gallegos how long it may take until enough robust analytical methodologies and approaches exist to generate case studies that could be generalized and applied across the spectrum of produced water situations. The participant also asked about how best to scale up from individual field studies to broader implications and results. Gallegos responded by saying that the first step is the ability to analyze produced water compositions. One main problem is the lack of officially accepted laboratory reference materials (e.g., those generated by the National Institute of Standards and Technology). One can check analytical methods against standard reference material to understand analytical recovery for produced waters; this kind of check against standards could also be applied to the range of organic constituents in produced waters. Analytic and instrument capability constraints certainly exist, she said, but capabilities are improving. The USGS brine laboratory currently being established will be operational in the near future. When up and running, the laboratory will be able to systematically work through each of the oil- and gas-producing basins and gain an understanding of the water chemistries from those basins and plays, Gallegos said.
A participant asked Murray if he was able to obtain injection water volumes and rates that would help understand injection scenarios and the genesis of earthquakes. Murray mentioned that the Oklahoma Corporation Commission has asked operators to submit daily injection rates and pressures on a weekly basis; these data are then processed on a monthly basis. Currently, data exist for about 700 wells. Murray noted that analysis of incoming data is very cumbersome because the data are in different formats and require a lot of processing time. He also mentioned that he has a summary of the changes in saltwater disposal volumes over time, and they started declining in October 2014. There was a comment from one participant on recent changes in reporting requirements, which made reporting more frequent.
The Ground Water Protection Council and the Department of Energy (DOE) were commended by a participant for working together to develop a database for the Oklahoma Corporation Commission that draws on seismic data from the Oklahoma Geological Survey’s catalog and the water volume data. The database is specific to what are called the “areas of interest,” which are areas where earthquakes are occurring in Oklahoma; these areas primarily correspond to the Mississippi limestone play. The whole idea of this database is not just to put the data in a form that can be used, but to make it easy for operators to submit data in an electronic format.
Scanlon posed a question to panelists on the regulatory barriers to surface reuse of produced water. Carlson responded by saying he thinks the issue is being addressed on a state-by-state basis. Colorado actually has a state bill that allows surface reuse of produced water. The state already provides permits for discharge of produced water into receiving waters. Gallegos mentioned that better data are part of what is needed to move forward. She emphasized that the USGS is happy to accept data from a range of stakeholders to include in the Produced Waters Database and make this information available to the public.
A participant asked what is needed to ensure that information learned about the content of produced water is incorporated into pilots or other projects that are examining produced water treatment. Gallegos responded that one of the projects on which she is working includes making data on water quality from oil and gas wells available to the public. Other researchers can use this information in designing treatment studies, she said. A follow-on comment emphasized the importance of time-series data and building relationships with operators to gain access to more detailed information on water quality and quantity.
Another participant mentioned that much of the public outcry on oil and gas development was related to water quality concerns. The participant had looked at some of the data and the frequency of water quality problems was not high compared to the number of shale gas wells; however, the participant noted the difficulty in having a complete overview because of the difficulty in obtaining data. Pennsylvania’s data are made public, the participant said, with groundwater data collected prior to drilling by the companies in Pennsylvania. This information is released to the state as PDF files. The state does not have the resources to provide the data online, however. After negotiations over more than 1 year, Penn State University and the state of Pennsylvania formed an agreement to release the groundwater data to Penn State. After that, students were paid to redact the data and put it online. Penn State has released 1,700 groundwater data points in Bradford County, which is one of the most extensively drilled counties in Pennsylvania. To put the data online, which includes redacting the data and putting it in an electronic format, costs approximately $4 per data point. The state is trying to move toward a more efficient system.


