
Appendix E
Comparison of a Simple Earth System Model to Existing SC-IAMs
This appendix compares the climate components in the existing integrated assessment models used to produce estimates of the SC-CO2 (SC-IAMs) to those of the Finite Amplitude Impulse Response (FAIR) model, the illustrative simple Earth system model described in Chapter 4: see Tables E-1 and E-2. In Table E-1, the shaded rows indicate the top-level description of the component of the simple Earth system model. The clear rows are descriptions of important “response characteristics” of the components (i.e., timescales and feedbacks).
The three SC-IAMs differ substantively from FAIR, as well as from each other, in such characteristics as the structure and response timescales of the global climate and carbon cycle and the modeling of the concentrations and forcing imparted by non-CO2 greenhouse gases and aerosols. As shown in Table E-2, the SC-IAM climate component modeling differs in other characteristics as well: regional climate, the way in which the CO2 pulse is implemented, treatment of parametric uncertainty, and time steps. As discussed in Chapter 4, IWG updates would need to consider how each of the characteristics in Table E-2 will be handled in future modeling.
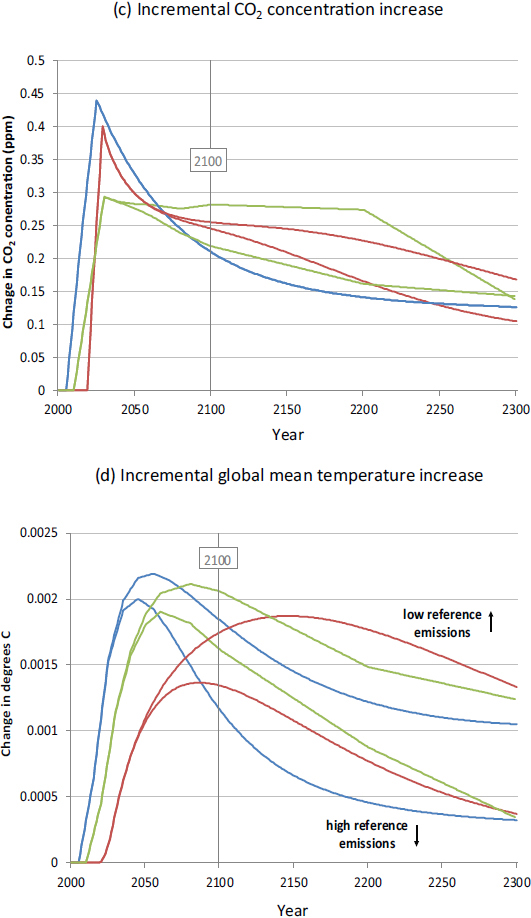
As shown by Rose et al. (2014), these differences across SC-IAMs affect the reference climate projections and CO2 pulse responses by producing significant differences in future concentrations and global average warming by 2100 for the same emissions inputs, as well as differences in the timing, magnitude, and shape of incremental temperature responses to a CO2 pulse: see Figure E-1. Future research ought to consider a similar
TABLE E-1 Global Climate and Carbon Cycles of SC-IAMs and FAIR
| Element | DICE 2010 | FUND 3.8 | PAGE09 | FAIR |
|---|---|---|---|---|
| Climate | ||||
| Structure | Two-box model (surface land/ocean and deep ocean) | One-timescale impulse response function | One-timescale impulse response function | Two-timescale impulse response function |
| Global Mean Temperature Adjustment Timescales | Function of equilibrium climate sensitivity (ECS): impulse response equivalent for ECS = 3 has slow response of > 200 years, fast response of ~30 years. | Function of ECS: for ECS of 3 °C and default parameters, e-folding time* 44 years; increases as quadratic function of ECS | Constant: Modal half-life of 35 years [e-folding time of 50 years] | For 3 °C ECS, median slow response timescale of 249 years, fast response of 4.1 years (Geoffroy et al., 2013). Response coefficients adjusted to prescribed values or distributions of ECS and TCR (Millar et al., 2015) |
| Non-CO2 Forcings | Exogenous forcing must be prescribed. | CH4, N2O, SF6, and SO2 modeled with single timescales; no other non-CO2 forcers | Exogenous well-mixed greenhouse gas forcing only | Exogenous forcing must be prescribed, or adjustment timescales and radiative efficacies can be adjusted to represent non-CO2 greenhouse gases (Myhre et al., 2013). |
| Element | DICE 2010 | FUND 3.8 | PAGE09 | FAIR |
|---|---|---|---|---|
| Carbon Cycle | ||||
| Structure | Three-box model (atmosphere, surface ocean, deep ocean) | Five-timescale impulse response function | Three-timescale impulse response function | Four-timescale impulse response function |
| Timescales | Fraction 1: > 50 years Fraction 2: > 1,000 years Fraction 3: infinite lifetime [inferred from inspection] | Fraction 1: 10%, 2 years Fraction 2: 25%, 17 years Fraction 3: 32%, 74 years Fraction 4: 20%, 363 years Fraction 5: 13%, infinite lifetime | For modal values, Fraction 1: 40%, zero lifetime Fraction 2: 25%, 123 years Fraction 3: 35%, infinite lifetime | For modal values, Fraction 1: 27%, 4 years Fraction 2: 28%, 35 years Fraction 3: 23%, 381 years Fraction 4: 22%, infinite lifetime (Myhre et al., 2013) |
| Carbon Cycle Feedback | None | Terrestrial carbon stock loss with warming (with central parameter values: ~0.14% of terrestrial carbon stock in a given period released per degree of warming relative to 2010) | Atmospheric CO2 increase with warming (with central parameter values: 10% CO2 concentration gain per period per °C, with maximum of 50%) | Airborne fraction increases as a linear function of warming and cumulative land and ocean carbon uptake (Millar et al., 2016) |
* “e-folding time” is the time-scale for exponential decay to an equilibrium state.
TABLE E-2 Additional Characteristics of the Climate Components of the SC-IAMs
| Element | DICE 2010 | FUND 3.8 | PAGE09 |
|---|---|---|---|
| Climate | |||
| Regional Temperatures | None | Pattern scaling for 14 regions based on 14 general circulation models (Gates et al., 1996, as cited in Mendelsohn et al., 2000) | Parameterized downscaling based on Intergovernmental Panel on Climate Change (2007) that scales an assumed temperature difference between equator and pole by regional latitude and average land/ ocean warming ratio |
| Ocean | |||
| Global Mean Sea Level Rise (GMSL) | Equilibrium for components (thermal expansion, glacier melt, GISa mass loss, WAISb mass loss) computed as function of temperature; adjustment time exogenous for thermal expansion and glaciers, and function of temperature for GIS and WAIS | Equilibrium GMSL rise computed as a function of temperature; exogenous adjustment time | Equilibrium GMSL rise computed as a function of temperature; exogenous adjustment time |
| Regional Sea Level Rise | Identical to global mean | Identical to global mean | Identical to global mean |
| Ocean pH | Not calculated | Not calculated | Not calculated |
| Element | DICE 2010 | FUND 3.8 | PAGE09 |
|---|---|---|---|
| Numerical Implementation | |||
| Model Time Step | 10 years | 1 year | Variable: 10-year 2000-2060, 20-year 2060-2100, and 100-year 2100-2300 |
| Implementation of CO2 Pulse in Year t | Pulse spread equally over the decade straddling year t | Pulse spread equally over the decade from year t forward | Pulse distributed evenly over the two decades preceding and subsequent to year t |
| Parametric Uncertainty Included (Other Than ECS) | No | Yes | Yes |
aGreenland ice sheet.
bWest Antarctic ice sheet.
comparison to FAIR, with comparisons of deterministic and probabilistic behavior. (See below for discussion of SC-IAM parametric uncertainty.)
The SC-IAM models also vary notably in their sensitivity to alternative assumptions explored in the current IWG approach, such as emissions and equilibrium elimate sensitivity (ECS), with the Framework for Uncertainty, Negotiation, and Distribution (FUND) model being less responsive than the Dynamic Integrated Climate-Economy (DICE) and Policy Analysis of the Greenhouse Effect (PAGE) models to different emissions scenarios and ECS values (Rose et al., 2014). This reduced insensitivity to varying ECS in FUND arises because, by construction, the response timescales are adjusted automatically as ECS varies to account for the inverse correlation between the rate of temperature response and ECS. DICE also modifies the temperature adjustment timescale with ECS, while PAGE makes no countervailing adjustment and, therefore, is more responsive to ECS. Marten (2013) characterizes FUND’s temperature adjustment timescale response as somewhat ad hoc.
Many of the differences between the SC-IAM climate models do not represent structural uncertainty, that is, different representations of the underlying system dynamics, which is the primary motivation for using multiple models. The climate component of all three SC-IAMs can be interpreted as special cases of FAIR, with the differences between them resulting from parameter choices or the setting of certain parameters to zero. These choices generate different response behaviors, the significance
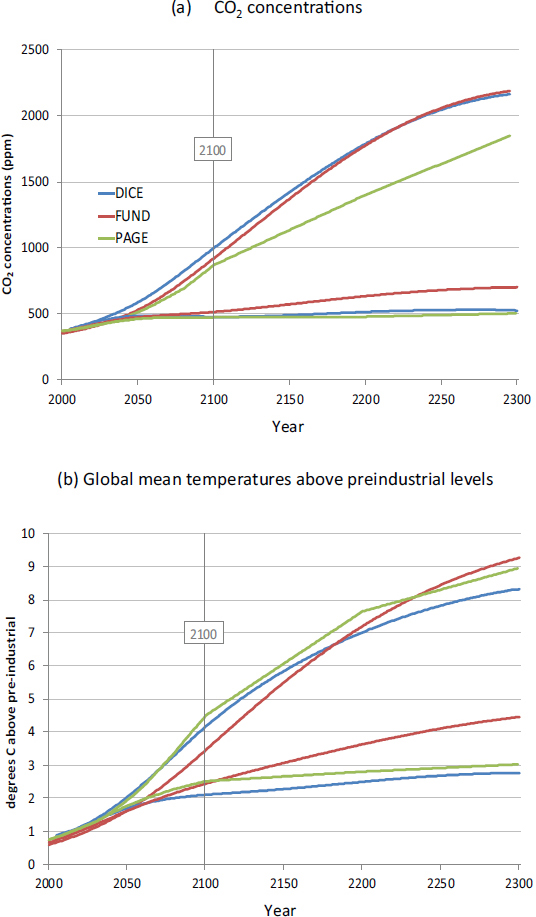
NOTES: The diagnostics were run with the IWG high and low greenhouse gas emissions scenarios (Interagency Working Group, 2010, 2013a, 2013b, 2015, 2016),
of which could be quantified by future analyses. DICE omits all feedbacks between climate and the carbon cycle (equivalent to rT = 0 and rC = 0 in FAIR). PAGE and FUND both omit the second timescale in the climate response (d2 = 0), and they only explicitly include the impact of warming on airborne fraction (rC = 0). All the models exclude some categories of non-CO2 forcings. These differences produce variations in projected climate variables between the SC-IAMs that should not be interpreted as representing scientific uncertainty.
The SC-IAM components are also implemented differently in the IWG modeling in terms of their treatment of uncertainty and CO2 pulse implementation. On uncertainty, FUND and PAGE include parametric uncertainty in certain model-specific variables; DICE does not. Also, the parametric uncertainties in FUND and PAGE are specified very differently, such that PAGE generates a significantly larger uncertainty range and produces higher average warming than FUND (Rose et al., 2014). For pulse implementation, there are differences in the timing of the incremental CO2 concentration and temperature responses due to how a CO2 pulse is introduced into and propagates through each model. Like the parameter choices discussed above, the exclusion of parametric uncertainty from DICE and the differences in pulse implementation contribute to variations in results across models that artificially represent actual scientific uncertainty.
In summary, the climate models incorporated in DICE, FUND, and PAGE are structurally equivalent to special cases of FAIR: although all omit at least one key element, they could be modified to be equivalent to FAIR and thus to satisfy the criteria outlined in Recommendation 4-1 and the requirements in Conclusion 4-1, in Chapter 4. The chapter also covers how the implementation differences discussed above could be addressed.
REFERENCES
Gates, W.L., Henderson-Sellers, A., Boer, C., Folland, B. Kitoh, A., McAvaney, F., Semazzi, N., Smith, A., Weaver, Q., and Zeng, C. (1996). Climate models—evaluation. In J.T. Houghton, L.G. Meiro Filho, B.A. Callander, N. Harris, A. Kattenburg, K. Maskell (Eds.), Climate Change 1995: The Science of Climate Change (pp. 229-284). Cambridge, U.K.: Cambridge University Press.
Geoffroy, O., Saint-Martin, D., Bellon, G., Voldoire, A., Olivié, D.J.L., and Tytéca, S. (2013). Transient climate response in a two-layer energy-balance model. Part II: Representation of the efficacy of deep-ocean heat uptake and validation for CMIP5 AOGCMs. Journal of Climate, 26(6), 1859-1876.
Intergovernmental Panel on Climate Change. (2007). Climate Change 2007: Working Group I: The Physical Science Basis. Contribution to the Fourth Assessment Report of the Intergovernmental Panel on Climate Change. S. Solomon, D. Qin, M. Manning, Z. Chen, M. Marquis, K.B. Averyt, M. Tignor, and H.L. Miller (Eds). Cambridge, U.K. and New York: Cambridge University Press.
Interagency Working Group on the Social Cost of Carbon. (2010). Technical Support Document: Social Cost of Carbon for Regulatory Impact Analysis Under Executive Order 12866 (February 2010). Available: https://obamawhitehouse.archives.gov/sites/default/files/omb/inforeg/for-agencies/Social-Cost-of-Carbon-for-RIA.pdf [January 2017].
Interagency Working Group on the Social Cost of Carbon. (2013a). Technical Support Document: Technical Update of the Social Cost of Carbon for Regulatory Impact Analysis Under Executive Order 12866 (May 2013). Available: https://obamawhitehouse.archives.gov/sites/default/files/omb/inforeg/social_cost_of_carbon_for_ria_2013_update.pdf [January 2017].
Interagency Working Group on the Social Cost of Carbon. (2013b). Technical Support Document: Technical Update of the Social Cost of Carbon for Regulatory Impact Analysis Under Executive Order 12866 (November 2013 Revision). Available: https://obamawhitehouse.archives.gov/sites/default/files/omb/assets/inforeg/technical-update-social-cost-ofcarbon-for-regulator-impact-analysis.pdf [January 2017].
Interagency Working Group on the Social Cost of Carbon. (2015). Technical Support Document: Technical Update of the Social Cost of Carbon for Regulatory Impact Analysis Under Executive Order 12866 (July 2015 Revision). Available: https://obamawhitehouse.archives.gov/sites/default/files/omb/inforeg/scc-tsd-final-july-2015.pdf [January 2017].
Interagency Working Group on the Social Cost of Greenhouse Gases. (2016). Technical Support Document: Technical Update of the Social Cost of Carbon for Regulatory Impact Analysis Under Executive Order 12866 (September 2016 Revision). Washington, DC: Interagency Working Group on the Social Cost of Carbon. Available: https://obamawhitehouse.archives.gov/sites/default/files/omb/inforeg/august_2016_sc_ch4_sc_n2o_addendum_final_8_26_16.pdf [January 2017].
Marten, A.L., Kopp, R.E., Shouse, K.C., Griffiths, C.W., Hodson, E.L., Kopits, E., Mignone, B.K., Moore, C., Newbold, S.C., Waldhoff, S., and Wolverton, A. (2013). Improving the assessment and valuation of climate change impacts for policy and regulatory analysis. Climatic Change, 117(3), 433-438.
Mendelsohn, R., Schlesinger, M., and Williams, L. (2000). Comparing climate impacts across models. Integrated Assessment, 1(1), 37.
Millar, R.J., Otto, A., Forster, P.M., Lowe, J.A., Ingram, W.J., and Allen, M.R. (2015). Model structure in observational constraints on transient climate response. Climatic Change, 131(2), 199-211.
Millar, R.J., Nicholls, Z.R., Friedlingstein, P., and Allen, M.R. (2016). A modified impulse-response representation of the global response to carbon dioxide emissions. Atmospheric Chemistry and Physics, 1-20.
Myhre, G., Shindell, D., Bréon, F.M., Collins, W., Fuglestvedt, J., Huang, J., Koch, D., Lamarque, J.F., Lee, D., Mendoza, B., Nakajima, T., Robock, A., Stephens, G., Takemura, T., and Zhang, H. (2013). Anthropogenic and natural radiative forcing. In T.F. Stocker, D. Qin, G.-K. Plattner, M. Tignor, S.K. Allen, J. Boschung, A. Nauels, Y. Xia, V. Bex, and P.M. Midgley (Eds.), Climate Change 2013: The Physical Science Basis. Working Group I Contribution to the Fifth Assessment Report of the Intergovernmental Panel on Climate Change (pp. 659-740). Cambridge, U.K. and New York: Cambridge University Press.
Rose, S., Turner, D., Blanford, G., Bistline, J., de la Chesnaye, F., and Wilson, T. (2014). Understanding the Social Cost of Carbon: A Technical Assessment. Report 3002004657. Palo Alto, CA: Electric Power Research Institute.


