
5
Inference When Regularization Is Used to Simplify Fitting of High-Dimensional Models
The third session of the workshop explored inference after a regularization technique is applied to reduce the number of parameters being fit in a model. In many analyses of big data, the number of variables (p) described in available data greatly exceeds the number of observations (n), which presents challenges for classical inference methods based on the assumption that n is much larger than p. Approaches for such high-dimensional inference that rely on sparsity assumptions—that the number of nonzero effects is limited—have emerged over the past two decades. However, important questions remain regarding methods for uncertainty quantification and the validity of underlying assumptions for increasingly complex questions and data sets. Daniela Witten (University of Washington) introduced novel methods for learning the structure of a graphical model from gene expression and neural spike train data, and she discussed the gap between statistical theory and practice in the context of theoretical results associated with high-dimensional model fitting. Michael Kosorok (University of North Carolina, Chapel Hill) elaborated on model selection consistency1—the consistency of the support of the selected model—and suggested alternative approaches to inference after regularization, concluding with an appeal to consider the validity of model assumptions and to develop new methods with less stringent assumptions. Jonathan Taylor (Stanford University) introduced methods for selective inference, where data splitting and data carving are used for both model selection and the inference task.
___________________
1 For additional information on model selection consistency, see Zhao and Yu (2006) and Lee et al. (2013).
Emery N. Brown (Massachusetts Institute of Technology, Massachusetts General Hospital, and Harvard Medical School) reviewed the Box-Tukey paradigm in the context of neuroscience and discussed the importance of statistics education broadly. Xihong Lin (Harvard University) described the growing size of genetic and genomic data sets and associated statistical challenges and emphasized the importance of statisticians engaging early in experimental design and data collection.
LEARNING FROM TIME
Daniela Witten, University of Washington
Daniela Witten began by describing methods for learning the structure of graphical models, which represent interrelationships between multiple random variables (Figure 5.1A), from large biomedical data sets that contain measurements taken over time. Time is incredibly important in biological processes, said Witten, providing the illustrative example of progenitor cells developing through several stages to become mature muscle fibers. If available data only represent observations from one point in time, it is challenging to develop a complete understanding of this dynamic biological process. Alternatively, averaging data representative of these different stages over time may also be misleading and may potentially undermine the goals of the inference task.
Witten presented a simplified example using gene expression data collected at discrete time points for nine genes—in real usage scenarios, there are typically thousands—with the goal of creating graphical models to represent regulatory
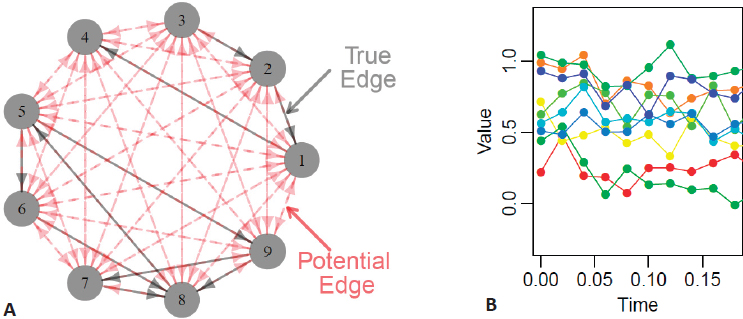
relationships between individual or groups of genes (Figure 5.1B). She proposed a model in which the observed time-course data (Yj) for expression of each of p genes can be modeled as a smooth noiseless trajectory (Xj) that cannot be directly observed, plus an error term (εj):
![]()
Witten described an additive differential equation model for the underlying noiseless trajectories as follows:

where the function fjk is unknown. Witten explained that it is not necessary to know the functional form of fjk for structure learning beyond knowing whether it is exactly zero, which indicates that there is no regulatory relationship or corresponding graph edge. Fitting this nonparametric model is challenging, explained Witten. As fjk is unknown, she described approximating it with a set of fixed basis functions ψ = (ψ1 … ψM)T (Ravikumar et al., 2009) such that

Equation 7 is linear in θjk, a vector of length M, which simplifies model fitting significantly. However, the high dimensionality of the model is still challenging, with order Mp2 unknown parameters, and the number of time points at which there are measurements (N) is typically much smaller than Mp2. To reduce the dimensionality of the problem, Witten applied a group lasso penalty to induce sparsity in the data by encouraging the vector θjk to be either exactly zero or completely nonzero (Yuan and Lin, 2006; Simon and Tibshirani, 2012).
Another critical challenge faced in fitting the model shown in equation 7 is that the underlying noiseless trajectory Xj(t) for the expression of gene k is unobserved, said Witten. In practice, analysts can apply smoothing splines or fit a local polynomial regression to the observed values (Yj) and use this to estimate the noiseless trajectories (e.g., Wu et al., 2014; Henderson and Michailidis, 2014). Unfortunately, a naïve application of this strategy results in many errors. Specifically, even if a smoothed Yj is a good estimate of Xj, the derivative of the smoothed Yj values is usually a poor estimate of the derivative of Xj because even minor differences are exaggerated when taking the derivative. Witten noted that a clever strategy is to integrate both sides of equation 7 (Dattner and Klaassen, 2015), as the integral is less sensitive to small differences between Yj and Xj and it is not difficult to estimate with observed information. This leads to an equation of the form

Replacing the derivative in equation 7 with an integral in equation 8 reduces the number of time points (N) necessary to recover the graph, in theory and in practice, Witten said. Extending Loh and Wainwright (2011), she established variable selection consistency—that the method consistently identifies the graph structure—for the standardized group lasso regression with errors in measured variables. The proposed method correctly identifies the parents of each node, which correspond to regulatory genes, with high probability and performs better than other methods in the literature.
Moving to her second example, Witten discussed graph estimation from neuron firing data collected continuously over time (e.g., Pillow et al., 2008), simplifying the example to only nine neurons although actual data sets contain measurements on many more neurons over large time periods. Each neuron can enhance, inhibit, or have no effect on the firing rate of other neurons, and a graphical model created from spike train data can intuitively present this information. Witten explained the Hawkes Process for modeling point processes (Hawkes, 1971), which defines an intensity function for neuron j (λj) representing the instantaneous probability of the neuron firing as follows:
![]()
where μj is the background intensity, ωj,k is a transfer function that encodes the effect of neuron k firing on the intensity function of neuron j, and tk,i is the time at which neuron k has spiked i times. The transfer function ωj,k contains the critical information: if it is exactly zero, there is no graph edge connecting neurons j and k. As the functional form of ωj,k is unknown, similar to the gene expression example, a set of basis functions (ψ1 … ψM) is used as an estimate. This leads to the following equation:
![]()
There is a similar equation for each of p neurons; thus, fitting this high-dimensional model requires estimating p2 transfer functions. Witten again applied a group lasso penalty to induce sparsity in the vector (βjk) of length M such that values are either exactly zero, corresponding to no edge, or completely nonzero, corresponding to a graph edge. This method has similar theoretical guarantees as in the gene expression example, specifically that the correct parent nodes are identified and that the estimated graphical models are selected with high probability from high-dimensional data sets.
Stepping back from these specific examples, Witten discussed model selection consistency in greater detail, saying that it amounts to a theoretical guarantee that as the number of time points grows, it is increasingly likely that the method will exactly recover the structure of the graph. Unfortunately, when the incorrect graph is estimated there is no theoretical backing that any of the edges are correct, so model selection consistency provides an all-or-nothing guarantee. Witten said it would be preferable to gain an understanding of the uncertainty associated with each identified edge—for example, a p-value or posterior distribution—as opposed to the entire graph. In the examples presented, Witten expressed that she was skeptical of the practical implications of model selection consistency results. She challenged the audience to imagine returning to their biological collaborators with a graphical model depicting thousands of edges derived from gene expression data covering tens of thousands of unique genes and saying that, with probability approaching 1, this graph is 100 percent correct. That statement would not be taken seriously by a collaborator because the underlying models used are at best crude approximations of complex biological processes. Model selection consistency provides theoretical grounding but requires assumptions that certainly do not hold in practice, said Witten, which points to a deep disconnect between theory and practice. Witten cautioned that overconfidence in the practical implications of theoretical results such as these may actually undermine statisticians’ credibility in the eyes of biologists and other researchers. Thus, in the unsupervised learning context, Witten described graph estimation methods as tools for hypothesis generation and not for confirmatory analyses.
DISCUSSION OF LEARNING FROM TIME
Michael Kosorok, University of North Carolina, Chapel Hill
Michael Kosorok began by saying that he is cautiously more optimistic than Witten and that establishing consistency in the structure of the graphical model is an important first step. Preferable measures of uncertainty such as a false discovery rate or p-values may follow, but a lot of work done now does not take this first step of establishing model selection consistency. With consistency established, Kosorok described different aspects of the graphical model that inferences can be drawn on, including graph structure and edge direction, the magnitude and sign of model coefficients, or overall prediction or classification error of the model on a new or test data set. While there are several approaches in the literature, including establishing asymptotic normality (van de Geer et al., 2014) or conditioning on the estimated model structure (Lee et al., 2016), Kosorok emphasized that this is a critically important area for research.
Kosorok introduced the concept of rotational invariance as an alternative method to the lasso to induce sparsity in high-dimensional complex data sets. In a simple linear model with an error term ε
![]()
where the lasso assumes sparsity in b, which is reasonable when each feature has a distinct meaning such as different demographic variables. Kosorok posed this question: What if the meanings of the features are interchangeable, as is the case when a researcher is not interested in one specific gene but rather in looking for combinations or metagenes that affect the relevant outcome? In this context, Kosorok challenged the audience to consider an unknown rotation (M) for which the product Mb is sparse, asking specifically how this rotation could be estimated and what type of penalty would be necessary to make such an approach work. While this is a poorly defined problem, he said it may be helpful to bridge the divide between the model and estimation procedures that are available now and to consider how directly these methods address the scientific questions posed.
Shifting topics to modeling interactions between variables, Kosorok reminded the audience that the lasso can be constrained to enforce strong heredity—that an interaction term can be included if and only if the corresponding individual terms are included as well. This can be achieved as a convex optimization problem with a global maximum guaranteed (Radchenko and James, 2010) and generalized to the lasso (Haris et al., 2016). Kosorok wondered whether the proposed methods for gene time course and neural spike train data can be generalized to allow for nonparametric interactions—for example, by using tensor products of the bases—and suggested that this approach could be used to interrogate the additive structure of the model. Another way to think about interactions is as one part of a quadratic term (e.g., (X1 + X2)2 contains the interaction X1X2), said Kosorok, who suggested including squared terms in the model to capture interactions and to allow slight departures from linearity. With this approach, it may be important to enforce strong heredity: (1) if either X1 or X12 are included, both must be included; and (2) if the interaction term X1X2 is included, both first-order and second-order terms must be included. A model containing all first-order terms, second-order terms, and pairwise interactions is preserved under arbitrary rotation and could be extended to allow for sparsity under unknown rotation, said Kosorok.
Feature selection for a nonparametric regression is a related but distinct problem, in that if a variable is removed from the model, all of its interaction terms are also removed. Thus variable selection is clearly different from removing coefficients in the model and is different from grouping. Kosorok said it is possible to perform feature selection in a consistent manner that improves prediction error but noted that there is relatively little research in this area. One technique called reinforce-
ment learning trees (Zhu et al., 2015) adaptively selects features while generating random forests and can significantly reduce error and improve convergence rates compared to so-called greedy approaches that minimize the immediate mean squared error. Kosorok clarified that these results are for nonlinear models, whereas the lasso performs better than reinforcement learning trees in terms of prediction error for linear models.
Kosorok concluded by remarking that much work remains in the area of inference after regularization is used to simplify large, complex data sets. He encouraged researchers to decide carefully what elements of their model to perform inference tasks on, emphasizing that this decision must be clearly connected with the research goals. Although his presentation did not cover all of the methods of post-regularization inference, Kosorok noted that future methods should try to avoid relying on strong assumptions.
PANEL DISCUSSION
Following their presentations, Daniela Witten and Michael Kosorok participated in a panel discussion. A participant commented that the skepticism expressed by Witten regarding the results of unsupervised analyses in which the model being used is known to be an oversimplification should be extended to the context of supervised analyses as well. The participant noted that the supervising parameters used are often subjective opinions or estimates and are not necessarily reliable, so caution must be exercised even in supervised analyses. Given that suggested models are crude approximations of complex biological processes, the participant asked if models should be interpreted as a projection of reality onto the assumed model space rather than an actual model of biological reality. Witten answered that her use of basis expansions is predicated on that idea, but she expressed concern that the model misspecification may be more fundamental than not having the appropriate basis set—for example, if the model is not additive or the biological process is stochastic and cannot be modeled with additive differential equations. The old adage applies, said Witten, that there are known unknowns and unknown unknowns, and the latter is most concerning in the context of complex multivariate data sets. She added that it is not too difficult to develop a model for expression of one gene or firing of one neuron by specifying univariate distributions, but the real challenge is modeling the interactions within groups of genes or neurons as a multidimensional multivariate distribution. Regarding the first question, Witten responded that, in the supervised context, it is not a problem that a specific response is measured or provided to the analysts, although there will always be some irreducible error associated with that response that cannot be modeled. Nonetheless, the objective of a supervised analysis is to address reducible error as much as possible given a noisy response, whereas in the unsupervised context the response is totally unknown.
Another participant asked whether the structure of the graphical model was assumed to be stationary or was allowed to change over time. In a related comment, the participant drew the comparison to mixed effects modeling in more traditional longitudinal data settings, saying that independent replication across subjects allows inference in this context. He asked if independent replication—for example, across gene expression data collected from multiple subjects—could be used to support first-order inference in this context. Responding to the first question, Witten said her method for generating graphical models from time course data does require the assumption of stationarity in relationships over time, and allowing the graph to change form over time is a more challenging topic for future research. Answering the second question, Witten said that the method she introduced assumes that noise from each measurement time and gene is independent and identically distributed, which avoids the mixed effects formulation and allows the simplest model. She noted that one could argue that the noise would be correlated across time points or genes because of the measurement technologies, which are both valid points that will make modeling even more challenging. Kosorok asked if it would be helpful to consider parametric bootstrapping to obtain, shuffle, and reapply residual estimates that are assumed to be independent and identically distributed to see if stability is maintained. Witten answered that stability selection has been used in the literature. Referring back to Genevera Allen’s presentation, Witten described the best available option as generating a rank list of graph edges based on different data samples and graph estimation techniques, though this approach still falls short of fully quantifying uncertainty.
Reiterating Witten’s comment that graphical model estimation from large, complex multivariate data sets should be viewed as a way of generating hypotheses for future experimental investigation, one participant asked how the field could better communicate the uncertainty associated with these exploratory analyses. Kosorok answered that statisticians equivocate more than other fields, which may come across as less intellectually strong even though the equivocation is honest and grounded in available data. Ultimately it comes down to establishing trust and building partnerships with collaborators that leads to significant advances. Witten agreed, saying that while it is easy to get results that are incorrect, it is much more difficult to produce results that statisticians trust. Statistical training is powerful because it encourages a nuanced understanding of these issues, but this double-edged sword also presents a challenge for the field and in how statisticians interact with their collaborators. Given the large disconnect between statistical theory and practice, Witten commented that some of the methods published in the biology journals are much simpler than the newer methods being published in statistics journals. Following up on this comment, one participant asked if simple pairwise correlations across time and subjects are the types of methods Witten uses in biology papers. Witten responded that computing and thresholding correlation values
is often all that is needed in practice: they can often answer a biologist’s scientific question much more simply and with fewer assumptions than a more complicated method like the graphical lasso. Kosorok suggested that another approach is to use the estimated model to try to reproduce data sets and then to match moments, which is done in some stochastic processes that cannot be formulated as likelihood models.
An online participant asked if there are guidelines or methods to selecting tuning parameters for regularization methods, observing that the results of regularization techniques are highly sensitive to both the random sample used and the value of these parameters. Witten responded that, in the context of supervised learning, the gold standard is to evaluate test error on a validation data set. In the context of unsupervised analyses, she continued, there is no gold standard for selecting tuning parameters. Graph estimation is useful to generate a relatively simple representation of large, complex data sets, said Witten. If the tuning parameter is too small, the graph is unreadable because too many edges are included; if the tuning parameter is too large, there are no edges estimated. Finding the appropriate balance is a subjective decision made by the statistician and his/her collaborators based on the level of detail that is desired in the resulting graph, said Witten. Kosorok commented that tuning parameter selection is challenging and usually done in an ad hoc fashion. He did not know of rigorous methods to suggest as a more satisfying alternative and suggested that future theoretical studies that are appropriately skeptical could help inform approaches that are slightly more automated.
SELECTIVE INFERENCE IN LINEAR REGRESSION
Jonathan Taylor, Stanford University
Jonathan Taylor delivered a methodological presentation on selective inference, which he described as a compromise between exploratory and confirmatory analysis that allows testing a hypothesis suggested by the data. Using an illustrative example of mutation-induced human immunodeficiency virus (HIV) drug resistance, his analysis goal was to build an interpretable predictive model of resistance from a sequencing data set containing 633 distinct viruses with 91 different mutations occurring more than 10 times in the sample. Assuming sparsity in the 91 features is reasonable, and Taylor showed the results of an ordinary least squares fit to the data with only one or two features having large coefficient values. Taylor applied the square root lasso (Belloni et al., 2014; Sun and Zhang, 2012; Tian et al., 2015) in part because it does not require information about the level of noise in the data set to specify a theoretically justifiable tuning parameter. The lasso selected a subset of approximately 15 variables that represent mutation sites in the viral genotype, several of which are known in the HIV resistance literature. Fitting a regression
model—for example, a parametric Gaussian model—using these parameters will yield p-values or confidence intervals for each variable; however, these convey no information about significance and cannot be used because the data were used to select the model. Taylor said a significant challenge of selective inference is that there are good methods for model selection, but they use the data and therefore require new tools for reporting and interpreting the significance (Benjamini, 2010).
One approach is to apply data splitting (Hurvich and Tsai, 1990; Wasserman and Roeder, 2009), in which a portion of the original 633 virus data set is used for variable selection and the remaining data are used for the inference task. Underlying this approach is the justification that the second portion of the data used for model fitting is independent of the first portion of the data used in model selection, explained Taylor. After splitting the data set, the square root lasso identified 11 variables; while there was some overlap from the first case described above, several differences emerged because different data were used in the two cases. Fitting a parametric Gaussian model with these variables to the unused portion of the data resulted in p-values or confidence intervals that, in principle, were justified, as the data used to select variables were independent of the data used to fit the model. Taylor cautioned that the implicit assumption in these measures of significance was that the model used for regression is a reasonable representation of the underlying process. This is in contrast to the use of data splitting in the context of cross-validation or estimating prediction error, which requires essentially no assumptions. Taylor broadly described a model as a collection of distributions that are drawn from the same space that the data came from, specification of which requires a decision on the part of the statistician. Only after the model has been specified can statistical concepts such as estimators, hypothesis testing, and confidence intervals be defined. While this is well established in classical statistical contexts, Taylor explained that in the data splitting context the goal is to use the data to choose one such model by conditioning on the first-stage data (Fithian et al., 2014; Tian and Taylor, 2015).
Taylor presented a graphical representation of the process of data splitting (Figure 5.2A): taking a random split (ω) from the original data set (X, y) results in the first-stage data (X1, y1), from which the square root lasso selects a subset of variables (E). In the example above, the subset of variables E corresponds to the 11 mutations that were used in a Gaussian parametric model to fit the remaining second-stage data. Yellow nodes correspond to random variables that are conditioned on, grey nodes correspond to random variables that are marginalized over, and blue nodes correspond to random variables that require specification of a model by the analyst. Taylor compared this graphical presentation of data splitting to the Box-Tukey paradigm for statistical inference, in which researchers collect exploratory data (Xe, ye), perform exploratory analyses to identify variables of interest (E), and collect confirmatory data (Xc, yc) on these variables for subsequent
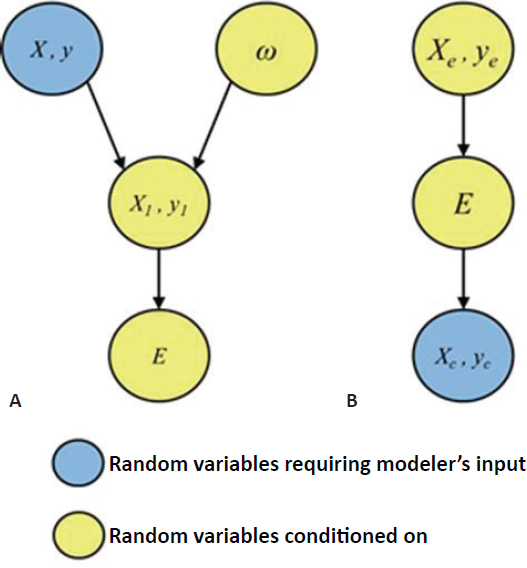
confirmatory analysis. In the Box-Tukey paradigm, the exploratory data and variables of interest are conditioned on and model specification occurs after variables have been selected, whereas in the data splitting representation model specification occurs before variables are selected (Figure 5.2B). There is a trade-off in data splitting between the fraction of data used in the first-round screening of variables and the fraction saved for inference in the second round. Using a synthetic data set, Taylor showed that as more data are used in the first round, the statistical power of second-round inference decreases; conversely, as more data are retained for second-round inference, the probability of identifying all significant variables decreases.
STATISTICS AND BIG DATA CHALLENGES IN NEUROSCIENCE
Emery N. Brown, Massachusetts Institute of Technology, Massachusetts General Hospital, and Harvard Medical School
Emery N. Brown began by describing his participation in the Brain Initiative, which was designed to foster development of new tools to advance the field of neuroscience. He emphasized that focusing solely on the creation of tools to generate more data was insufficient and therefore must be complemented by both statistical methods and analysis procedures to effectively utilize new data streams. Building on this motivation, Brown reviewed the Box-Tukey paradigm for statistical reasoning under uncertainty, which combines the idea of iterative model building with the delineation between exploratory and confirmatory analyses (Tukey, 1977; Box et al., 1994). Describing the Box-Tukey paradigm in the context of neuroscience (Kass et al., 2005), Brown remarked that the underlying conceptual model for neuroscience experiments is the regression model: the analyst is interested in how a subject’s response to stimulus changes as different covariates are changed. In addition to being multivariate, neuroscience data are highly dynamic; however, most neuroscience data analysis methods are static, thus filtering out important information. Brown showed a few diverse examples of dynamic neuroscience data, including neuron spike train data, images produced by functional magnetic resonance imaging and diffuse optical tomography, and behavioral or cognitive performance data.
Brown presented a case study from his anesthesiology research evaluating electroencephalogram (EEG) data collected from patients under general anesthesia, which he explained is a high signal-to-noise ratio problem because background noise from movement is greatly reduced. Solving these problems may provide insights into strategies to evaluate low-signal problems that are more challenging. A video recording showed one patient’s EEG signal before, during, and after administration of an anesthetic, and he called attention to the clear difference in waveforms recorded as the patient progressed from awake to anesthetized. In addition to this temporal dynamic, Brown said there are also spatial differences and patterns; he showed EEG data collected at 44 different locations on a patient’s head as the dose of anesthetic is increased then decreased over a period of about 2 hours. The spectrogram at each location shows the movement of a 10 hertz (Hz) oscillation from the back of the brain to the frontal areas as anesthesia is induced, remaining in the front while the patient is unconscious and receding to the rear as drug levels decrease.
While the spatial and temporal dynamics have been known for more than 30 years, Brown and colleagues collected data on this process and combined statistical methods with experimental and modeling studies to develop a better
mechanistic understanding of how the medication works. By finding the eigenvalues for the cross-spectral matrix at each frequency as a function of time and taking the ratio of the first eigenvalue to the sum of all eigenvalues, Brown calculated the global coherence of the EEG signal. If the first eigenvalue and thereby the global coherence are large, it suggests there is clear directionality to the EEG signal at that frequency and time. He showed the time course of global coherence for six patients that showed strong coherence (e.g., between 0.7 and 0.8) at 10 Hz when they were unconscious, as indicated by their lack of response to verbal questioning (Figure 5.3). Combining this observed behavior with knowledge of drug binding sites, anatomy of the brain, and modeling work suggesting that the thalamus is active over this time, Brown and colleagues inferred that the stand-
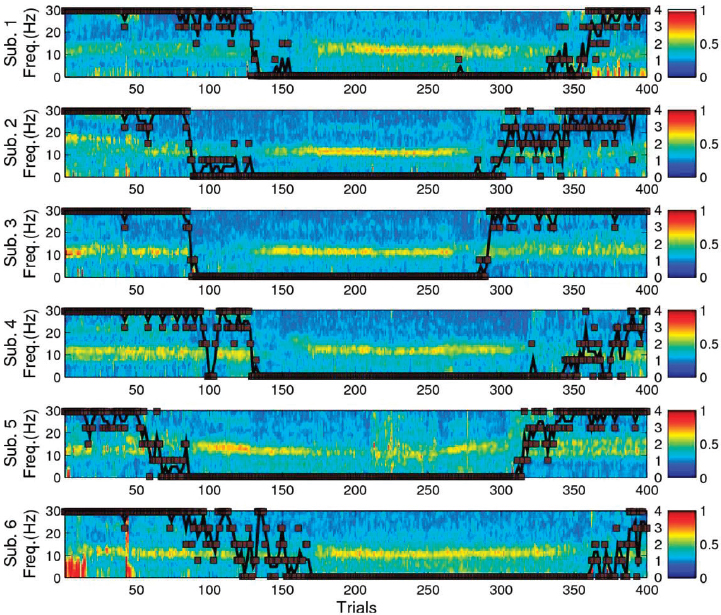
ing 10 Hz oscillation in the frontal region of the brain under anesthesia is driven by rhythmic activity between the thalamus and frontal cortex (Ching et al., 2010; Brown et al., 2011; Cimenser et al., 2011; Purdon et al., 2013). The reason this could cause unconsciousness, Brown explained, is that with slow, large amplitude oscillations, individual neurons fire infrequently, making it extremely difficult for regions of the brain to communicate. Follow-up experiments designed to test this hypothesis in rodents and monkeys verified the presence of these oscillations and phase-limited spiking activity.
Brown commented that it is often challenging to identify and apply statistical methods to answer a given question. Moving to a second illustrative example comparing the EEG spectra of cohorts of 0- to 3- and 4- to 6-month-old children under anesthesia—which appeared visually different, as the younger age group showed no oscillations above 5 Hz—he posed the seemingly simple question of whether there was a statistically significant difference in power as a function of frequency between the two age groups (Cornelissen et al., 2015). Simply plotting the power of the two groups’ spectra versus frequency with 95 percent confidence intervals is sufficient for publication, but it is more appropriate to compute the difference between the two groups and construct a confidence interval around that. Brown described calculating the 95 percent confidence interval for the difference using bootstrap methods (Ramos, 1988; Hurvich and Zeger, 1987) and showed the upper and lower confidence bounds on the difference as a function of frequency. These are the curves that allow meaningful inference, said Brown, and while this is a trivial question to pose, it is not trivial to answer. Furthermore, this analysis was done for a single point in time, whereas the EEG spectra is dynamic over time; the latter presents additional challenges in identifying and applying statistically appropriate methods.
Shifting topics to statistics education, Brown said there is an unacknowledged epidemic of collective ignorance of statistics. Solutions such as delivering short courses for disciplinary scientists in statistical methods do not solve the underlying problem. It is critically important to introduce probability theory, statistics, and data analysis content earlier in education, where the curriculum accommodates repetition, so that students have sufficient time to practice and develop statistical intuition. Brown suggested that a repetitive, reinforcing curriculum be developed to introduce students in middle and high school to statistics, analogous to the way algebra is taught. Brown said this would change science dramatically. Trained statisticians are good at making inferences, and it is critical to build this capacity in students at all levels of coursework. He remarked that the fields of engineering and physics are effective at providing students with an understanding of fundamental principles, and he strives to teach concepts as fundamental principles and paradigms that are retained by students, as opposed to merely teaching a series of tests to apply based on different types of data.
Responding to a common characterization of statisticians as merely contributing to work done by their scientist collaborators, Brown asserted that statisticians are scientists too. With increasingly abundant data and the emerging field of data science, now is the time for the field of statistics to flourish. Statisticians need to consider themselves as scientists, he said, and to encourage future statisticians to become disciplinary experts or even experimentalists, pointing to the irony that statisticians are trained in design of experiments but rarely design their own experiments. Recounting personal experiences, Brown said that a high fraction of neuroscience researchers come to the field from physics and describe themselves as physicists studying neuroscience; statisticians should adopt a similar model of bringing their fundamental training to different scientific domains by becoming scientists in those domains. The field of statistics needs a credo, Brown concluded, that there is no uncertainty that statisticians cannot quantify.
DISCUSSION OF STATISTICS AND BIG DATA CHALLENGES IN NEUROSCIENCE
Xihong Lin, Harvard University
Xihong Lin provided several examples of diverse data types that fall under the umbrella of big data, including neuroimaging, whole genome sequencing (WGS), and real-time pollution or activity monitoring collected from smart phones. She emphasized that integrating such different types of data is a critical challenge. The real value of big data is in its analysis and the inferences it allows, and the potential applications and benefits of data science are diverse. For example, in the field of health care, data science can help illuminate the causes and mechanisms of diseases, guide development of precision medicine and preventative actions, and inform health policy decisions, said Lin. She described the core of data science as being composed of statistics, computer science, and informatics, with the general goal of transforming data into knowledge (which requires inference). Reiterating that statisticians must be engaged as scientists, she pointed to the history of biostatistics as a successful engagement that resulted in better research. Lin described several lessons learned from the field of biostatistics: to always engage in cutting-edge research, to let collaboration drive method development, and to allow disciplinary scientists to be strong advocates for statisticians. She hopes that data science can continue to build on this experience, noting that it will be critical to build equally strong alliances with computer scientists and informaticians, as well as domain scientists, as each discipline brings unique and necessary skills.
Lin introduced the human genome project, launched 17 years ago with the goal of conducting WGS on the approximately 3 billion base pairs in the human genome. WGS is comprehensive compared to genome-wide association studies that cover
only common variants accounting for less than 10 percent of the genome. Since the completion of the human genome project in 2003, a series of larger sequencing projects have been announced, including the 2015 National Heart, Lung, and Blood Institute’s Trans-Omics for Precision Medicine Program, which will produce WGS data for 100,000 to 150,000 subjects;2 and the 2016 National Human Genome Research Institute’s Genome Sequencing Program, which plans to collect WGS data on 200,000 individuals.3 Combined, these projects will cover over 300,000 individuals and facilitate the even more ambitious Presidential Precision Medicine Initiative, which includes WGS for 1 million people. To convey the size of the data sets resulting from such large projects, Lin explained that WGS for 300,000 people corresponds to 4 × 10¹⁶ sequenced bases—on the same order of magnitude as the number of grains of sand on a large beach. Among the 15,000 individuals who have already been sequenced, 44 percent of the single nucleotide polymorphisms (SNPs) are observed only in one person, and thus the data are characterized by high sparsity. That is, in a data matrix with WGS on 15,000 individuals (rows) and 190 million columns, 44 percent of columns have only one nonzero value.
Lin explained that the first goal of WGS is to identify genetic regions that are associated with specific diseases or traits, which is analytically challenging because of the large size of the data sets and the low signal-to-noise ratio. With so many rare variants across all people, the simplest SNP analysis is not applicable. The common rare variant analysis methods developed for dense alternatives, such as sequencing kernel estimation (Wu et al., 2011), are subject to power loss when signals are sparse in a region. In such cases, tests for sparse alternatives—for example, those based on Generalized Higher Criticism (Barnett et al., 2016; Murkerjee et al., 2015)—are necessary to increase power.
Ten years ago, Lin explained, statisticians described the “small n, large p” data set problem—in which the number of variables with available data (e.g., 20,000 gene expressions) greatly exceeds the number of observations (e.g., dozens of patients)—but now larger and larger sample sizes have created a “large n, huge p” problem. For example, the National Human Genome Research Institute’s Genome Sequencing Program contains data from 200,000 subjects consisting of approximately 1 billion SNPs. Because the majority of the human genome contains rare variants, p increases with n and additional rare variants will be observed as more samples are sequenced. Thus it is critically important that statistical analysis methods are scalable, said Lin. Because each chromosome contains large intergenic regions that do not code for a specific gene (i.e., non-coding regions), it is difficult
___________________
2 The website for the Trans-Omics for Precision Medicine Program is https://www.nhlbi.nih.gov/research/resources/nhlbi-precision-medicine-initiative/topmed, accessed January 6, 2017.
3 The website for the National Human Genome Research Institute’s Genome Sequencing Program is http://gsp-hg.org/, accessed January 6, 2017.
to define the appropriate unit for WGS analysis. This is one area where it will be important to incorporate known biological information, such as functional and annotation information, said Lin, which will improve the utility of results.
Moving to the importance of including statistical reasoning in the design of modern clinical trials, Lin described research using cell phone record data to construct networks representing social interactions and how this information can be used to improve HIV interventions. In such networks, random sampling may be less effective, as it is unlikely that a highly connected hub node is selected at random. A more effective strategy may be to use the data to estimate networks, to deliberately sample the hubs, and to prioritize these individuals for interventions because they come in contact with many more people. This strategy likely introduces bias that must be accounted for in analysis by developing appropriate inference procedures. It is critically important to include statisticians early in the research design process of such network-based studies, and other biological studies broadly, said Lin. This can both help address challenges such as batch effects and lead to more reproducible data generation and analysis techniques.
Lin closed by reiterating that statisticians should do the following: (1) collaborate with domain scientists on cutting-edge problems and let these interactions drive statistical method development, (2) incorporate known domain science into the inference task at hand, (3) strive to move beyond point estimation by including confidence or uncertainty statements associated with inferences from big data, and (4) make realistic assumptions and develop new methods with less stringent assumptions. Regarding the last point, Lin elaborated that many problems in biology have a low signal-to-noise ratio, but many of the methods developed for variable selection require relatively strong signals and are likely not applicable in this context. Thus more methods allowing for weak signals need to be developed. Looking toward the future, Lin said that with the increasing size of available data sets and the spread of cloud computing, it will be increasingly important to make sure that methods are scalable and computationally tractable. Related to this, Lin suggested that funding agencies consider developing infrastructure grants to help establish cloud computing resources for efficient sharing and archiving of biomedical data and beyond.
PANEL DISCUSSION
Following their presentations, Emery N. Brown and Xihong Lin participated in a panel discussion. The first participant asked the speakers how they handle the source code for any methods developed and if it is made available to the public. Brown responded that his lab makes all code freely available to the public through various repositories, although practices vary across labs, fields, and disciplines. For example, code for spectral analysis often goes to a different repository than code
for neuroimaging analysis, which is shared through a consortium of repositories of which Massachusetts General Hospital is a member. Similarly, Lin said that all code from her group is made publicly available, and she reiterated that it is important for statisticians developing software to understand the practices and data formats used by domain science collaborators. Furthermore, she encouraged statisticians writing code to consider the emergence of cloud computing, as software that works well for clustered computing may not be effective in the cloud environment.
A bioinformatics master’s student commented that graduate programs want students with strong computational and statistical training; however, there was little opportunity or incentive to engage with these concepts in high school or as an undergraduate biology major. Brown responded that introducing statistics earlier and more broadly in education is a critical opportunity; a fraction of the resources dedicated to training current scientists in statistics should be allocated for middle and high school students. In 5 or 10 years, these students will be postdoctoral researchers, graduate students, and undergraduates, he said, and scientific research will suffer if they are not trained properly.


