
4
Applying Item Response Theory Models to Highway Safety
In this chapter, we describe a formal statistical model for estimating a carrier’s overall safety using item response theory (IRT) models introduced in Chapter 3. The current Behavior Analysis and Safety Improvement Categories (BASICs) methodology, which uses data regarding violations collected from various types of truck and carrier inspections, has many features in common with IRT models. In an inspection, numerous violations are assessed, and each violation is associated with a single BASIC. If a violation is similar to a “test item,” then this approach of assigning violations to the BASICs essentially corresponds to a multidimensional confirmatory IRT model (refer to Figure 3-1). That is, the various BASICs are the multiple factors of the IRT model, and the assignment of violations to these factors is known, and so it is a confirmatory model. An IRT model is basically a factor analysis model for dichotomous (Y/N) data (e.g., test items), which is the case for the violations that are coded as present or not. Also, in obtaining a score on a given BASIC, each violation has a severity weight attached to it. These are akin to the role of the item difficulty and discrimination parameters of an IRT model, which treat items differently depending on their frequency and how related they are to the underlying factor(s). The main difference is that the BASICs methodology uses severity weights that are dependent on expert opinion and empirical observations in a less empirical and static manner, whereas the item difficulty and discrimination parameters are estimated based on a formal combination of the observed data and expert opinion through the use of priors that are updated dynamically as more data are collected.
Thus, the severity weights for both SMS and in an IRT model are intended to be related to the underlying factors for the outcomes, but in the case of an IRT model, the data will ultimately refine the weights to do so should expert opinion be wrong. To summarize, the BASICs methodology is essentially a multidimensional IRT model that uses expert opinion and empirical data together in a less scientifically prinicipled way.
Despite the conceptual similarities, the IRT model offers several advantages over the existing BASICs methodology. The IRT modeling framework can do the following:
- account for the probability of being selected for inspection by explicitly modeling the likelihood a carrier is inspected, as a function of carrier characteristics (e.g., so if it were known that carriers of type X were inspected more often than carriers of type Y, everything else being equal, including their approach to safe operations, then increases in percentile ranks for carriers of type X over type Y should be reduced);
- provide a basis with which to evaluate how data insufficiency could impact safety ratings of carriers (e.g., impact of inaccuracy of vehicle miles traveled on safety ratings) since it yields measures of uncertainty of the latent safety score for each carrier, unlike the current deterministic algorithm;
- provide a basis to more rigorously and empirically evaluate the utility of individual violations since it yields measures of relevance of individual violations—in other words, the extent to which each violation is related to the latent safety construct;
- allow severity weights to change over time (e.g., as violations become more or less prevalent);
- determine empirically whether severity weights should be different for trucks versus passenger carriers;
- enable adjustment for factors that may be outside a carrier’s direct control or differ systematically (e.g., state-level and seasonal effects); and
- accommodate new violations over time easily, which is not the case for other test theory models that might have been proposed for use.
Thus, overall, the IRT modeling approach enhances the transparency of the safety evaluation system and provides approaches to evaluate it.
A NEW MODEL
We use the following notation to lay out the modeling strategy. The index i (i = 1,…,n) denotes carriers. The total number of inspections for carrier i is denoted as Ni. The index j (j = 1,…,6) denotes the inspection level/type (see the Glossary for explanation of the six inspection levels/types). Based on inspection type j, a subset of the 899 possible items are actually inspected; these items are represented by the index k. The set of possible items for inspection type j is denoted by Sj, j = 1,2,…,6. Nij is the number of inspections of type j for carrier i; thus the total number of inspections for carrier  is the number of inspections for carrier i of type j where item k was inspected, i.e.,
 ![]() Finally, Yijk = 0,1,…, Nijk is the number of times item k was found to be in violation among the Nijk inspections of type j. Note that the grand total of inspections where a particular item k was inspected would be given by
Finally, Yijk = 0,1,…, Nijk is the number of times item k was found to be in violation among the Nijk inspections of type j. Note that the grand total of inspections where a particular item k was inspected would be given by ![]() and the total number of times the item was found in violation is
and the total number of times the item was found in violation is ![]()
The model is specified in stages. For the first stage, the total number of inspections of type j for carrier i, Nij, is assumed to follow a Poisson distribution (a common distribution used for count data) with parameter χij. This parameter represents the average number of inspections for carrier i of type j. Here we decompose χij as χij = Eiλij, where λij is the rate at which carrier i receives inspections of type j, and Ei is the exposure for carrier i (e.g., VMT). So the rate, λij, is based on the average number of inspections normalized by the ‘exposure’ (the exposure can be thought of like a denominator). The rate, λij, is allowed to depend on carrier-level characteristics, Xi, that may influence the rate at which a carrier receives inspections. Formally, the first stage of the model for each inspection type j = 1,2,…, 6 is given by
| Nij ~Poisson (Eiλij) | (4-1) |
| log (λij) = γ0j+ Xiγ1j | (4-2) |
The covariates (carrier-level characteristics) included here should not be inherently related to safety (such as driver training programs), but rather reflect the operational characteristics of the carrier (e.g., where they travel the most or register, cargo type, and type of roads traveled). The parameters γ0j and γ1j are coefficients corresponding to carrier-level characteristics; the values of the coefficients may depend on the inspection type j.
While a simpler model on Ni instead of (4-1) and (4-2) could be posited, the model above explicitly allows for the possibility that different types of inspections are more frequent, and that different carriers receive certain types of inspections more frequently than others. These possibilities are embedded in the model by allowing the γ0j and γ1j to be different for different inspection types. For instance, carriers that have a higher percentage of their operations in cold-weather states may receive a lower number of undercarriage inspections during the winter. Finally, there may be many carriers without inspections and some with a very large number of inspections. Hence a zero-inflated Poisson (ZIP) model will likely be needed in lieu of Equation (4-1) (Lambert, 1992). Such a model allows for more zeros (i.e., carriers with no inspections of type j) than is implicity assumed by the Poisson model.
The next stage is to model the number of violations for item k, Yijk, for each inspection type j = 1,2,…,6 where the kth item is inspected (i.e., Ind (k ∈ Sj) = 1). So we assume for Nijk > 0, i.e., the number of inspections of type j where item k could be assessed is nonzero, that Yijk follows a binomial distribution with sample size Nijk and probability (of a violation) that follows a generalized linear model. In particular, a logit transformation of the probability is a function of three ‘parameters’: θi, an “overall” unobserved (or latent) safety measure for carrier i; αk, parameters that capture how strongly item k is related to the latent safety measure θi for carrier i, which take the place of severity weights, and which determine how well that violation discriminates safe versus less safe carriers, and βk, which when transformed as  represents the prevalence of violation k for carriers with an average safety measure (θi = 0). As such, these parameters help us determine in a data-driven way how different violations help us differentiate the safety levels of carriers. Expert opinion can be incorporated into these models in terms of different violations’ ability to “discriminate,” which is not quite the same as the expert opinion that was used to determine severity weights in the SMS.
More formally, the model is written as follows:
| Yijk|[Nijk > 0] ~ binomial (Nijk, pik) | (4-3) |
| logit (pik)1 = βk – αkθi | (4-4) |
| θi ~N(0,1) | (4-5) |
___________________
1 Logit(p) is log(p/(1-p)).
Large, positive values of the latent safety measure θi indicate a safe carrier; large negative values of θi indicate a less safe carrier; and θi = 0 represents “average” carriers. Chapter 5 elaborates on how θi’s can be used to identify carriers that need interventions from the Federal Motor Carrier Safety Administration (FMCSA).
The number and type of violations for each carrier allow us to identify and estimate both the ‘regression coefficients’, αk, βk, and the safety score θi. The αk are estimated based on different violations occurring together (or not), and βk (as discussed earlier) is a function of the prevalence of violation k given a safety score of 0. For the safety score θi, the probability of a violation increases (or decreases) based on the sign of αk as θi increases. So the complete set of violations for a carrier along with the αk and βk (which are estimated across all the carriers) provides the information needed to estimate θi (along with the assumption about the shape of the distribution of the θi’s, which is assumed to follow a standard normal distribution (bell-shaped curve)).
Modeling the number of violations of item k for each inspection type j separately reduces biases related to aggregating counts of violation k, i.e., Yi.k that may arise by instead modeling Yi.k|Ni.k. For instance, aggregating could artificially attenuate (or induce) correlation among violations that are (or are not) part of the same inspection type.
We note that some might feel it more natural to specify the unit of analysis at a less aggregate level. While the majority of IRT applications involve modeling hierarchically structured data, there are applications using the aggregated (level 2) units (see, e.g., Camilli and Fox, 2015). The panel felt that the computational efficiency of the aggregated analysis would be more practical for implementation purposes to the FMCSA.
MODEL ESTIMATION
We anticipate the model will be refitted and updated on a monthly basis, similar to the current practice of updating the BASIC measures to incorporate new data. Re-estimating the model on a monthly basis has the advantage of allowing the severity weights to be data-adaptive in the long run. That is, as certain violations become rare, the information they provide regarding the latent safety scores diminishes, which would be reflected in the parameters αk becoming unimportant.
We advocate a Bayesian approach for model estimation for several reasons. First, the Bayesian approach is the most natural way to incorporate expert opinion into the model. One area where this could be particularly beneficial is to enable the use of information that led to the development of severity weights in the current Safety Measurement System (SMS) (and/or more refined information of that type) in order to specify infor-
mative priors for the discrimination parameters/factor loadings (αk’s). That is, if violation k is a priori thought to be more related to safety, then its prior could be centered at a higher positive value. Note that when we use such informative priors, the ultimate estimates will be a combination of the informative prior and the data. Eventually with enough data, the data will “swamp” the prior.
Second, in creating a scoring system for carriers, it is also important to convey a sense of the degree of uncertainty in the rankings or scores. The Bayesian framework also provides the most natural way to accurately quantify this uncertainty. In other words, this estimation method can produce credible intervals (analogous to confidence intervals in frequentist statistics) for the safety measure of each carrier, θi. This is particularly important for carriers that have received few inspections. This approach can therefore produce a safety measure for all carriers that have received at least one inspection, and the credible interval can convey that given the amount of available data, there is little precision in the estimated safety measure. Posterior probabilities of being in the lower and higher percentile can also be easily computed; details can be found in Chapter 5. Third, this estimation approach enables the use of “shrinkage”-type priors, which will allow more precise estimation in the presence of sparsity. In particular, for low-prevalence violations, such priors will allow corresponding parameters to be estimated with moderate precision. Fourth, the proposed models could be fit using standard open source software.2 Finally, it is important to point out that if there are violations that FMCSA believes are important to retain regardless of the empirical evidence, they can always do so through the use of priors that are either very focused on specific values or are deterministic. For instance, if some hazmat violation rates were found not to be strongly associated with safe operations, but FMCSA thought important to retain, instead of downweighting those violation rates through updating of a prior, FMCSA could specify a prior distribution that assigns high a priori probability to the severity weights of those violations.
ITEM RESPONSE THEORY MODEL MODIFICATIONS
In this section we propose a number of extensions and modifications to the model described above. These extensions incorporate some of the unique features of the BASIC data including data sparsity/sufficiency given that some carriers are never inspected; the longitudinal nature of the violations and approaches to more heavily weight recent violations;
___________________
2 For example, JAGS or winBUGS could be called from R. However, with large amounts of data, specialized software might be more computationally efficient.
and the multidimensional nature of the violations versus assuming a single dimension for safety. Chapter 5 addresses additional considerations such as whether motor carriers and freight can and should be combined and state-level effects.
Joint Modeling of the Number of Inspections and Frequency of Violations
The motivation for this extension to the model is that the total number of inspections for carrier i, Ni, and/or the number of each type of inspection, Nij, can provide information about the safety of the carrier. If unsafe carriers tend to get inspected more (or less) than safe carriers, then this relationship can be modeled by including additional effects in the model that link the rate of inspections and the probability that violations are found during an inspection. For example, unsafe driving violations (e.g., speeding) often precipitate an inspection, such that there may be a correlation between number of inspections and safety. The information that a carrier of more than a few vehicles had no inspections during a month could be indicative of a very safely operating carrier, and could be helpful in identifying such carriers. However, whether this should result in IRT percentiles in specific instances in this application is unclear and would need some research.
Specifically, the model for the number and rate at which carrier i receives inspections of type j, Equations (4-1) and (4-2) can be augmented to include an effect bi:
| Nij ~Poisson (Eiλij) | (4-6) |
| log (λij) = γ0j + Xi γ1j+ bi | (4-7) |
This inspection effect of each carrier, bi, is then linked to the latent safety measure θi in Equation (4-4) through
bi|θi ~ N(ηθi,σb|θ)
Of particular interest here is the association between the carrier’s safety θi and inspection effects bi, which is expressed by the regression coefficient η. A negative value of η suggests that safe carriers have a lower rate of inspections than unsafe carriers, while a positive value suggests that safe carriers have a higher rate of inspections. When η is equal to zero, then there is no benefit to this joint modeling approach because the number of inspections Nij provides no information about the safety of the carrier (Hatfield, Hodges, and Carlin, 2014).
To allow more flexibility in the relationship between “safety,” θi, and carrier-level heterogeneity in the violation rate, bi, we can consider more flexible distributions than a bivariate normal, e.g., using variations on Dirichlet process mixtures of normal distributions (which is a way of putting probabilities on different normal distributions that can be updated to reflect new data), that might also allow a nonlinear relationship between θi and bi.
Models That Downweight Violations Further Back in the Past
An additional extension of the model can downweight violations that occurred further in the past, similar to time weights used in computing BASICs. However, we advocate letting the weights change smoothly over time, rather than using time severity weights that change at discrete time windows, so that changes in the safety scores occur smoothly.
We assume safety scores are estimated based on a 24-month window of monthly counts of inspections and number of violations. The index t will take values, t = –24,…,0 (months). The model construction provides an overall safety measure for the 24-month window and downweights violations from earlier in the window.
Let Yijkt indicate the number of type k violations received for inspections of type j by carrier i, in month t. The variable Nijkt is the number of inspections carrier i received of type j with violation k in month t. Also, Eit is the exposure (e.g., VMT) of carrier i in month t. The key changes from the previous model include the number of inspections and violations now being measured each month (so an index of t has been added), the exposure and rate parameters for the number of inspections for each carrier now being indexed by t as well, and the IRT parameters, βkt and αkt now being estimated as a function of the month. The overall safety parameter, θi, does not change with the month, which we discuss below. In particular, we propose the following model:
| Nijt ~ Poisson (Eitλijt) | (4-8) |
| log (λijt) = γ0+ γ1Xit + bi | (4-9) |
| Yijkt|[Nijkt > 0] ~ Binomial (Nijkt, pikt) | (4-10) |
| logit (pikt) = βkt – αkiθi | (4-11) |
where:
and where Nijkt = NijtI{k ∈ Sj} and Zijt can include time-varying covariates (e.g., seasonal variables) in addition to static variables specific to carrier and inspection. As above, θi represents an “overall” safety measure over the current time window. However, as time evolves, θi will change smoothly since safety measures are updated monthly, and there is a 23-month overlap for safety measures computed in consecutive months.
We prefer that the overall safety measure smoothly “downweights” violations further away from the current time (i.e., the end of the time window), rather than use discrete time intervals. Hence, in this model, we suggest modeling the αkt using a monotone function of month t. However, given that there is likely little (if any) information in the data to identify the form of the αkt over time, we suggest a parametric function (e.g., a cdf) be used to constrain the shape of the αkt as a function of time. For instance, we could set αkt = αkΦ(t*), where Φ(·) is a normal cdf and  This function, shown in Figure 4-1, sets the parameter αkt for the most current month to be αk (essentially), and zero (essentially) for violations that occurred 24 months ago (month t = −24). Expert opinion can again be used to determine informative priors for the parameters αk. Analogous to the model above, βkt is linked to the prevalence of a particular violation, but now depends on time which allows the violation “prevalence” to vary over time. Due to likely sparsity when we consider 1-month time windows, a shrinkage prior on βkt could be used that shrinks the βkt towards their average—in other words, analogous to the average prevalence of the violation over the 24-month time window with some month-to-month variation.
Multidimensional IRT Model
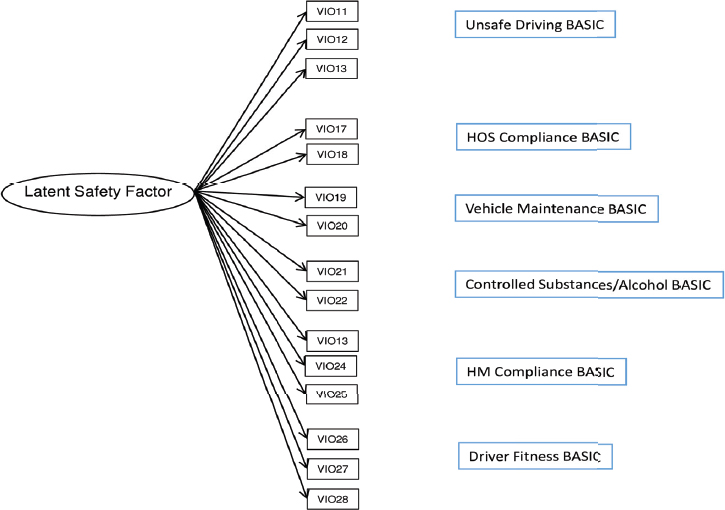
The model in Section 2, and depicted in Figure 4-2(a), assumes uni-dimensionality: that is, all of the violations measure a single underlying latent trait (safety). In some settings, if the data are multidimensional, the application of a unidimensional IRT model may result in distorted estimates of the latent dimension. As mentioned earlier, the current BASICs methodology assigns each violation to a distinct BASIC, and so assumes a multidimensional approach as there are multiple BASICs. Figure 4-2(b) depicts a multidimensional model with separate, uncorrelated dimensions of safety. In reality, it seems plausible that all safety dimensions are correlated to one another, a model that is represented graphically in Figure 4-2(c). The multidimensional models extend the model in the above section to allow for a vector valued θi, with the distribution of θi to be multivariate, such as multivariate normal with a diagonal (or unstruc-
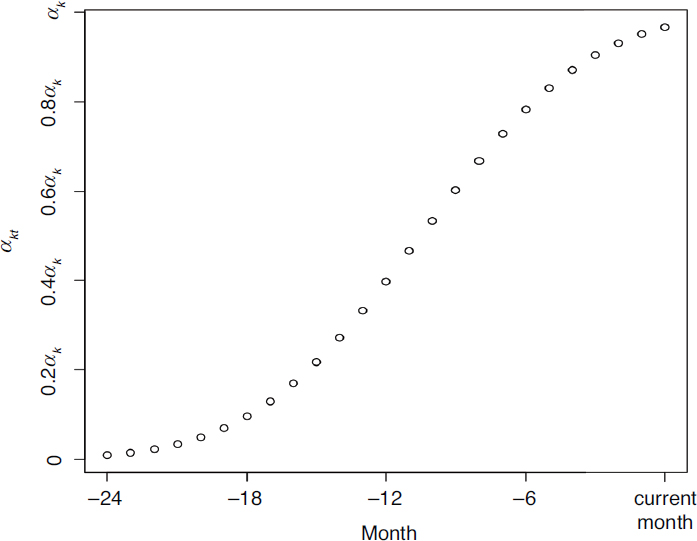
NOTE: This figure shows how violations of type k further in the past have less impact on the safety parameter, θ, than those in the current month via the feature that αkt decreases as one moves further away from the current month.
tured) covariance matrix in the case of independent (correlated) safety dimensions.
A special version of the multidimensional IRT model is the bifactor model (Gibbons and Hedeker, 1992; Reise, Moore, and Haviland, 2010). In the bifactor model all of the violations load on a primary latent trait (overall safety), and then each item additionally loads on one of several secondary latent traits (e.g., unsafe driving). The bifactor model is shown in Figure 4-2(d). The secondary latent traits represent associations in the violations that are not fully captured by the primary overall latent trait. In this way, the overall latent trait reflects the general safety measured by an inspection, and each secondary latent trait indicates the unique contribution of, for example, unsafe driving over and above the general safety latent trait. Relative to a fully multidimensional IRT model, the secondary factors in the bifactor model represent variation attributable to the violations that are beyond the overall primary latent
NOTES: Standard IRT model where there is one latent (safety) score/factor. This one safety score impacts the probability of each violation, and multiple violations are more (or less) likely to occur for the same carrier due to this relationship. HM, hazardous materials; HOS, hours of service.
trait. Hence, an advantage of the bifactor model over the fully multidimensional IRT is that it retains a single “summary” measure of safety, which can be used to prioritize interventions. The single measure could be more reliable than separate measures (dimensions) as it pools information from all violations.
An important consideration for a multidimensional model is the assignment of violations to specific safety dimensions. Currently, the assignment of violations to the BASICs is done in a confirmatory manner. However, an exploratory approach could be used to determine how many latent traits are needed to adequately represent the violations, and to determine which violations are associated with which latent traits. These multiple latent traits would be analogous to the multiple BASICs, in that they represent different groupings of the violations. However, the way in which the items of a particular latent trait “hang together” could be determined empirically. Expert opinion could be used to elicit informative priors on the number
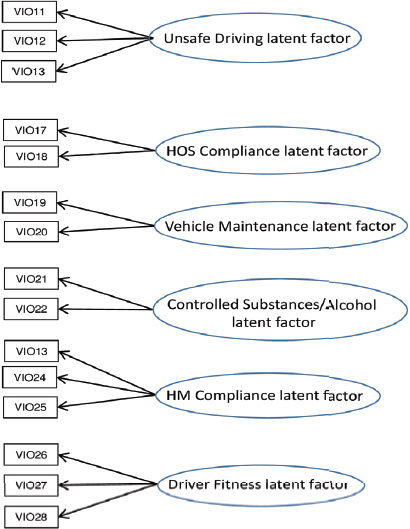
NOTES: Multidimensional IRT model with uncorrelated scores/factors. These multiple safety scores impact the probability of certain violations. For example, Unsafe Driving impacts violations 11-13 (not the actual numbers of the violations) and makes these violations more (or less) likely to occur for a given carrier. But, for example, the Unsafe Driving factor does not impact violation 21 since the Unsafe Driving factor is uncorrelated with the Uncontrolled Substance factor. HM, hazardous materials; HOS, hours of service.
of dimensions of safety, and the particular items that inform on each of the dimensions.
Data on Prior Crashes
Currently, data on carriers’ prior crashes is used to construct the Crash Indicator BASIC. We agree with this conceptualization of prior crashes as its own indicator, separate from other safety indicators, for several reasons. The causes behind individual crashes are multifactorial and depend on many unobserved factors such as weather and road conditions, and are thus not always under the direct control of the carrier.
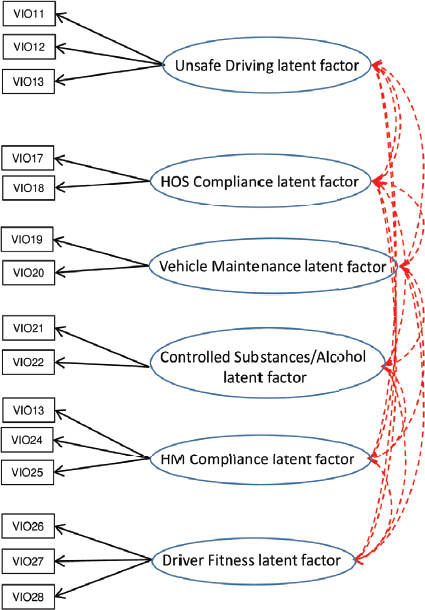
NOTES: Multidimensional IRT model with correlated scores/factors. This is similar to the model in Panel (b), but now the different factors are correlated and have some impact on all violations either directly (like with the Unsafe Driving factor with violation 11) or indirectly (like the Unsafe Driving factor on violation 21 through the correlation of that factor with the Uncontrolled Substance factor). HM, hazardous materials; HOS, hours of service.
Thus, crashes represent a safety measure that is conceptually different from, for instance, maintenance violations. Further, crashes are relatively rare and, thus, would be more difficult to incorporate in the IRT modeling approach.
Model Assessment
It will be important to assess how well the proposed model fits the observed data. Given the proposal of using Bayesian inference for this
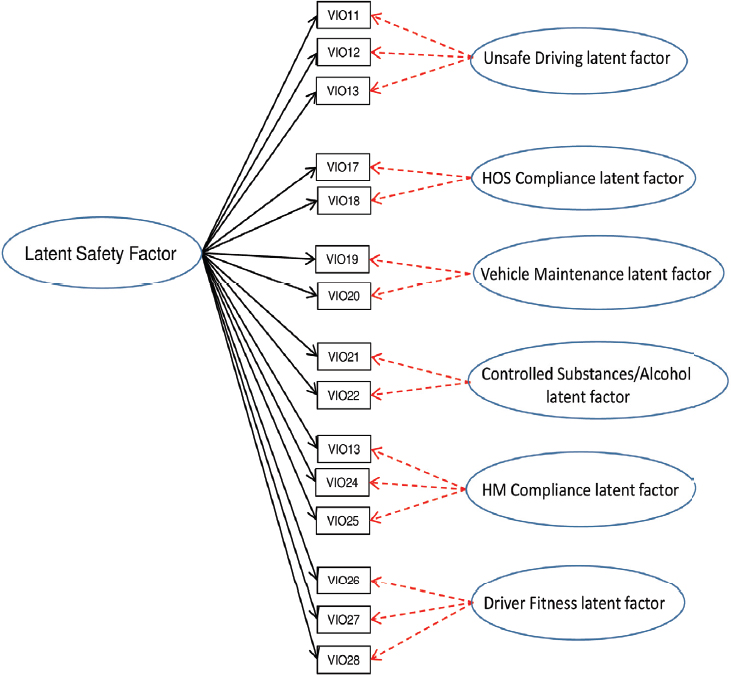
NOTES: Similar to the model in Panel (a), it indicates that safety score (primary factor) impacts the probability of each violation. However, there is also some additional association between distinct sets of violations that are impacted by the secondary factors. For example, unsafe driving (secondary factor) impacts violations 11-13 over and above the impact of safety score (primary factor) on these violations. HM, hazardous materials; HOS, hours of service.
model, a simple way to assess the absolute fit would be through the use of posterior predictive checks (Gelman et al., 2013). These checks measure and quantify how well the model captures features of the observed data as characterized by a test statistic or a discrepancy measure (Gelman, Meng, and Stern, 1996). Specific recommendations on such checks for IRT models can be found in Sinharay, Johnson, and Stern (2006).
In addition, it will be useful to carry out similar validation steps to those recommended in Chapter 3. This includes validation that the carriers selected by the IRT model as having high θ’s are those that are
operating unsafely. Further, it would also be necessary to validate that the carriers that are operating unsafely have frequent crashes.
SUMMARY ABOUT THE IRT MODEL FOR CARRIER SAFETY
In this chapter, we outlined a probabilistic approach with which to obtain estimates of a carrier’s safety. A key advantage of using a probabilistic approach over a deterministic model such as the current BASIC methodology is that probabilistic approaches yield measures of uncertainty in addition to estimated safety measures or rankings. The proposed model may need further refinements once it is fitted to the Motor Carrier Management Information System data. For instance, the model as described assumes a violation in item k is independent from k’ given the latent safety measures θi, an assumption that may have to be relaxed. The next chapter discusses in more detail the use of the safety measures for ranking carriers both relatively and absolutely, as well as the use of various forms of stratification as opposed to a model-based adjustment.
RECOMMENDATION: The Federal Motor Carrier Safety Administration (FMCSA) should develop the suggested item response theory (IRT) model over the next 2 years. If it is then demonstrated to perform well in identifying motor carriers for alerts, FMCSA should use it to replace the Safety Measurement System (SMS) in a manner akin to the way SMS replaced SafeStat. Specifically, IRT models would have the following specific advantages over SMS:
- Instead of severity weights being based on expert opinion or dated empirical information, the item discrimination parameters are estimated based on a combination of current observed data and expert opinion, and ultimately on data alone.
- They can enhance the transparency of the evaluation system.
- IRT models support the direct estimation of variability of scores and ranks.
- They can account for the probability of being selected for inspection.
- They can provide a basis with which to evaluate how data insufficiency could impact safety ratings of carriers.
- They can provide a basis to more rigorously evaluate the structure of the current Behavior Analysis and Safety Improvement Categories (BASICs), including which violations go into which BASIC.
- They can provide for a natural way to examine the issue of further stratification.
- They can provide for the possibility that safety is inherently multidimensional, which could inform as to how many BASICs are needed in the SMS model.
- They can take account of time and thereby inform about the proper time weights in SMS.
- They can allow for the addition of new safety measures as they become available, without having to start from scratch.
- They can produce ranking ranges (by sampling from the posterior distribution of theta) to better understand overlap in the rankings (i.e., uncertainty).
- They can adapt to changes in safety over time.


