
D
Description of Renewable Energy Technologies
This appendix includes further description of the electricity-generating technologies, with a focus on the benefits and challenges of each.
SOLAR PHOTOVOLTAIC
Solar photovoltaic (PV) is a viable utility-scale renewable technology option. Although all PV technologies convert sunlight into electrical power, different types of PV technology have achieved various levels of efficiency and commercialization since the initial deployment of crystalline silicon systems in the 1950s. With decreasing costs and the rise of government incentives and mandates, coupled with other aggressive public policy initiatives in the states, applications now include off-grid and grid-connected homes, commercial buildings, and utility-scale systems. The modular nature of solar PV makes it suitable for use in small, distributed systems (including building integrated), as well as utility-scale power plants. Although some geographical locations have more insolation than others, PV can be used effectively in almost every part of the world because of its use of both diffuse and direct sunlight. These characteristics have allowed the commercial development of PV to advance globally in many types of markets.
The market for solar PV is continuing to grow rapidly. By the end of 2014, the installed global PV capacity was approximately 175.5 gigawatts (GW), 28 percent above the 2013 global installed PV capacity (GlobalData, 2015). The solar PV industry is maturing, and manufacturing capacity of PV equipment continues to grow around the globe. The worldwide growth rate has averaged over 50 percent annually over the past 3 years; in the United States, the average during the same time frame was approximately 75 percent.(GlobalData, 2015). One of the issues for large-scale penetration of residential and commercial PV is the intermittency of PV, owing to cloud cover. This and other issues related to the large percentages of PV systems installed on some distribution lines in Hawaii (over 250 percent of minimum daily load) causes two-way flows for which the lines are not accustomed.
A challenge for PV generation is integration of the output power onto the electric grid. Without the use of large-scale energy storage—a viable technology, but one that is still not considered economical—PV is considered a variable generation resource owing to both the daily solar cycle and fluctuations in daily output due to weather conditions (clouds, precipitation, etc.) Specific challenges include overall decrease (loss) of generation during early evening peak demand and ramp rates associated with sunrise/sunset and weather conditions. Design of the PV system, such as “oversizing” the solar module field compared to the inverter to help maintain nameplate capacity output during evening peak demand can help manage integration challenges. Industry-wide efforts are also under way to better forecast daily solar conditions to aid system operators in maintaining grid stability.
Distributed and utility-scale PV systems share many of the same operation and maintenance (O&M) requirements. In general, PV is the lowest-maintenance electricity generation technology available. However, PV electric power plants are not maintenance free; they require a regimen of continual monitoring, periodic inspection, cleaning, scheduled preventive maintenance, and service calls, among other tasks. Tracking systems require periodic inspections to ensure proper operation of a few moving parts. Inverter replacement or repair is a leading contributor to O&M cost. Broadly speaking, the specifics
of effective O&M strategy are varied and depend on a number of environmental, policy-related, and organizational factors. System size and location determines the investment needed for labor and maintenance activities, such as water availability for cleaning or steam generation in the case of concentrating solar power; climate and weather conditions; travel distances; customer versus utility property; plant technology and architecture (such as panel and inverter types, fixed versus tracked, performance ratio thresholds); and ease of site access (such as ground mount versus roof mount), as well as the extent to which meters, inverters, and monitoring equipment are deployed at a site, among other factors.
Environmental impacts of solar PV generation, not including manufacturing and production, are limited and center on the potential for habitat disruption from a large, utility-scale solar field and possible effects on local vegetation and soil conditions from extensive shading of the ground. Life-cycle consideration for PV includes strategies for repowering or decommissioning PV systems when they reach end of useful life.
CONCENTRATING SOLAR
Over the course of the day, the amount of solar energy collected by a concentrating solar (thermal) power (CSP) plant will vary, but will often peak during mid-day when energy demand (e.g., due to cooling loads) is also high. During periods of lower solar energy flux, thermal CSP can use supplementary systems such as thermal energy storage (TES) or a fossil-fuel-fired heat-transfer-fluid heater or steam generator to allow for continued generation of electricity. Facilities of the latter type are known as hybrid solar plants.
Unlike solar PV plants, which likewise receive their primary energy from the Sun, CSP plants operate a steam turbine and thus share many characteristics with other steam-electric plants. The efficiency of such plants is determined by the steam conditions at the inlet and exit of the turbine—the greater the temperature and pressure drop from the inlet to the outlet, the more efficient the plant will be in generating electricity. For a given inlet temperature and pressure, the highest efficiency will be obtained when steam is condensed at the lowest possible temperature. Wet-cooled systems are thus usually more efficient in power output because their outlet temperatures are generally lower than those of dry-cooled systems. For CSP technology, the availability of cooling water for the power block is a potential barrier to flexibility in siting.
Solar thermal plants without thermal storage require a minimum of 3.5 to 5 acres (1.4 to 2 hectares) per megawatt of peak capacity in good solar resource locales (greater than 2,200 kWh/m2/yr) (EPRI, 2014). Plants that incorporate TES will require more land per peak megawatt. CSP plants with TES require 5 to 10 acres (2 to 4 hectares) per megawatt, with the latter value corresponding to about 9 hours of storage in good solar resource locales. CSP plants with TES—both the parabolic trough and central receiver variety—have an oversized collector field that transfers energy to the storage system during the peak hours of the day. The steam turbines that generate electricity will typically be specified at lower wattages than the peak thermal output of the collector field (EPRI, 2009).
In general, land appropriate for solar thermal projects consists of inhospitable, desert-like terrain that may be of minimal use for alternative development. The nature of this environment indicates that water use is an important factor in CSP development, as well as the potential for habitat disruption. Additionally, solar thermal power plants that are not hybridized with fossil fuel generate no direct emissions of CO2, methane, or other greenhouse gases (GHGs).
WIND
Although wind is considered an “intermittent” generation resource like solar, generation output from wind farms is more stable than one might expect. Grid-connected wind farms typically have capacity factors ranging from 25 to 40 percent or more (and higher) than solar. A common misconception about
wind power is that turbines are either on or off, and sit dormant for much of the year. In actuality, wind turbines are capable of partial output, and most wind farms generate at some level during 70 to 90 percent of the year.
Most utility-scale wind turbines are configured with a three-bladed rotor, oriented upwind of the tower, and a system to keep the rotor oriented into the wind. The drive train is located at the top of the tower and typically includes the following: a low-speed shaft connecting the rotor to the gearbox; a two- or three-stage speed-increasing gearbox; and a high-speed shaft connecting the gearbox to the generator. Each turbine is equipped with a transformer to step-up the output of the generator to grid voltage.
Wind turbine manufactures typically offer full-wrap warranty service contracts for up to 5 years, and ongoing support and service relationships are available from turbine manufacturers and wind O&M performance service companies. Generally speaking, wind turbine technology is reliable, with the historical on-stream availability in excess of 97 percent for leading manufacturers. Well-established turbines are demonstrating on-stream availability in excess of 98 percent. However, because wind technology is still evolving rapidly and new turbine models are being introduced annually, technology risk remains a consideration in estimating resource development potential.
The wind industry, while generally maturing, continues to faces several challenges. For example, social concerns associated with wind development likely to be encountered during permitting include the following: general public acceptance; impact of the wind project on the “view-shed,” or visual appearance of the project setting from different locations; potential effects from shadow flicker for residents living relatively near the wind farm, bird and bat kills, and potential noise impacts from mechanical systems and aerodynamic operation of the turbine. Environmental issues associated with wind energy include land use, soil erosion, and impacts on resident and migratory bird and animal populations. Vigorous public outreach and engagement and a respected approach to assessing environmental impacts are critical in addressing community concerns and fostering community acceptance.
GEOTHERMAL
The Energy Information Adminstration projects that geothermal electricity generation could more than quadruple between 2012 and 2040 (increasing to over 67,000 GWh), in part in response to renewable portfolio standards at the state level which mandate renewable generation, making the economics more favorable.1
Geothermal fields produce only about one-sixth of the CO2 equivalent as natural-gas-fired power plants, including the carbon embodied in the building of the plant and the CO2, hydrogen sulfide, and methane, among other gases, released from the reservoir itself.2 When geothermal power plants are dependent on a reservoir of hot water for their operation, that same water can be reinjected and heated. For example, Alameda Power & Telecom uses wastewater from a nearby community as a source of reinjection fluid at its The Geysers power plants.3
Unlike other forms of power production, there are relatively fewer developers and operators of large-scale geothermal facilities. There are fewer than 50 global developers capable of large-scale development and operations, compared to hundreds of players that develop and operate in other forms of energy development, including forms of fossil or renewable energy.
Enhanced geothermal systems (EGS) are created by the fracturing of impermeable rock formations. Although rare, the process of high-pressure hydraulic fracturing in such projects has led to seismic events (NRC, 2013); a project in Basel, Switzerland, was cancelled in 2009 after induced seismic events were
___________________
1 Energy Information Administration, 2014, “Geothermal Resources Used to Produce Renewable Electricity in Western States,” September 8, http://www.eia.gov/todayinenergy/detail.php?id=17871.
2 U.S. Department of Energy, Undated, “Geothermal FAQs,” http://energy.gov/eere/geothermal/geothermal-faqs#benefits_of_using_geothermal_energy, accessed July 8, 2015.
3 Junona Jonas, Alameda Power and Telecom, 2003 “Primer on Geothermal Energy,” November 1, http://www.elp.com/articles/print/volume-81/issue-11/power-plays/primer-on-geothermal-energy.html.
reported. Nonetheless, the Department of Energy (DOE) found it necessary to issue a protocol for induced seismicity issues.4 A commercial-scale plant using EGS went into operation at the Desert Peak East pilot project in Nevada in 2013.
BIOMASS
In some site-specific cases, biomass may be a less costly fuel for electricity or heat generation than fossil fuels, especially if abundant biomass waste products are available nearby.5 Another advantage of biomass plants is their high capacity factors, estimated at 80 percent, relative to other renewable plants (NREL, 2006).
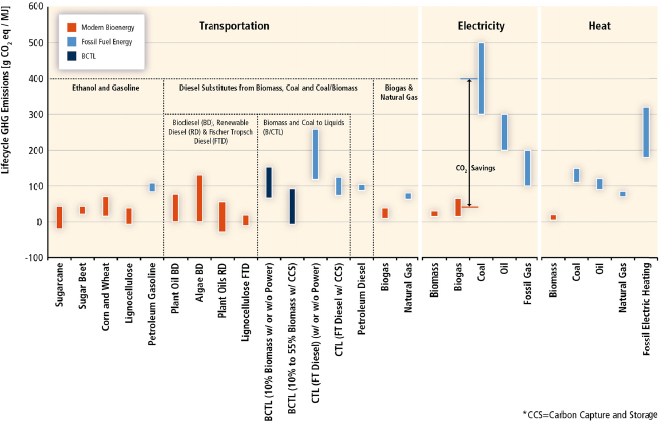
An important driver of increased biomass use is efforts to decrease GHG emissions. Biomass can have lower GHG emissions when combusted compared to fossil fuels, because CO2 absorbed from the atmosphere to grow the biomass offsets in part the emissions associated with combustion of the fuel. The determination of a fuel’s GHG emissions requires a life-cycle analysis that takes into account all emissions, including growth, transportation, processing, and combustion of the biomass. The Intergovernmental Panel on Climate Change reports that biomass used for transportation, electricity, and heat all have lower life-cycle CO2 emissions than fossil fuel generation (Figure D-1). The average biomass emissions values are still positive, indicating that not all CO2 emissions from biomass production, transportation and combustion are offset by the CO2 absorbed in the growth of the biomass (IPCC, 2011). The Union of Concerned Scientists also estimates that biomass emissions/energy output are about ten times lower for biomass plants than for natural gas plants, and are even lower in comparison to coal fired plants.6
A problem with using biomass as a fuel is the low energy density of biomass relative to fossil fuels. This low density makes transportation and storage more difficult, with resources outside a 50 mile radius considered to be uneconomical to move (Techline, 2004). This incentivizes co-location of biomass power plants nearby to biomass sources, as is done naturally in the pulp and paper industries (NAS-NAE-NRC, 2011). Another consideration for electricity generation from biomass is that biomass can have greater emissions of other air pollutants, such as black carbon and carbon monoxide, than the fossil fuels they may replace. Finally, some types of biomass are prone to slagging, which is formation of deposits during combustion. Slagging can lead to mechanical problems with the power plant and needs to be considered when constructing the plant and considering what type of fuel to use (Boundy et al., 2011).
WASTE-TO-ENERGY AND LANDFILL GAS
Given the amount of waste that Americans discard, the basic feedstock for waste-to-energy (WTE) projects is plentiful. Studies have shown life-cycle GHG benefits from using this technology rather than dumping waste into landfills. The GHG reduction derives from (1) avoided methane leaching from landfills, (2) displacement of fossil generation, and (3) recovery of metals. Thirty-one states and the Environmental Protection Agency classify WTE as a “renewable” energy resource.
___________________
4 U.S. Department of Energy, 2012, “DOE Releases Updated Seismicity Protocol. Office of Energy Efficiency and Renewable Energy, January 30, http://energy.gov/eere/geothermal/articles/doe-releases-updated-induced-seismicity-protocol.
5 James DeMass, U.S. Department of Energy—Savannah River Site, “Biomass Cogeneration Facility,” presentation to the committee, November 14, 2014.
6 Union of Concerned Scientists, “Renewable Energy: Unlimited Resources,” http://www.ucsusa.org/our-work/energy/our-energy-choices/our-energy-choices-renewable-energy#bf-toc-3, accessed June 5, 2016.
Despite its benefits, WTE has not been popular in the United States due to its combustion of trash containing possible toxic substances. In fact, the number of plants has been decreasing, with some older plants shutting down and no new plant coming on-line since between 1995 and 2014 (EPA, 2014), although a new WTE plant, the first in the United States in 20 years, opened in Palm Beach, Florida, in June 2015 (Shammas, 2015). Local communities and environmental organizations have expressed concern about the air emissions resulting from burning trash (Williams, 2015). They argue that even with cleaner incineration, the plants emit mercury, lead, dioxins, and other toxic materials. In addition, environmental groups have argued that the use of municipal solid waste for energy production could weaken incentives for recycling. Finally, a significant concern for DOE sites is the constant need to transport waste on-site for incineration. This may not be acceptable to the site for security reasons, may be impacted by competition with the waste disposal industry, or may face opposition from site neighbors who may be adversely affected by the truck traffic.
Other countries have dealt with the emissions issue through technology improvements. Incineration is more effective, the trash content is better screened, and the emissions are captured and scrubbed. In addition, some of the countries with the highest recycling rates have active WTE production. Sweden, for example, recycles about 50 percent of its trash, uses 49 percent in WTE plants, and landfills only about 2 percent (Williams, 2011).
The economics of WTE production depend primarily on the local “tipping” fees—how much the municipality will pay the facility to take its waste. Where the tipping fees for proximate landfills are high in the United States, primarily in the West and the Northeast, the fees paid to WTE facilities are high (BioCycle, 2010), or about $68 per ton in 2008. While the fees vary considerably across states, the average landfill tipping fee in 2011 was about $44 per ton. (By contrast, in Sweden, the landfill tipping fees are closer to $175.) (EPA, 2015; Williams, 2011).
Another major driver affecting the economics of WTE is the availability of sufficient waste. Without a reliable, steady stream of waste to fuel the plant, the plant is unable to operate at sufficiently high capacity. A reduction in output raises the cost per unit of electricity generation. WTE plants need an agreement with local municipalities or waste management companies to capture a minimum amount of waste on a regular basis.
Landfill gas is a natural byproduct of the decomposition of organic material in landfills and is composed of approximately 45 to 55 percent methane (primary constituent of natural gas), 45 to 55 percent CO2, and a small amount of non-methane organic compounds. In addition to containing trace constituents or elements, LFG is saturated with water vapor or condensate that must be removed prior to use.
Concern about the release of methane, a potent GHG from existing landfills, led to the development of power generation options utilizing the captured stream of LFG. The most common options for handling LFG include converting it to energy—by electricity generation or direct heating—for use by industry or treating it and transporting it by pipeline for conversion. Conversion to electricity generation is the most common means of LFG utilization and is accomplished through the use of internal combustion engines, turbines, microturbines, and fuel cells.
Major drivers affecting the economics of LFG are the quality and quantity of methane produced over a proposed power generation project time period. LFG is typically unsuitable as a fuel unless treated. The amount of gas cleanup required is dependent on the original LFG quality, the proposed LFG use (conversion technology), project design, and type of energy being produced.
Other factors must also be considered when planning, developing, or operating a LFG facility. Potential issues associated with using LFG as an energy source include (1) corrosive compounds in LFG not typically found in natural gas, (2) inadequate maintenance or operation of the LFG collection system (wells and collection header system) that will affect gas quality and pressure, and (3) lower energy value of LFG compared to natural gas, which may require additional processing of the LFG stream to increase energy content or modification of the end-user’s equipment.
REFERENCES
BioCycle. 2010. The State of Garbage in America. 17th Nationwide Survey of MSW Management in the U.S. http://www.biocycle.net/images/art/1010/bc101016_s.pdf.
Boundy, B., S.W. Diegel, L. Wright, and S.C. Davis. 2011. Biomass Energy Data Book, Edition 4. Knoxville, Tenn.: Oak Ridge National Laboratory.
EPRI (Electric Power Research Institute). 2009. Program on Technology Innovation: Integrated Generation Technology Options. Report No. 1019539. Palo Alto, Calif.: EPRI.
EPRI. 2014. Solar Energy Technology Guide. Report No. 3002003681. Palo Alto, Calif.: EPRI.
EPA (U.S. Environmental Protection Agency). 2014. Energy Recovery from Waste. http://www.epa.gov/osw/nonhaz/municipal/wte/.
EPA. 2015. Advancing Sustainable Materials Management: 2013 Fact Sheet. http://www.epa.gov/epawaste/nonhaz/municipal/pubs/2013_advncng_smm_fs.pdf. June.
GlobalData (Global Data Solar Power Database). 2015. http://www.globaldata.com. Accessed July 24, 2015.
International Panel on Climate Change (IPCC). 2011. Special Report on Renewable Energy Sources and Climate Change Mitigation (E. Edenhofer, R.. Pichs-Madruga, and Y. Sokona, eds.). Cambridge, U.K. and New York: Cambridge University Press.
NAS-NAE-NRC (National Academy of Sciences, National Academy of Engineering, National Research Council). 2010. Electricity from Renewable Resources: Status, Prospects, and Impediments. Washington, D.C.: The National Academies Press.
NRC (National Research Council). 2013. Induced Seismicity Potential in Energy Technologies. Washington, D.C.: The National Academies Press.
NREL (National Renewable Energy Laboratory). 2006. Power Technologies Energy Data Book. Fourth Edition. NREL/TP-620-39728. Golden, Colo.: NREL. August.
Shammas, B. 2015. Palm Beach County Waste-to-Energy Plant Makes Debut. Sun Sentinel. June 26.
TechLine. 2004. “Wood Biomass for Energy.” Forest Products Laboratory, Madison, Wisc.
Williams, M. 2011. Waste-to-Energy Success Factors in Sweden and the United States. American Council on Renewable Energy. http://www.acore.org/wp-content/uploads/2012/04/WTE-in-Sweden-and-the-US-Matt-Williams.pdf.
Williams, T. 2015. Garbage Incinerators Make Comeback, Kindling Both Garbage and Debate. New York Times. January 10. http://www.nytimes.com/2015/01/11/us/garbage-incinerators-make-comeback-kindling-both-garbage-and-debate.html?_r=0.


