
Proceedings of a Workshop
| IN BRIEF | |
|
October 2017 |
Beyond Patents: Assessing the Value and Impact of Research Investments
Proceedings of a Workshop—in Brief
Companies know exactly what they spend on research, but knowing exactly what they get for their money is a more difficult question to answer. Without a good way to measure value, research can be viewed as a cost that can be cut to boost near-term earnings. The number of patents is one metric for measuring the value of research, but that information is not necessarily useful without knowing the business value of those patents in the marketplace. What other metrics serve to highlight the value of research and innovation? On June 27 and 28, 2017, the Government-University-Industry Research Roundtable held a meeting to explore these issues.
The keynote presentation on June 27 was given by Anne Marie Knott of Olin Business School at Washington University in St. Louis, who explained an alternate metric she developed to gauge research productivity called the Research Quotient, or RQ, which is discussed at length in her recent book, How Innovation Really Works. According to Knott, RQ indicates how much a 1 percent increase in R&D spending would increase a firm’s revenue. The measure enables an estimation of the effectiveness of R&D investments relative to the competition and shows how changes in R&D expenditures affect a firm’s bottom line.
“R&D and innovation have long been drivers of economic growth, and until a few decades ago, GDP growth tracked R&D investment,” Knott explained. “But in the 1980s there was a lag in both. When R&D spending picked up again, the GDP did not follow; it sunk further. The innovation engine is broken and it is unclear why.” Knott suggested that the leading explanation of what happened comes from Stanford economist Chad Jones, who argues that the world has a finite number of good ideas and that over time the good ideas are realized, making R&D increasingly difficult. If Jones is right, growth is eventually going to drop to zero.
Knott is skeptical of Jones’ theory and offered an alternative one: that companies have gotten worse at performing R&D. She noted, if this is true, it is a fixable problem. A regression analysis reveals that both she and Jones can be right: R&D is not getting harder overall; it is only getting harder for industries as opportunities decay. This decay makes room for new companies to create new industries with new opportunities.
“The problem with industry R&D is that firms do not have a good measure of R&D effectiveness, and so they are flying blind,” Knott said. According to Knott, the most common measure of R&D effectiveness inside companies is sales divided by R&D, a metric reportedly used by 51 percent of firms. The second most common measure is patents, a measure used by 35 percent of firms. One problem with patents as a measure of R&D effectiveness is that the practice of patenting is not universally fol-
![]()
lowed—Knott noted that only 50 percent of firms doing R&D patent their innovations, and some avoid patenting their most important innovations at all because patents expire.
“The biggest problem with standard measures of R&D productivity is that they do not match theory,” said Knott. “Neither patents nor R&D spending accurately predicts market value. But RQ does match theory.” She argued that RQ reflects the intelligence of companies, serving as the firm equivalent of intelligence quotient. RQ is the firm-specific output elasticity of R&D—in other words, the percent increase in output from a 1 percent increase in R&D spending. When Knott tested the RQ measure using the 47 available years of data on publicly traded firms, she found that market value, R&D investment, and firm growth all increased with RQ. “That is not true for other measures, all of which fail at least one proposition,” she said. RQ also enables comparisons among companies and among countries, as it is unit-less.
“Relying on intuition about what innovation looks like is not a good idea, and we should not do it,” said Knott. “Relying too strongly on intuition can lead to the misidentification of exemplars which are then used to define best practices and policies. Diffusion of these unproven conclusions can result in a downward spiral of adoption of practices for which there is no evidence base.”
To illustrate the effects of unreliable market signals around innovative firms, Knott analyzed what would have happened if she had invested $1,000 in the S&P500 in July of 1973, and compared it against investing that money in the 50 companies with the highest RQ. According to Knott, at the end of December 2015 the S&P500 investment would be worth $78,000—a pretty good rate of return, about 10.6 percent. But the RQ50 investment would be worth $708,000—9 times as much.
What do high-RQ firms have in common? Almost nothing, Knott found, in part because they are spread out over such a wide range of industries. The only common factor she could find is that the firms tended to treat R&D as the horse rather than the cart—it was integral to company strategy. Knott’s book summarizes her work matching the RQ measure to companies’ R&D practices. She found that RQ does have limitations—it cannot measure the value of innovation in firms that do not do R&D, and it cannot measure the value of R&D for organizations where R&D does not drive revenue (e.g., universities and government labs).
“My goal is to replace the downward spiral of misinformation with a virtuous cycle,” said Knott. “If investors start using RQ to value stocks, they will move in the direction of investing in companies that have high RQ, which will lead companies to pay more attention to their own RQ and work to increase it, which in turn will increase their investors’ return. As RQ increases, GDP should increase as well.”
HOW VALUABLE ARE PATENTS AS A PROXY FOR INNOVATION?
The first speaker on June 28, Rafael Escalona Reynoso of the Cornell SC Johnson College of Business, offered an overview of the Global Innovation Index (GII), an annual report that covers detailed metrics about the innovation performance of 127 countries and economies around the world and that uses 81 indicators to explore a broad vision of innovation. Escalona Reynoso explained that the goal of the innovation index goes beyond the usual set of indicators and is intended to be a tool for action for decision makers. Each year a theme is selected and investigated deeply.
“The rationale for how to measure innovation is complicated, and there is no simple formula. It is a complex task to collect the data, select it, scale it, and aggregate it into a single ranking. Since its creation in 2007, the GII has become one of the leading resources people point to when talking internationally about innovation,” Escalona Reynoso stated.
Escalona Reynoso described the data sources used and the architecture of the index, which has seven pillars: five innovation inputs: institutions, human capital and research, infrastructure, market sophistication, and business sophistication; and two outputs: creative outputs and knowledge and technology outputs. An efficiency ratio is also produced based on the ratio of the inputs and outputs. The model includes 81 indicators in three categories: hard data, index, and soft data. The model and its indicators are tested and reassessed every year to ensure their relevance and soundness.
In terms of global ratings based on the GII, Switzerland ranks first, for the seventh year in a row. The United States is ranked fourth in 2017, having moved up from sixth three years ago. According to Escalona Reynoso, there is an “innovation divide” that shows a large gap between countries in the top
25 and those below that group and others in between. Yet some low-income economies are breaking through that gap and playing an increasingly important role in innovation. Another key finding of this year’s index is that finance of innovation globally has not come back to the level that existed in 2007, though it has rebounded somewhat in the past few years.
In terms of future perspectives, the GII has developed a new segment that identifies clusters of inventive activity and innovation hubs at the sub-national level, which also includes looking at the status of women in invention.
The next presentation was offered by Carol Robbins of the National Science Foundation (NSF), who spoke about patents within the Science and Engineering Indicators, which NSF releases every 2 years. The goal of the Indicators is to provide high-quality, quantitative data that is policy neutral but policy relevant for the U.S. within a global context. The Indicators rely significantly on patent data, which offer a great detail of information on factors including where inventors live, the technology areas of patents, and the companies that have assigned rights.
According to Robbins, data show that between 2003 and 2014, U.S. inventors’ share of U.S. Patent and Trademark Office (USPTO) patents declined from slightly more than half of patents to slightly less than half. Over that same time period, patenting in the developing world and in other developed nations such as South Korea, Singapore, and Taiwan increased. “Looking at the data from various patent offices—United States, Japan, China, Republic of Korea, and Europe—we can see that there has been a surge in patenting since 1980,” she continued (Figure 1).
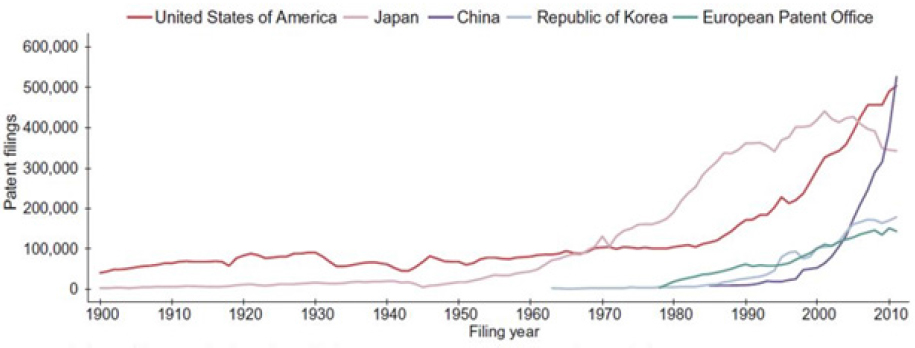
Source: Carol Robbins, National Science Foundation.
“Are patents a good indicator of innovation?” asked Robbins. “What makes an indicator good depends on what it is used to measure. Science and technology indicators are necessary benchmarking measures for performance assessment, policy making, private-sector decision-making, and social science research facilitation. The strength of an indicator also depends on the quality of the data. All indicators are really partial indicators so we use a broad scope of individual indicators,” said Robbins.
The 2018 Indicators will include intangible capital—computer software, R&D expenditures, human capital, and freely available knowledge. Also included are data on employment growth, the creation of new firms, multifactor productivity growth, and other data on the impacts of innovation.
“Since the late 2000s, there have been declines in the rate of growth of multifactor productivity and in the creation of new firms. That leaves us to figure out what is happening with innovation and its rate of change, which is what we hope to examine with the additional indicators,” said Robbins.
WHERE DO PATENTS FALL SHORT AS A METRIC FOR ASSESSING RESEARCH IMPACTS?
The next presentation was given by Petra Moser of the Stem School of Business at New York University, who spoke about patents and innovation in economic history. Moser argued that although there are many historical sources for patent information, there are important policy questions that cannot be answered by patent data alone. How do you measure innovation in countries without a patent system? Can there be innovation without a patent system? Economic history is helpful in examining these questions.
Moser described World’s Fairs held in the 19th and 20th centuries, that were used as showcases for innovation. In 1851 at the Crystal Palace Exhibition in London, for example, the United States showed Europe its innovative manufacturing system and its capacity to produce standardized, precise, replaceable parts, such as those used in the Colt revolver. “Countries without patent systems, such as Switzerland and Denmark, contributed many high-quality innovations at the world’s fairs,” said Moser (Figure 2). Only a small share of innovations displayed at the world’s fairs were patented overall—11 percent at British fairs, and 14 percent at U.S. fairs.
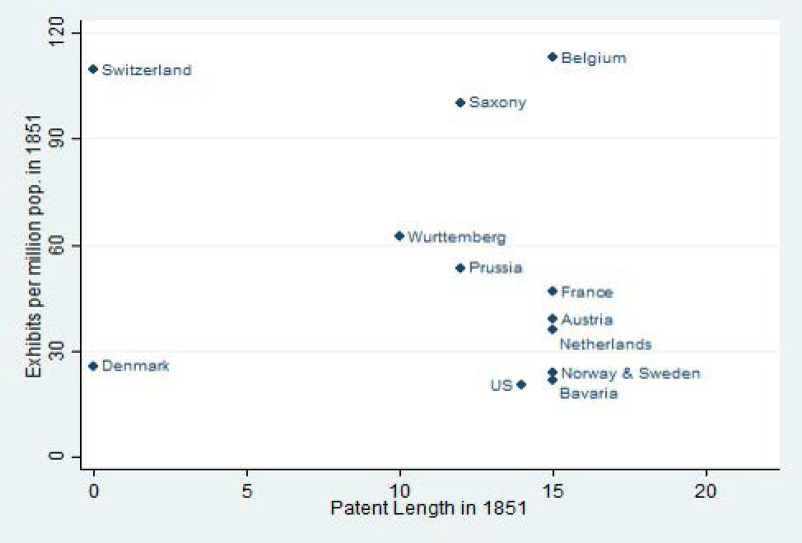
Source: Petra Moser, New York University. Presentation by Petra Moser to GUIRR, June 28, 2017.
According to Moser’s research, it is easier and cheaper to copy and improve upon foreign-owned technologies in the absence of a patent system, which can also lead to innovation. The Swiss watchmaking industry, for example, started with British technology. The Netherlands had an extremely innovative period following the abolition of its patent system in 1869; major Dutch multinationals such as Unilever and Philips got their start by copying foreign technologies. However patents do lead a country to have a more diverse portfolio of innovations—Denmark and Switzerland without patent systems were innovative, but only within a narrow set of industries.
“Patenting activity varies strongly by industry,” Moser explained (Table 1). “In some industries companies intentionally do not patent their innovations. For example, historically chemicals were not often patented because companies kept them secret. But when secrecy diminished in effectiveness—when it became easier to reverse-engineer chemicals—inventors switched to patenting to protect their innovations. The industries that need patents the most are the ones where inventions are easy to replicate; for example, machinery in the 19th century, and some parts of the plant breeding industry, including roses.”
Patents only cover some areas of innovation, and many innovations we care about today—including those in media—are protected by copyrights. Basic levels of copyright protection encourage creativity and output, especially when you have very narrowly defined copyrights. Copyright extensions, meanwhile, generate no benefits and discourage follow-on science and innovation. Overall, Moser concluded, research on intellectual property needs analysis of both patents and alternative information sources on innovation.
Table 1 U.S. Exhibits of Chemicals and Manufacturing Machinery at World’s Fairs, 1851-1915.
| 1851 | 1876 | 1893 | 1915 | All years | |
|---|---|---|---|---|---|
| Chemicals | |||||
| Shared patented | 0.0% | 3.6% | 19.0% | 18.9% | |
| Exhibits | 32 | 139 | 63 | 90 | 324 |
| Manufacturing machinery | |||||
| Shared patented | 43.8% | 44.0% | 49.4% | 47.1% | |
| Exhibits | 32 | 468 | 358 | 34 | 892 |
| Exhibits in both industries | 64 | 607 | 421 | 124 | 1,216 |
Source: Petra Moser, New York University. Presentation by Petra Moser to GUIRR, June 28, 2017.
Bhaven Sampat of Columbia University spoke next, addressing where patent measures succeed and fall short as a measure of innovate activity in the life sciences. “Patent data are now ubiquitous, but concerns about what the data tell us—such as their value as indicators of innovation and research impact—remain,” Sampat noted. He suggested that a particular problem with using patent data is that in most sectors patents are relatively unimportant for securing returns from R&D investments. Firms commonly rely on other mechanisms—including lead time, secrecy, and complementary assets—to achieve returns. He reiterated Moser’s point that it remains difficult to link patents to products and outcomes of interest.
“While these are persistent obstacles in some sectors, these problems are less prominent in the life sciences, at least in pharmaceuticals,” Sampat said. “Sixty years of research suggest that in pharmaceuticals, patents serve as an inducement to innovation, and the propensity to patent important inventions is high.” However, Sampat also noted that life sciences innovation is broader than pharmaceuticals, and even in pharmaceuticals, patents miss a lot of the story. “There is a lot more drug patenting than drug innovation, and there is no real correlation over time between patenting and drug innovation. Patents may be a better indicator of R&D inputs than R&D outputs.”
Sampat also discussed the promise and limits of using patent data to measure the impact of publicly funded research in the life sciences, drawing on recent research he did with colleagues. Their research, which aimed to measure the impact of the National Institutes of Health (NIH) on private-sector innovation, started by mapping the relationship between NIH grants to all ensuing patents. They found that a little less than 10 percent of NIH grants are directly linked to a patent (i.e., the patent directly references the grant), and less than 1 percent are linked to a marketed drug.
“But that measure misses much of the impact of the NIH, because a lot of what the agency does is generate information and knowledge that enables private-sector innovation,” said Sampat. “One way to track this is to look at all of the publications resulting from NIH grants and the extent to which those publications are cited by private-sector patents.” According to Sampat, about 30 percent of NIH grants generate a publication that is then cited by a private-sector patent—a much greater share than grants directly generating patents. The rate of publications cited in FDA-approved drug patents is higher as well. A better understanding of what intellectual relationships patent citations to scientific publications capture, and what they miss, is an important next step as this research continues. Sampat is also now looking at citations in the text of patents rather than only citations on the front page of patents, which may provide even better measures of knowledge flows.
THE SCIENCE OF SCIENCE AND INNOVATION POLICY
The next presentation was offered by Maryann Feldman, the recent director of the National Science Foundation’s Science of Science and Innovation Policy (SciSIP) program. The SciSIP program funds interdisciplinary work to help make better decisions for science with the goal of supporting research that can inform and support science policy decision making.
Feldman offered three examples of efforts her program is funding. The first, Iproduct, links innovative goods actually sold in the U.S. economy to the patents upon which they are based. The project is scrubbing websites to find these data, and its database will be publicly available, which Feldman hopes will spur more research. A second project led by SRI researcher Christine Freyman is looking for connections between patents and licensing agreements, with the logic that if something is licensed, it has real value. Freyman has examined the amount of time that passes between the award and a publication (finding a median of 2 years), between the award and the patent (a median of 8 years), and between the award and the license (a median of 10 years).
A third project, led by researcher Ashish Arora, is working on measuring American corporate science. This project linked patents with scientific articles from 1980 to 2006 using the Web of Science. (There is now a new project that extends it to the present time.) The researchers matched those patents to over 4,000 R&D performing publicly traded corporations. They then characterized those firms in terms of their contribution to science and their use of science. They found that a corporate publication is six times more likely to be cited by a patent than a university publication, and that corporate scientific publications have many users, including other companies, universities, and governments. Arora and his colleagues have also found that large firms are investing less in science, and that the stock market value of research is declining. “The pessimistic interpretation is that private research is in decline, and the less pessimistic interpretation is that established firms are sourcing inventions from universities,” said Feldman. The project’s funding has been extended for 10 years.
SMALL GROUP DISCUSSIONS
Participants broke into small groups, which were asked to discuss how industry, government, and universities should measure innovation more effectively and what useful data exist that can enable this practice.
Randy Moses from Ohio State University reported four his group, stressing that innovation is local and regional and that aggregating elements and activities and resources over large areas may lead to misleading or wrong conclusions. He suggested, “To better measure efficiency, better data is needed on linkages—especially people-to-people linkages—for successful outcomes. Measuring knowledge-sharing is important.”
Kelly Sullivan from Pacific Northwest National Lab (PNNL) reported that her small group focused on the need to understand the difference between actions taken to try to create innovation and measuring the outcomes of those actions—the difference between the front-end and the back-end. She also stressed the need for measures that could help mission-focused agencies such as PNNL measure impact.
Todd Keillor from Worcester Polytechnic Institute reported for his group. They wondered whether it would be possible to go beyond tracking the time from grant to license, and also tracking the time from grant to the time the first product is sold, since that is ultimately the information that gets the closest to estimating value. “From the industry side, some companies are being managed from a finance standpoint and R&D is just treated as an expense, so there is no value proposition that R&D proponents can make to those allocating the budget,” he said. “Perhaps it can be treated as an asset instead, though that shift will be a challenge.”
WHAT OTHER METRICS CAN BETTER SERVE THE NEED TO ASSESS RESEARCH VALUE AND IMPACT?
Diana Hicks of the Georgia Institute of Technology offered the next presentation on her work on the Leiden Manifesto. “The motivation for the manifesto was the increasing proliferation of dodgy practice in evaluating research using metrics,” said Hicks. “Part of what lay behind that was a proliferation of national university research evaluation schemes around the world, some of which were based on peer review, but many of which were based on metrics.”
Given this metrics overload, Hicks and several other colleagues were driven to provide scientists with a resource to stand up against administrators approaching them with poor proposals for metrics regimes. “So we came together and wrote our manifesto for the application of metrics to research evaluation, which Nature published about 2 years ago.” Hicks showed a video overview of the manifesto, which offers a road map to guide researchers and evaluators toward best practices for measuring research quality—using quantitative evaluation to support rather than substitute for expert assessment, for example, and measuring performance in accordance with the research missions of the institution (Figure 3). “The manifesto got a lot of attention around the world, and volunteers translated it into 15 languages,” said Hicks.
Source: Diana Hicks, Georgia Institute of Technology. Presentation from Diana Hicks to GUIRR, June 28, 2017.
“Many countries now think they have a grip on assessing research excellence, and so attention is turning toward how to assess the broader societal impacts of research,” she continued. She sees the United Kingdom as a leader in this space, since in 2014 as part of its national assessment exercise it conducted the first assessment of broader impacts of research. Hicks noted, “It was a very well thought out exercise. Universities were required to submit case studies—narratives of 1,300 words—which were then assessed by panels. Each narrative had to describe the research (which had to occur within the past 20 years) and its impact and provide evidence for that impact. Over 7,000 impact case studies were assessed.”
Hicks continued, “The United Kingdom uses the results of this assessment to help distribute core funding to their universities. Overall, the 7,000 cases are providing a way forward in terms of looking at societal outcomes and getting beyond the narrow view provided by patents.” She concluded that the approach is beneficial for universities, which can put the case studies on their websites and make a case to the public about the value their research is providing.
Next, Lee Fleming of UC Berkeley explained his research team’s project to use virtual reality to explore the progress of technology innovation. “The idea of ‘technology space’ is fairly old,” noted Fleming. “Much of the work in this area is based on identifying similarity among documents and patents. We tested this idea in 2013 with a paper on clean energy, and we came up with a visualization that used orbs to represent patents, colored by firm, and sized based on citations.”
Fleming showed a clip of a visualization depicting the emergence of Uber, and how the company entered space previously dominated by AT&T and deCarta (and bought the latter). Another clip showed the evolution of autonomous vehicles, which displayed a diverse range of patenting entities. The movies include “signposts” or words which give the user an idea of where his or her position is in the space. The size of the nodes shrinks or grows over time, and this is based on patent data; when a node shrinks, that means that patent data is not being cited in later years (Figure 4).
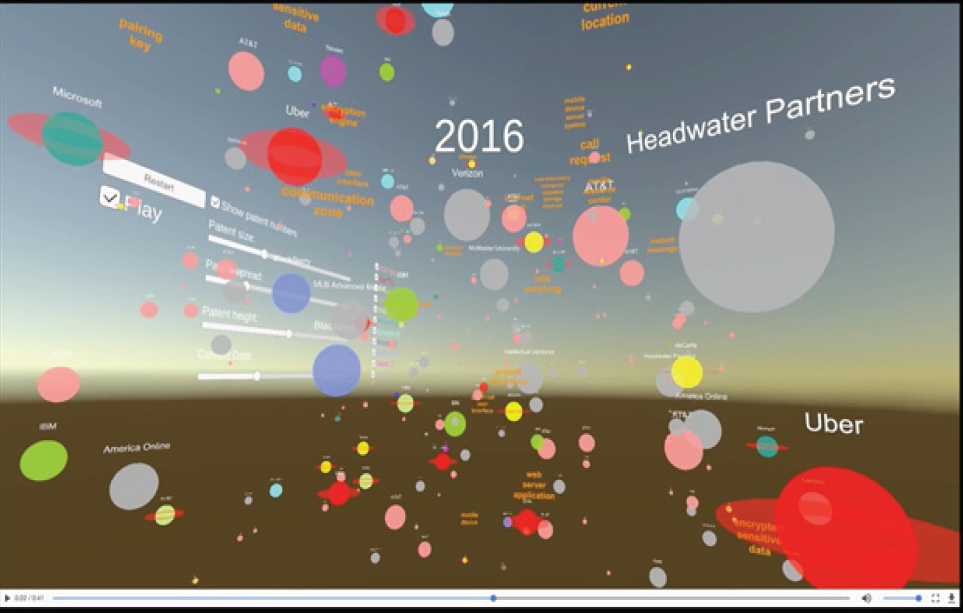
Source: Lee Fleming, University of California, Berkeley. Presentation by Lee Fleming to GUIRR, June 28, 2017.
“Two questions related to the visualizations are important but difficult to answer,” said Fleming. “What patents make it into a space? The results are highly sensitive to assumptions and to how the space is defined. And what does distance mean? In other words, what does it mean when you see a patent close to another patent? The most effective ways to use these visualizations is a combination of bibliometrics and experts.”
Future features of Fleming’s visualization work might include papers placed into the space just like patents, as well as citation overlay between patents and papers. “Users may be able to click on the visualization for full text, images, and information on inventors. If the technology gets easy to use, a patent examiner could download the text of a patent application and its space, and see potentially invalidating prior art come up on the visualization. The technology might also allow the visualization of the impact of government R&D.” And although he is skeptical that it is possible, Fleming wants to experiment with prediction based on past progressions.
Next, Julie Carruthers of the U.S. Department of Energy offered a mission agency perspective on assessing research value and impact. She opened with an overview of DOE’s mission areas—science, energy, nuclear safety and security, and environmental cleanup—and their research portfolios.
“The responsibility for assessing the impacts of DOE’s R&D activities resides with the sponsoring program offices,” said Carruthers. “What they are interested in assessing depends upon their mission-specific responsibilities. In the Office of Science, the responsibility is to deliver on the science mission. The office stewards whole fields of research in the United States, funding over 80 percent of federal research in some fields.”
Carruthers explained that the Office of Science also supports basic research to enable breakthroughs that advance the department’s other missions. In addition, it is responsible for operating scientific user facilities, including 10 of DOE’s 17 national laboratories. By contrast, in the energy technology offices the set of mission responsibilities is very different—delivering results on the energy part of DOE’s mission, advancing techno-economic goals for energy technologies (e.g., reducing costs, advancing technologies), supporting applied R&D, and transitioning breakthroughs to the private sector.
“The desired outcomes follow from those specific mission responsibilities,” explained Carruthers. “The Office of Science’s basic research programs are interested in fundamental new discoveries that push the fields they support forward and in some cases enable the emergence of new fields. They are also looking at how the new knowledge can lead to predictive understanding. Keeping user facilities cutting edge and competitive worldwide is a priority as well. In assessing outcomes, the Office of Science looks at publication and citations, use of facilities, dissemination of data sets and software, awards and prizes, students trained, as well as program-specific outcomes.” External advisory committees examine how the office operates and evaluate the national and international standing of the research portfolios.
In an applied energy technology office, the desired outcomes are about commercializing products or processes, patents and publications, reducing energy use and costs, reducing environmental impacts, economic return on investment, and training students and workers. These offices examine outputs like IP — knowledge created and publications and patents and licensing—and also the achievement of their techno-economic milestones. In addition, the proposals they receive from the scientific community and industry include much more discrete project milestones that are then tracked—new technologies validated under real-world conditions, whether the funded partners have commercialized the technology, growth in market share, sales and royalties, deployment (how much energy is produced and installed), and environmental impacts.
The program managers of the applied technology offices also do retrospective impact evaluation studies with independent evaluators. Five of these evaluation studies have been completed by the Office of Energy Efficiency and Renewable Energy, focusing on areas like geothermal and advanced batteries. These evaluations concluded that between 1976 and 2012, DOE’s investment of almost $12 billion in taxpayer dollars has already yielded a net economic benefit to the United States of more than $230 billion, with an annual return on investment of more than 20 percent.
DISCLAIMER: This Proceedings of a Workshop-in Brief has been prepared by Sara Frueh as a factual summary of what occurred at the meeting. The committee’s role was limited to planning the meeting. The statements made are those of the author or individual meeting participants and do not necessarily represent the views of all meeting participants, the planning committee, or the National Academies of Sciences, Engineering, and Medicine.
REVIEWERS: To ensure that it meets institutional standards for quality and objectivity, this Proceedings of a Workshop—in Brief was reviewed Gretchen Baier, Dow Chemical Company and Soumitra Dutta, Cornell University. The review comments and draft manuscript remain confidential to protect the integrity of the process.
PLANNING COMMITTEE: Taylor Eighmy, University of Tennessee, Knoxville; Carl Schramm, Syracuse University; Kelly Sullivan, Pacific Northwest National Laboratory.
STAFF: Susan Sauer Sloan, Director, GUIRR; Megan Nicholson, Associate Program Officer; Claudette Baylor-Fleming, Administrative Coordinator; Cynthia Getner, Financial Associate.
SPONSORS: This workshop was supported by the Government-University-Industry Research Roundtable Membership, National Institutes of Health, Office of Naval Research, and the United States Department of Agriculture.
For more information, visit http://www.nas.edu/guirr.
Suggested citation: National Academies of Sciences, Engineering, and Medicine. 2017. Beyond Patents: Assessing the Value and Impact of Research Investments: Proceedings of a Workshop—in Brief. Washington, DC: The National Academies Press. doi: https://doi.org/10.17226/24920.
Government-University-Industry Research Roundtable
Policy and Global Affairs
![]()
Copyright 2017 by the National Academy of Sciences. All rights reserved.


