National Academies Press: OpenBook
« Previous: Appendix E: L-3 Failure Modes and Effects Analysis Document
Suggested Citation:"Appendix F: Additional Airport Data." National Academies of Sciences, Engineering, and Medicine. 2017. Airport Passenger Screening Using Millimeter Wave Machines: Compliance with Guidelines. Washington, DC: The National Academies Press. doi: 10.17226/24936.
×

F

Additional Airport Data

Additional airport data from the BerrieHill Research Corporation (BRC)/Applied Research Associates (ARA) team is provided in this appendix. For the Cincinnati/Northern Kentucky International Airport (CVG), McGhee Tyson Airport (TYS), and Memphis International Airport (MEM) measurements described below, only the single Keysight 8990B power meter port was used. In addition, the 3 dB Power Coupler and the additional radio frequency (RF) cable were removed to further minimize losses and improve system sensitivity by approximately 6 dB for the CVG, MEM, and TYS airport measurements in comparison to the Dayton International Airport (DAY) measurement, which had less system sensitivity and lower time-domain sampling.

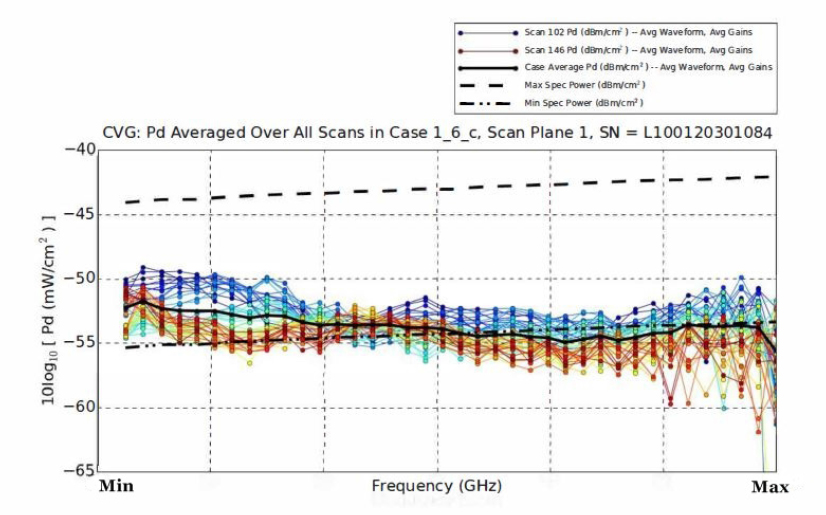
CINCINNATI (CVG) AIRPORT DATA

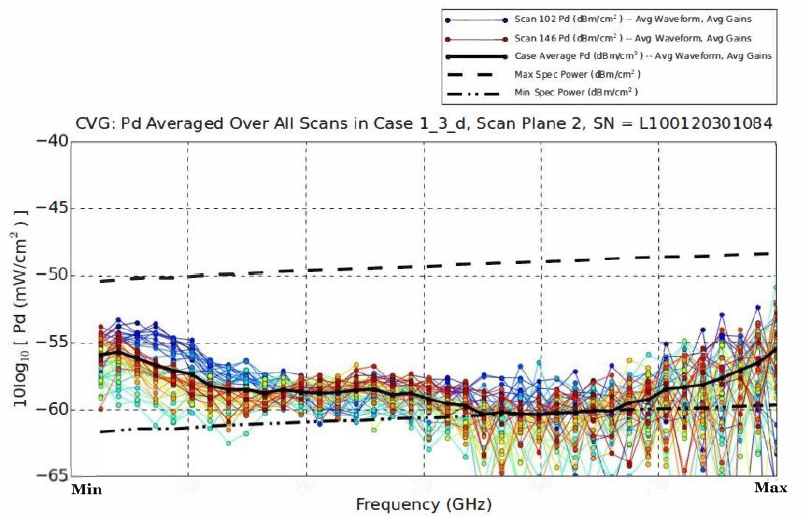
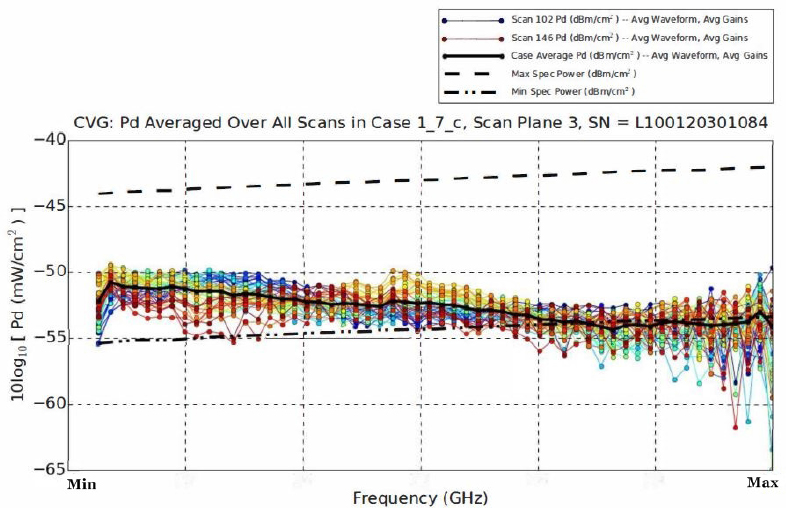
Figures F.1 to F.3 are the same three internal Scan Planes (1, 2, and 3) for the CVG airport measurements. The theoretical curves are adjusted for the actual field distances measured.

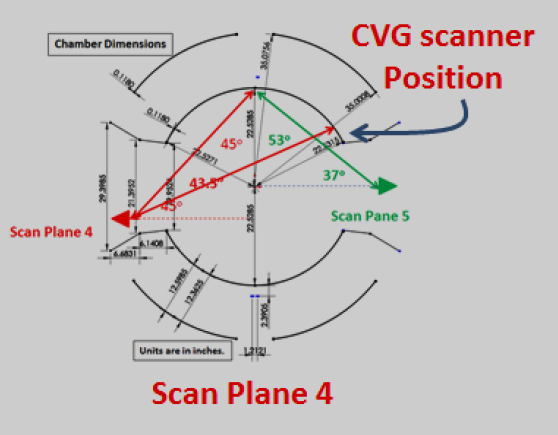
At CVG airport, there was another attempt to measure the power density in the ProVision exit door adjacent to the Transportation Security Administration (TSA) operator’s position (Scan Plane 4). As discussed earlier, this was unsuccessful at the DAY airport because the fixed center position of the ProVision scanner did not radiate sufficient energy into Scan Plane 4 to be detected by the team’s equipment. At CVG airport, the ProVision scanner was operated in the normal scanning mode, rather than the fixed service/engineering mode, to attempt to capture the transient

Suggested Citation:"Appendix F: Additional Airport Data." National Academies of Sciences, Engineering, and Medicine. 2017. Airport Passenger Screening Using Millimeter Wave Machines: Compliance with Guidelines. Washington, DC: The National Academies Press. doi: 10.17226/24936.
×
Image
FIGURE F.1 Cincinnati/Northern Kentucky International Airport (CVG) Scan Plane 1 power density data versus height plus average of all waveforms.
Image
FIGURE F.2 Cincinnati/Northern Kentucky International Airport (CVG) Scan Plane 2 power density data versus height plus average of all waveforms.
Suggested Citation:"Appendix F: Additional Airport Data." National Academies of Sciences, Engineering, and Medicine. 2017. Airport Passenger Screening Using Millimeter Wave Machines: Compliance with Guidelines. Washington, DC: The National Academies Press. doi: 10.17226/24936.
×
Image
FIGURE F.3 Cincinnati/Northern Kentucky International Airport (CVG) Scan Plane 3 power density data versus height plus average of all waveforms.

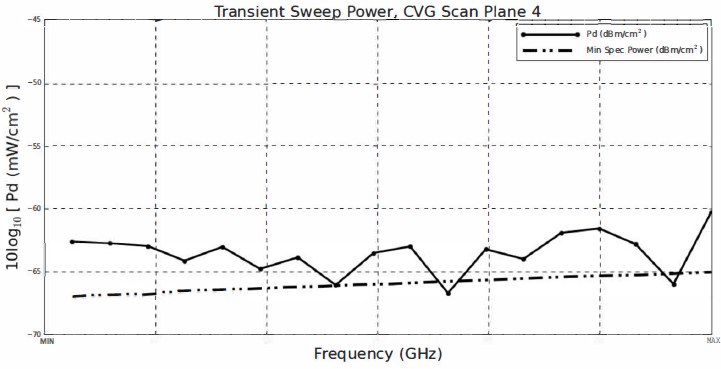
response at Scan Plane 4 with the scanner bar in motion. The split second after a right-to-left sweep is initiated (or when a left-to-right sweep ends), the scanner is in the position shown in Figure F.4. To capture the reference pulse for triggering, the reference antenna was placed on a tripod and faced the opposite rear array in order to capture the transient response. The data acquired are excellent and are displayed in Figure F.5. Essentially, the plot in Figure F.5 is the power level at the exit door assuming the scanner mast was fixed in the position shown in Figure F.4. The actual level of exposure on a single sweep if the TSA operator stood right in the exit door is at least 10 dB weaker than the energy the passenger is exposed to. The exit door is only illuminated for roughly 30 percent of the mechanical sweep time, 15 percent from the front array illumination, and 15 percent from the back array illumination. If one factors in the 30 percent power duty cycle losses of the mechanical sweep, the expected exit door power levels of Figure F.5 should be reduced on average by an additional 10*log(0.15) = −8.2 dB to account for the sweep duty cycle. This means that the average power density at the entrance of the portal is close to 16 million times below the acceptable limit for a continuous signal.

Suggested Citation:"Appendix F: Additional Airport Data." National Academies of Sciences, Engineering, and Medicine. 2017. Airport Passenger Screening Using Millimeter Wave Machines: Compliance with Guidelines. Washington, DC: The National Academies Press. doi: 10.17226/24936.
×
Image
FIGURE F.4 Scan Plane 4 position at Cincinnati/Northern Kentucky International Airport (CVG) with normal ProVision mechanical sweep.
Image
FIGURE F.5 Cincinnati/Northern Kentucky International Airport (CVG) Scan Plane 4, transient sweep, center of exit door aperture versus minimum specific power.

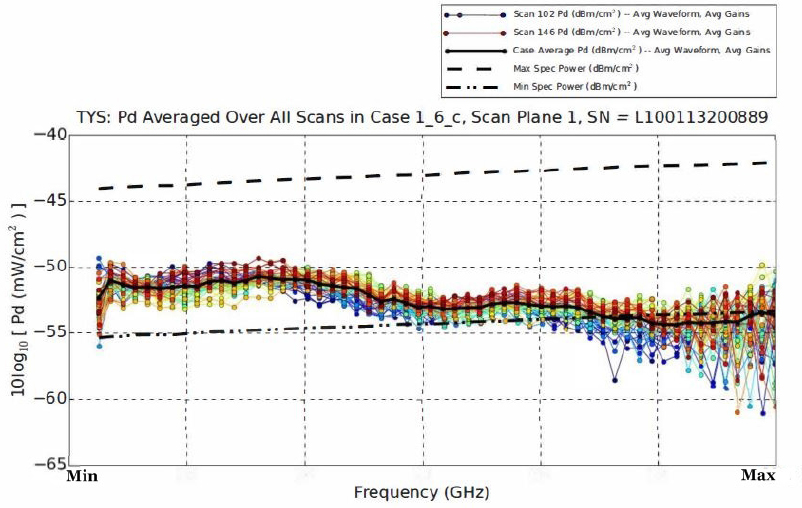
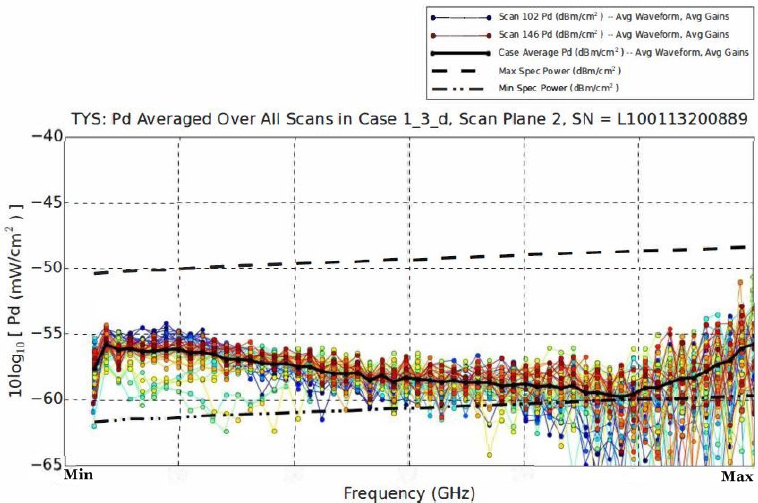
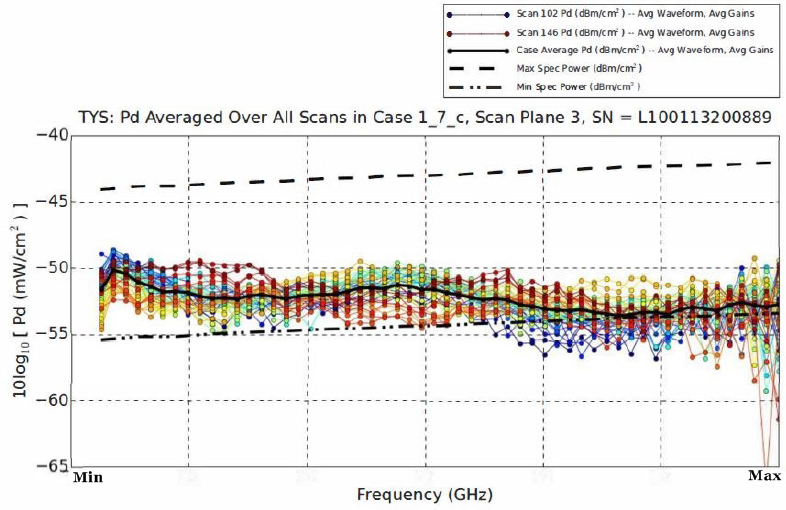
TYSON (TYS) AIRPORT DATA

This section presents the three scan planes for TYS airport. This was also a ProVision ATD machine. Figures F.6 to F.8 are the composite data similar to what has been presented here for CVG and DAY airports and are presented here without further comment.

Suggested Citation:"Appendix F: Additional Airport Data." National Academies of Sciences, Engineering, and Medicine. 2017. Airport Passenger Screening Using Millimeter Wave Machines: Compliance with Guidelines. Washington, DC: The National Academies Press. doi: 10.17226/24936.
×
Image
FIGURE F.6 McGhee Tyson Airport (TYS) Scan Plane 1 power density data versus height plus average of all waveforms.
Image
FIGURE F.7 McGhee Tyson Airport (TYS) Scan Plane 2 power density data versus height plus average of all waveforms.
Suggested Citation:"Appendix F: Additional Airport Data." National Academies of Sciences, Engineering, and Medicine. 2017. Airport Passenger Screening Using Millimeter Wave Machines: Compliance with Guidelines. Washington, DC: The National Academies Press. doi: 10.17226/24936.
×
Image
FIGURE F.8 McGhee Tyson Airport (TYS) Scan Plane 3 power density data versus height plus average of all waveforms.

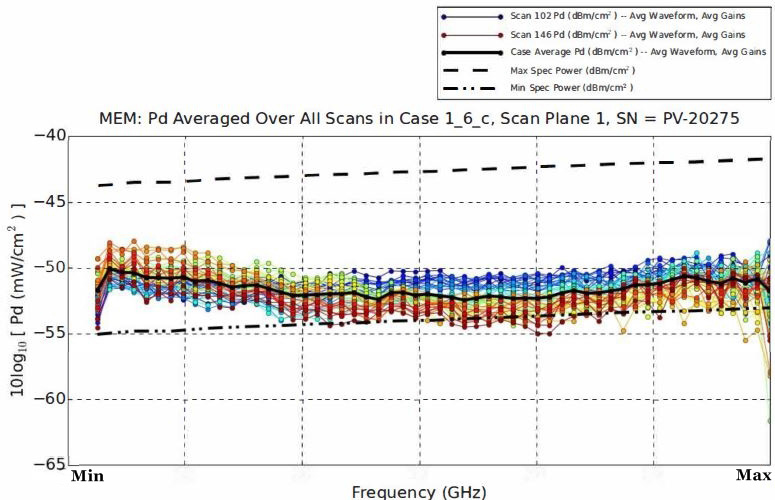
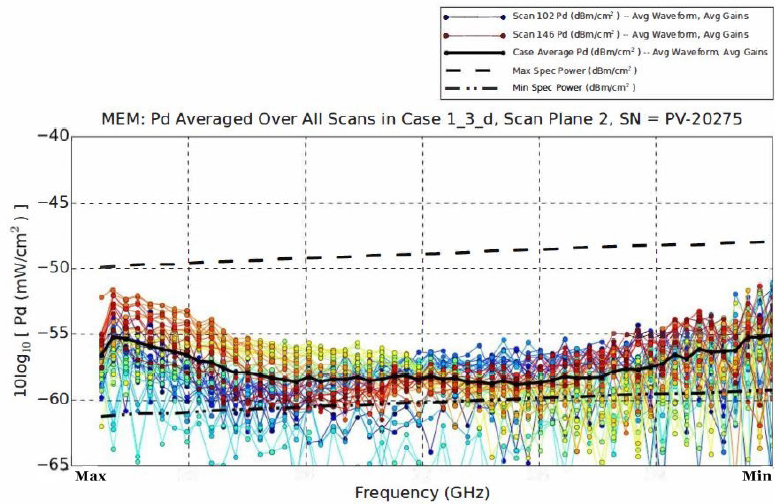
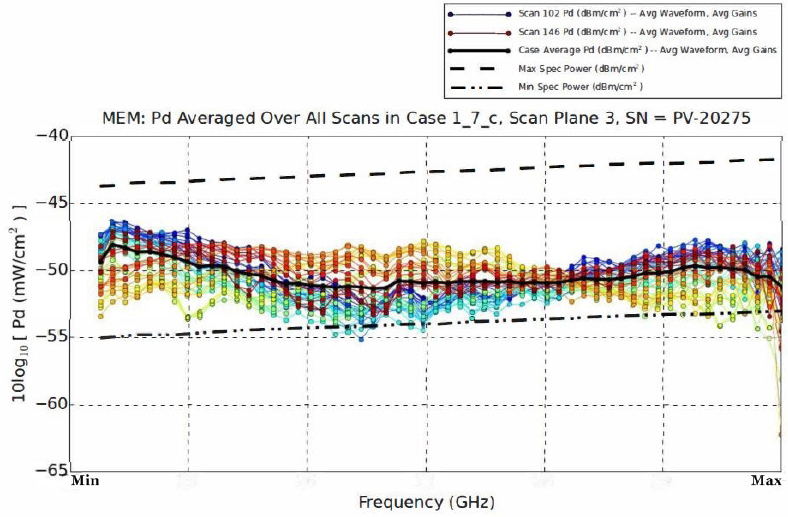
MEMPHIS (MEM) AIRPORT DATA

This section presents the MEM airport data. This was the sole ProVision 2 model machine measured in this effort. As with the other three airports, these are presented without additional comments, other than to remind the reader that beyond Scan Plane 4, further measurements were not performed at TYS and MEM airports, because they would not give any additional information of value. Figures F.9 to F.11 show the MEM airport data for Scan Planes 1, 2, and 3 respectively. The RF subsystem for ProVision ATD and ProVision 2 are identical, and the measurements at MEM airport are consistent with the other three airports.

Suggested Citation:"Appendix F: Additional Airport Data." National Academies of Sciences, Engineering, and Medicine. 2017. Airport Passenger Screening Using Millimeter Wave Machines: Compliance with Guidelines. Washington, DC: The National Academies Press. doi: 10.17226/24936.
×
Image
FIGURE F.9 Memphis International Airport (MEM) Scan Plane1 power density data versus height plus average of all waveforms.
Image
FIGURE F.10 Memphis International Airport (MEM) Scan Plane 2 power density data versus height plus average of all waveforms.
Suggested Citation:"Appendix F: Additional Airport Data." National Academies of Sciences, Engineering, and Medicine. 2017. Airport Passenger Screening Using Millimeter Wave Machines: Compliance with Guidelines. Washington, DC: The National Academies Press. doi: 10.17226/24936.
×
Image
FIGURE F.11 Memphis International Airport (MEM) Scan Plane 3 power density data versus height plus average of all waveforms.
Suggested Citation:"Appendix F: Additional Airport Data." National Academies of Sciences, Engineering, and Medicine. 2017. Airport Passenger Screening Using Millimeter Wave Machines: Compliance with Guidelines. Washington, DC: The National Academies Press. doi: 10.17226/24936.
×
Page 166
Suggested Citation:"Appendix F: Additional Airport Data." National Academies of Sciences, Engineering, and Medicine. 2017. Airport Passenger Screening Using Millimeter Wave Machines: Compliance with Guidelines. Washington, DC: The National Academies Press. doi: 10.17226/24936.
×
Page 167
Suggested Citation:"Appendix F: Additional Airport Data." National Academies of Sciences, Engineering, and Medicine. 2017. Airport Passenger Screening Using Millimeter Wave Machines: Compliance with Guidelines. Washington, DC: The National Academies Press. doi: 10.17226/24936.
×
Page 168
Suggested Citation:"Appendix F: Additional Airport Data." National Academies of Sciences, Engineering, and Medicine. 2017. Airport Passenger Screening Using Millimeter Wave Machines: Compliance with Guidelines. Washington, DC: The National Academies Press. doi: 10.17226/24936.
×
Page 169
Suggested Citation:"Appendix F: Additional Airport Data." National Academies of Sciences, Engineering, and Medicine. 2017. Airport Passenger Screening Using Millimeter Wave Machines: Compliance with Guidelines. Washington, DC: The National Academies Press. doi: 10.17226/24936.
×
Page 170
Suggested Citation:"Appendix F: Additional Airport Data." National Academies of Sciences, Engineering, and Medicine. 2017. Airport Passenger Screening Using Millimeter Wave Machines: Compliance with Guidelines. Washington, DC: The National Academies Press. doi: 10.17226/24936.
×
Page 171
Suggested Citation:"Appendix F: Additional Airport Data." National Academies of Sciences, Engineering, and Medicine. 2017. Airport Passenger Screening Using Millimeter Wave Machines: Compliance with Guidelines. Washington, DC: The National Academies Press. doi: 10.17226/24936.
×
Page 172
Suggested Citation:"Appendix F: Additional Airport Data." National Academies of Sciences, Engineering, and Medicine. 2017. Airport Passenger Screening Using Millimeter Wave Machines: Compliance with Guidelines. Washington, DC: The National Academies Press. doi: 10.17226/24936.
×
Page 173
Next: Appendix G: Uncertainty Analysis »
Airport Passenger Screening Using Millimeter Wave Machines: Compliance with Guidelines Get This Book
×
 Airport Passenger Screening Using Millimeter Wave Machines: Compliance with Guidelines
Buy Paperback | $85.00 Buy Ebook | $69.99
MyNAP members save 10% online.
Login or Register to save!
Download Free PDF

The Transportation Security Administration requested a study by the National Research Council (NRC) to establish the Committee on Airport Passenger Screening: Millimeter Wave Machines to evaluate two models of active millimeter wave scanners: the L3 ProVision 1 and L3 ProVision 2.

Airport Passenger Screening Using Millimeter Wave Machines provides findings and recommendations on compliance with applicable health and safety guidelines and appropriateness of system design and procedures for preventing over exposure. This study addresses the issue of whether millimeter wave machines used at airports comply with existing guidelines and whether it would be possible for anything to go wrong with the machines so that, by mistake, it exposes a person to more than 10 W/m2.

READ FREE ONLINE

  1. ×

    Welcome to OpenBook!

    You're looking at OpenBook, NAP.edu's online reading room since 1999. Based on feedback from you, our users, we've made some improvements that make it easier than ever to read thousands of publications on our website.

    Do you want to take a quick tour of the OpenBook's features?

    No Thanks Take a Tour »
  2. ×

    Show this book's table of contents, where you can jump to any chapter by name.

    « Back Next »
  3. ×

    ...or use these buttons to go back to the previous chapter or skip to the next one.

    « Back Next »
  4. ×

    Jump up to the previous page or down to the next one. Also, you can type in a page number and press Enter to go directly to that page in the book.

    « Back Next »
  5. ×

    Switch between the Original Pages, where you can read the report as it appeared in print, and Text Pages for the web version, where you can highlight and search the text.

    « Back Next »
  6. ×

    To search the entire text of this book, type in your search term here and press Enter.

    « Back Next »
  7. ×

    Share a link to this book page on your preferred social network or via email.

    « Back Next »
  8. ×

    View our suggested citation for this chapter.

    « Back Next »
  9. ×

    Ready to take your reading offline? Click here to buy this book in print or download it as a free PDF, if available.

    « Back Next »
Stay Connected!